Subjective Wellbeing: Stress
←
→
Page content transcription
If your browser does not render page correctly, please read the page content below
Subjective Wellbeing: Stress
Downloaded from https://www.canterburywellbeing.org.nz/our-wellbeing/subjective-wellbeing/stress/ on 16/04/2019 8:47 AM

Stress is the non-specific response that a person might experience when faced with a demand for change (a stressor) [13].
While stress can stimulate positive responses, studies of the effects of stress on health are usually concerned with the negative
influence stress can have on how people feel emotionally, mentally, and physically, and also how stress influences health
behaviours. Long-term stress can increase the risk of poor health and wellbeing [14,15] and is associated with conditions like:
high blood pressure, heart disease, obesity and diabetes, and depression or anxiety [16][17]. Stress may influence wellbeing
through direct biological responses, or indirectly through unhealthy behaviours such as smoking, lack of exercise, or excessive
alcohol consumption. Self-reported stress has been measured in the Canterbury Wellbeing Survey [11,17] since 2012, using a
single question [18].

This indicator presents the proportion of those aged 18 years and over indicating that they experienced stress that has had a
negative effect sometimes, most of the time or always in the past 12 months, as reported in the Canterbury Wellbeing Survey
2012 to 2018.

The figure shows a gradual decline in the proportion of respondents in greater Christchurch experiencing stress sometimes,
most of the time or always, since the 2012 baseline. The current result is statistically significantly lower than all other years prior
to 2017. The overall trend of reduction in the proportion of respondents experiencing stress sometimes, most of the time or
always is statistically significant; dropping from 80 percent of respondents in 2012, to 67 percent in 2018.

                                                                                  © Crown copyright 2019 Printed on: 16/04/2019 Page: 1/6
Breakdown by Territorial Authority

The figure shows that the proportion of respondents reporting stress sometimes, most of the time, or always, for Selwyn District,
Waimakariri District, and Christchurch City residents was not statistically significantly different in 2018 (65%, 65%, and 68%,
respectively). While respondents from Selwyn District and Waimakariri District appear to have reported a lower frequency of
stress overall between 2012 and 2018, these differences are mostly not statistically significant.

Breakdown by ethnicity

The figure shows the proportion of respondents reporting stress sometimes, most of the time, or always, for European
respondents, Māori respondents, and for Pacific/Asian/Indian respondents (67.6%, 66.9%, and 71.3%, respectively, in 2018).
While European respondents appear to have reported a slightly lower frequency of stress, overall, compared with Māori and
Pacific/Asian/Indian respondents, between 2012 and 2018, these differences are not statistically significant (with the exception
of European compared with Māori, for the two time-points, 09/2012 and 09/2013).

                                                                             © Crown copyright 2019 Printed on: 16/04/2019 Page: 2/6
Breakdown by age
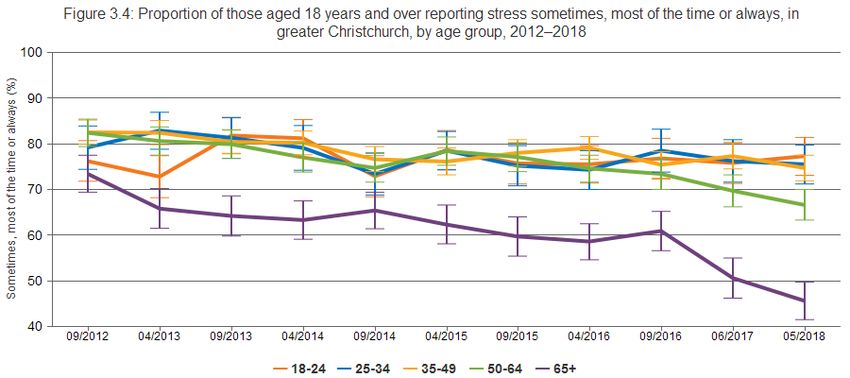
The figure shows the proportion of respondents reporting stress sometimes, most of the time, or always, by age group. The
figure shows a clear pattern of less frequent self-reported stress for respondents aged 65 years and over. For this group, the
proportion reporting stress at least sometimes has averaged approximately 10 percentage points less than for all of the other age
groups, for the period from 2013 to 2018. These differences are statistically significant. Further, the stress level for the 65 years
and over group was statistically significantly lower in 2017 and 2018, compared with all previous years.
Breakdown by gender
The figure shows a clear pattern of a lower proportion of male respondents experiencing stress at least sometimes, compared
with female respondents, throughout the time-series. For male respondents, the proportion experiencing stress at least
sometimes has been approximately 5 percentage points below that of female respondents, across all years in the time-series
(65.0% and 70% respectively, in 2018). The difference is statistically significant at all time-points.
© Crown copyright 2019 Printed on: 16/04/2019 Page: 3/6Breakdown by income The figure shows the proportion of respondents reporting stress sometimes, most of the time, or always, for the annual household income groups
Source: Canterbury District Health Board.
Survey/data set: Canterbury Wellbeing Survey to 2018. Access publicly available data from the Community and Public Health (Canterbury DHB)
website www.cph.co.nz/your-health/wellbeing-survey/
Source data frequency: Annually.

Metadata for this indicator is available at https://www.canterburywellbeing.org.nz/our-wellbeing/index-data

                                                                                         © Crown copyright 2019 Printed on: 16/04/2019 Page: 5/6
REFERENCES
This is the full reference list for Subjective Wellbeing.
1 Aked J, Marks N, Cordon C, Thompson S (2008) Five Ways to Wellbeing: A report presented to the Foresight Project on communicating
the evidence base for improving people’s well-being. London: New Economics Foundation.
2 Diener E, Wirtz D, Tov W, Kim-Prieto C, Choi D, et al. (2009) New measures of well-being: Flourishing and positive and negative feelings.
Social Indicators Research 39: 247-266.
3 UK Government (2010) Confident communities, brighter futures: a framework for developing wellbeing. UK Government: Department of
Health and New Horizons.
4 Bidwell S (2011) Long term planning for recovery after disasters: ensuring health in all policies (HiAP). Community and Public Health for
Healthy Christchurch. 4–5 p.
5 Beaglehole B, Mulder RT, Frampton CM, Boden JM, Newton-Howes G, et al. (2018) Psychological distress and psychiatric disorder after
natural disasters: systematic review and meta-analysis. The British Journal of Psychiatry: 1-7.
6 Galea S, Nandi A, Vlahov D (2005) The epidemiology of post-traumatic stress disorder after disasters. Epidemiol Rev 27: 78-91.
7 Lock S, Rubin GJ, Murray V, Rogers MB, Amlot R, et al. (2012) Secondary stressors and extreme events and disasters: a systematic
review of primary research from 2010-2011. PLoS Curr 4.
8 Bonanno GA, Diminich ED (2013) Annual Research Review: Positive adjustment to adversity -Trajectories of minimal-impact resilience and
emergent resilience. Journal of child psychology and psychiatry, and allied disciplines 54: 378-401.
9 Ramanathan CS, Dutta S, editors (2013) Governance, Development and Social Work. London: Routledge Publishers (Taylor and Francis
Group).
10 Bowling A (2001) Measuring Disease. A Review of Disease-specific Quality of Life Measurement Scales. Buckingham: Open University
Press.
11 CERA (2012) CERA Wellbeing Survey 2012 Report, prepared by AC Nielsen for the Canterbury Earthquake Recovery Authority. AC
Nielsen and the Canterbury Earthquake Recovery Authority.
12 Topp CW, Ostergaard SD, Sondergaard S, Bech P (2015) The WHO-5 Well-Being Index: a systematic review of the literature. Psychother
Psychosom 84: 167-176.
13 Selye H (1936) A syndrome produced by diverse nocuous agents. Nature 138.
14 Selye H (1976) Stress in health and disease. Stoneham MA: Butterworth.
15 Chandola T, Britton A, Brunner E, Hemingway H, Malik M, et al. (2008) Work stress and coronary heart disease: what are the
mechanisms? European Heart Journal 29: 640-648.
16 World Health Organization (2013) Guidelines for the management of conditions specifically related to stress. Geneva: WHO.
17 Canterbury DHB (2018) Canterbury Wellbeing Survey, June 2018: Report prepared by Nielsen for the Canterbury District Health Board
and partnering agencies. Christchurch: Canterbury District Health Board.
18 www.qualityoflifeproject.govt.nz/survey.htm.
19 Statistics New Zealand (2016) New Zealand General Social Survey 2016. Wellington; Statistics New Zealand.
© Crown copyright 2019 Printed on: 16/04/2019 Page: 6/6You can also read