The Pediatric Dental Workforce in 2016 and Beyond - Health ...
←
→
Page content transcription
If your browser does not render page correctly, please read the page content below

The Pediatric Dental Workforce in
2016 and Beyond
Commissioned by the American Academy of Pediatric Dentistry (AAPD)

September 9, 2019

Tim Dall, Ritashree Chakrabarti & Ryan Reynolds: IHS Markit
Simona Surdu, Margaret Langelier, Gaetano Forte: Center for Health Workforce Studies

Surdu et al., Journal of the American Dental Association. July 2019, Vol. 150:7, pp. 609-617.
2

Study Purpose, Background & Definitions

• Study purpose: assess current and anticipated future adequacy of supply of pediatric dentists
• Background
  > Caries remains the most common chronic disease of childhood, affecting nearly one-fifth of children aged 5 years or younger and one-half
    of children aged 6 through 10 years
  > Caries makes a child more vulnerable to various systemic infections that threaten oral health, overall health and quality of life
  > Pediatric dentists play a key role in ensuring access to high-quality oral health care for children and for people with special health care
    needs
    – 2016 ADA Masterfile: 196,468 dentists of whom 7,583 (3.9%) were pediatric dentists—not all in active practice; 80% increase in pediatric
      dentist supply since 2001 (n=4,213)
• Definitions
  > Demand—level of oral health services people are able and willing to pay for
  > Need—clinical definition; guidelines on periodicity of examination, preventive dental services, anticipatory guidance, and oral treatment for
    children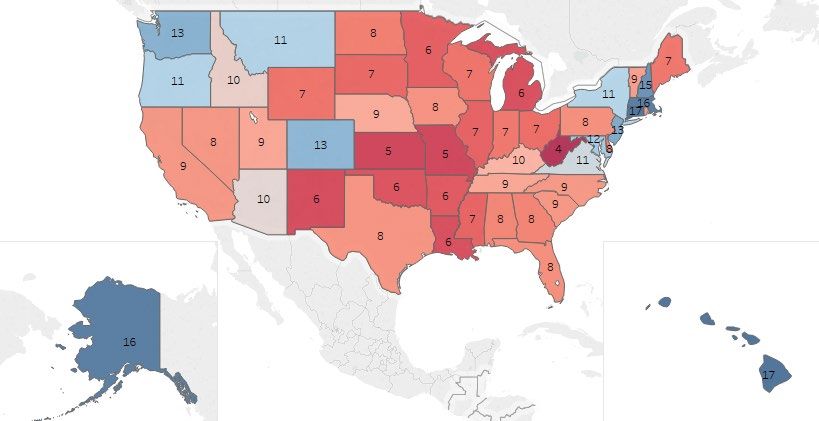
3

Study Methods Overview

• Survey. An online survey of pediatric dentists was fielded in 2017 to all members of the AAPD with a US address
  > 2,546 surveys completed for a response rate of 39.1%
  > Sample weighting applied to ensure representativeness
• Modeling. Future supply & demand projected using health workforce simulation model
  > Simulation model has been used for studies with federal and state governments, associations and health plans
• Literature review. Examined topics related to children’s oral health need, utilization and care delivery
• Interviews. Conducted phone interviews with sample of pediatric dentists

4

Integrated Workforce Microsimulation Model

                                                                             Entrants
                                                   Attrition
                                                                Continue

                    Population                                 Health Care                       Provider
                                         Health
                •   Demographics                                Demand             Provider
                •   Disease               Care                                                   Demand
                                                           • By setting            Staffing   • By setting
                •   Lifestyle choices     Use
                                                           • By disease/           Patterns   • By occupation
                •   Socioeconomic       Patterns
                                                             specialty                        • By specialty
                •   Insurance

                                                   Patient and Population
                                                    Management, Disease
                                                   Prevention & Treatment
5 Supply Modeling • Estimated 6,530 pediatric dentists in US in 2016, reflecting AAPD membership and ∼6% of PDs not AAPD members • Modeled 448 people enrolled in PD programs/year; 63.6% female • 2017 Practice Survey of Pediatric Dentists (PD) > Weekly patient hours worked, modeled by PD age and gender > Age of retirement/intention to retire, modeled by PD age, plus mortality rate to estimate workforce attrition • Modeled cross-state migration (little migration after completing training) • Modeled alternative supply scenarios under different assumptions > Status quo—continuation of current training pipeline, hours worked and retirement intention patterns > 10% increase and 10% decrease in number of PDs trained annually > Retire 2 years earlier, 2 years later than indicated by retirement intention • Defined full time equivalent (FTE) PD as working 32.6 hours/week in patient care activities—average based on survey responses
6

Demand Scenarios Modeled

 > Status Quo, assumes current patterns of dental care use and delivery continue
   – PDs provide approximately 43% of the dental care provided to children under age 2, 40% of the care provided to children age 2 to 4,
     23% of the care provided to children over age 5 (approximately 26% of all the dental care provided to children)
   – Remainder of care provided to children is provided by general dentists
 > Increased PD Market Share. With input from the project advisory group, modeled
   – PDs provided 80% care to children ages 5 to 12, 20% of care for children ages 13 to 17 (approximately 62% of care to children would be
     provided by PDs)
 > Access Barriers Removed
   – Modeled PD demand assuming disadvantaged populations have dental care utilization patterns similar to a population with fewer access
     barriers (ie, white, non-Hispanic, with insurance, and in the highest income bracket).
   – Scenario approximates a needs-based scenario
7
Differences in Dentists’ Perceptions of Pediatric Dental Workforce Shortages by
Type of Geography
• Dentists with practice locations in the Midwest were more • Pediatric dentists with primary work settings in counties with
likely to indicate perception of a shortage of pediatric populations of 275,000 or fewer people were more likely to
dentists or adequacy of current supply in the local area than indicate being aware of concerns in their state about the
were dentists in other regions of the US. availability of pediatric dentists in less populated areas than
were dentists practicing in larger population counties.
Dentists’ Rating of the Current Supply of Pediatric Dentists in
Practice Area by Region in US, 2016 Dentists’ Awareness of Concerns about the Availability of
Pediatric Dentists in Less Populated Areas of Their State of
Practice, 2016
Dentists' ratings of the
current supply of Northeast Midwest South West
Nationwide Concerns about
pediatric dentists in Region Region Region Region
the availability of 88,001 275,001 675,001
their local area 88,000 or 1,500,001
pediatric dentists to to to
less or more
in less populated 275,000 675,000 1,500,000
There is a shortage 11.9% 16.1% 8.9% 6.1% 10.1% areas
The current supply is Yes 68.6% 56.9% 53.5% 46.9% 54.9%
39.9% 60.9% 44.7% 39.5% 45.2%
adequate
No 20.8% 26.0% 30.0% 28.3% 19.6%
There is an oversupply 48.2% 23.0% 46.4% 54.4% 44.7% Don't know 10.6% 17.2% 16.5% 24.8% 25.6%
Total N 347 299 619 437 1,701 Total N 127 297 347 444 3538 FTE Pediatric Dentists per 100,000 Children, 2016 (national average is 9 per 100,000)
9

Perceptions of Practice Busyness Varied by Employment Situation
 • Perceptions of practice busyness among pediatric dentists                   • Pediatric dentists practicing in counties where the
   changed between 2011 and 2016. The proportion of pediatric                    population was 88,000 or less were more likely to indicate
   dentists who treated all patients but felt overworked                         they were too busy to treat all patients (15.7%) than dentists
   decreased from 16.2% in 2011 to 15.2% in 2016 while those                     in more populated counties.
   who treated all patients but were not overworked increased
   from 49.3% in 2011 to 57.9% in 2016.                                        Perceptions of Busyness By Size of County in Which Primary
                                                                                            Work Setting Was Location, 2016

 Perceptions of Busyness by Employment Situation and Gender,
                                                                                Which of the following
                        2011 and 2016                                                                                  88,001    275,001 675,001
                                                                               best describes you in your 88,000 or                                1,500,001
                                                                                                                         to        to        to
                                     2011                     2016              primary setting during      less                                    or more
                                                                                                                       275,000   675,000 1,500,000
                           Treated all  Treated all Treated all  Treated all             2016?
 Pediatric Dentists
                              but         but not      but         but not      Provided care to all who
                          overworked overworked overworked overworked           requested appointments         58.0%   59.7%     58.4%    57.4%     56.1%
 Employment Situation                                                           but was not overworked
 All owners                 16.6%        48.8%        14.7%        56.9%        Provided care to all who
  Solo practitioners        15.1%        46.5%        15.4%        53.5%        requested appointments         14.3%   17.2%     15.3%    14.9%     14.0%
  Non-solo owner            18.2%        51.4%        13.2%        64.7%        but was overworked

 Employed                     --         47.9%        15.9%        59.6%        Too busy to treat all people
                                                                                                               15.7%   11.8%      6.4%      9.5%     5.5%
                                                                                requesting appointments
 Gender
  Male                      16.3%        49.9%        14.4%        56.8%        Not busy enough, could
                                                                                                               12.1%   11.3%     19.9%    18.3%     24.5%
  Female                    16.1%        48.2%        15.9%        59.0%        have treated more patients
 All pediatric dentists     16.2%        49.3%        15.2%        57.9%        Total N                          151     345       416       508      415
10
Projected Growth in Pediatric Dentist Supply, 2016-2030
Full-Time-Equivalent Pediatric Dentists
0 500 1,000 1,500 2,000 2,500 3,000 3,500 4,000 4,500 5,000
10% More Graduates 4,690
Retire 2 Years Later 4,320
Supply Scenario
Status Quo 4,030
Retire 2 Years Earlier 3,720
10% Fewer Graduates 3,40011
Projected Change in Pediatric Dentist Demand, 2016-2030
Full Time Equivalent Pediatric Dentists'
0 2,000 4,000 6,000 8,000 10,000 12,000
Status Quo (Pediatric) 140
2
Access Barriers Removed 1,830 7 2,100
(Pediatric) 0
4
Increased Market Share 9,990 8 10,470
0
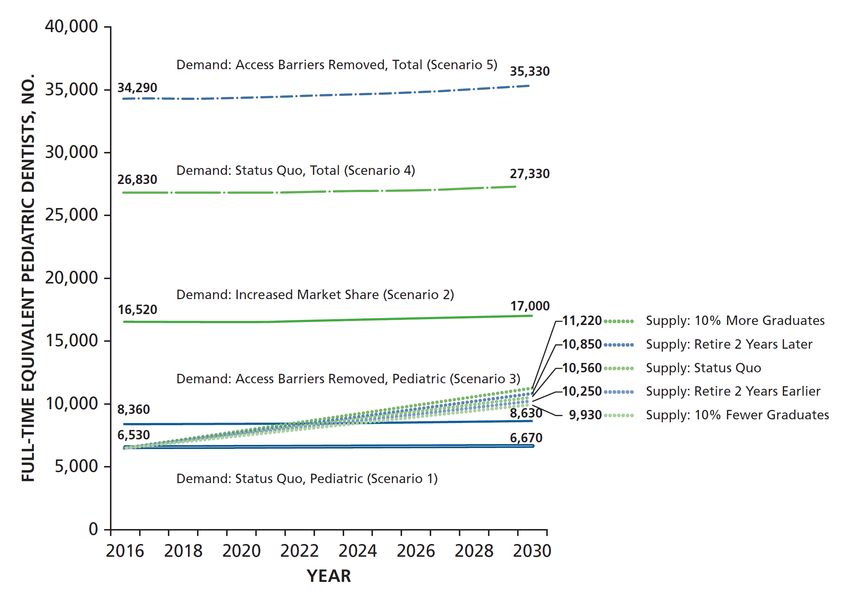
Scenario Impact Changing Demographics12 Supply and Demand: 2016 to 2030
13

Conclusions
• Modeling
  > Supply of pediatric dentists continues to grow rapidly
  > Demand for dental care for children will grow slowly, reflecting low population growth
  > How might demand for pediatric dentists grow at a faster rate than growth in number of children? (grow the pie, or redistribute the pie)
    – Achieve national goals of improving access to care—either than new policies or programs, or reducing financial & other barriers to care
    – Percentage of oral health services to children provided by PDs grows; percentage provided by general dentists declines
  > The national supply of pediatric dentists appears adequate to meet current demand for services; however, the geographic distribution of
    dentists is uneven based on region and population density
• Key findings from survey
  > The oral health care delivery system is changing; the profession appears to be accommodating change through practice consolidations to
    gain efficiencies of scale
  > The changing gender composition of the workforce may further impact distribution recognizing an apparent preference among women
    dentists for practice in larger population areas
  > The profession is poised to meet the challenges of providing low-income children with a dental home but professionals are concerned
    about trends related to public insurance and the impact of reduced payments on practice sustainability
You can also read