Experimental Research in Subseasonal Forecasting of Atmospheric Rivers
←
→
Page content transcription
If your browser does not render page correctly, please read the page content below

Experimental Research in Subseasonal Forecasting of
                  Atmospheric Rivers
Mike DeFlorio1, Duane Waliser2,3, F. Martin Ralph1, Luca Delle Monache1, Bin Guan2,3, Alexander Goodman2,
                                    Aneesh Subramanian4, Zhenhai Zhang1, Frédéric Vitart5

    Groundwater Resources Association of California “Bridging the Gap” Conference; San Diego, CA

   1Center   for Western Weather, Water and Extremes, University of California, San Diego, Scripps Institution of Oceanography; La Jolla, CA
                                2NASA   Jet Propulsion Laboratory/California Institute of Technology; Pasadena CA
         3Joint   Institute for Regional Earth System Science and Engineering, University of California, Los Angeles; Los Angeles, CA
                                                  4University   of Colorado Boulder; Boulder, CO
                                     5European   Centre for Medium-Range Weather Forecasts; Reading, UK
                                                                                                                A multi-institutional research effort
                                                                                                                  sponsored by California DWR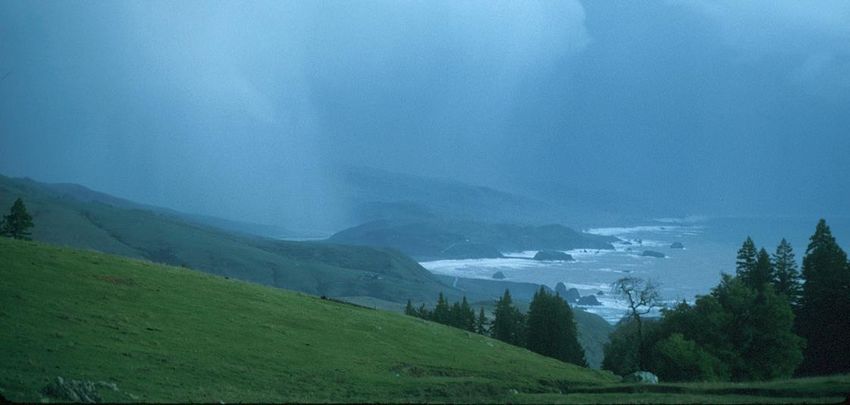
Atmospheric rivers and their associated flood and hazard risks
     occur globally and influence climate and water extremes.

                                                                                         NOAA ESRL

Over 90% of poleward moisture transport at midlatitudes is by ARs that take up only ~10% of the zonal circumference.
                                                                                                        Zhu and Newell 1998
                                                                                                        Ralph et al. 2004

           In the west, ARs
         account for ~40% of
         annual precipitation
                                                                          X
          and most floods.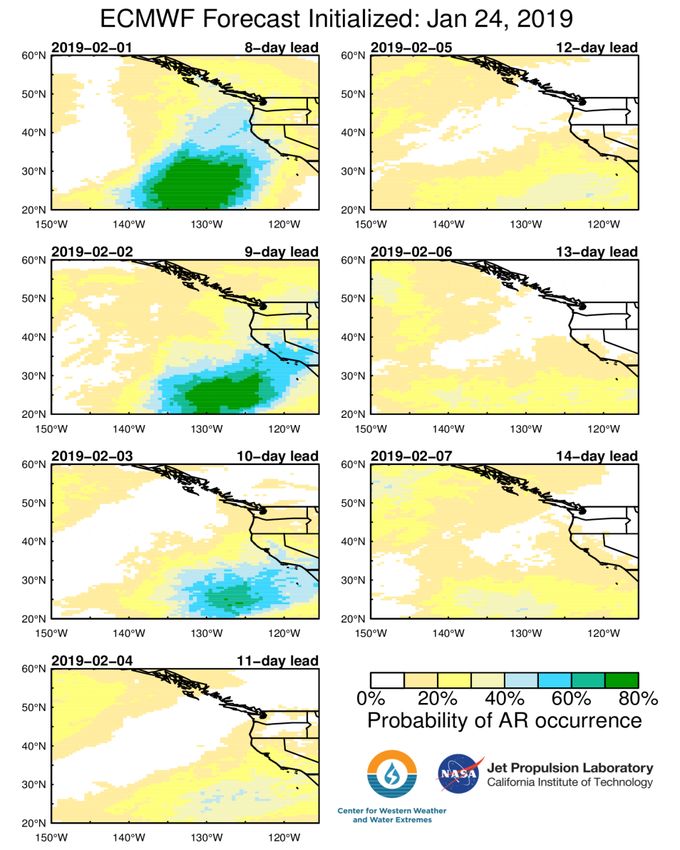
What does an Atmospheric River look like from space?
Atmospheric rivers:

                   • can carry as much as water
                     as 25 Mississippi Rivers,
                     and can provide up to 50%
                     of West Coast precipitation

                   • are about 500 miles wide
                     (Ralph et al. 2017, Guan et
                     al. 2018) and are located
                     above the lowest mile of the
                     atmosphere

                   • sometimes tap tropical
                     moisture near Hawaii,
                     transporting concentrated
                     water vapor for thousands
                     of miles
Source: NASA JPL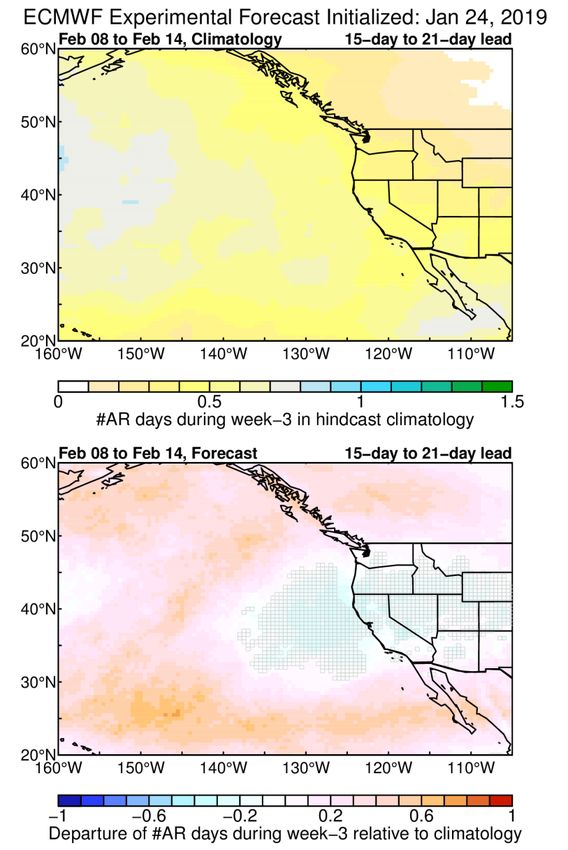
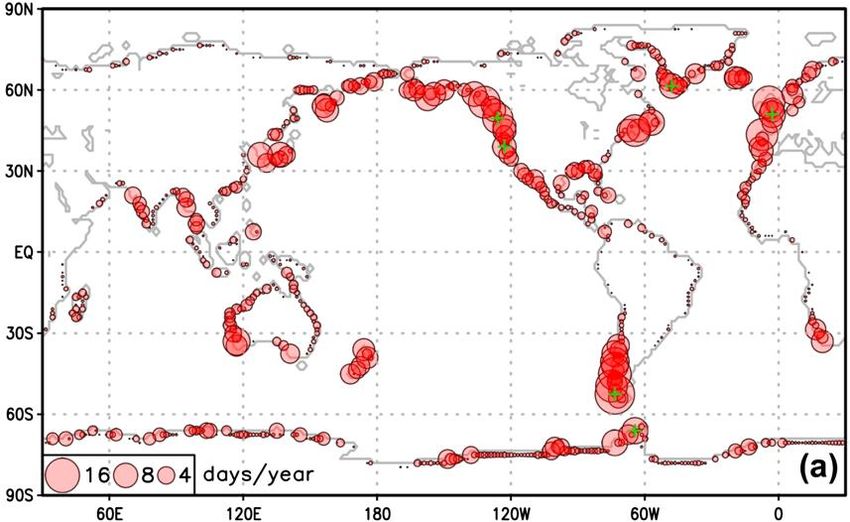
Where do atmospheric rivers make landfall most often?

                                          Guan and Waliser 2015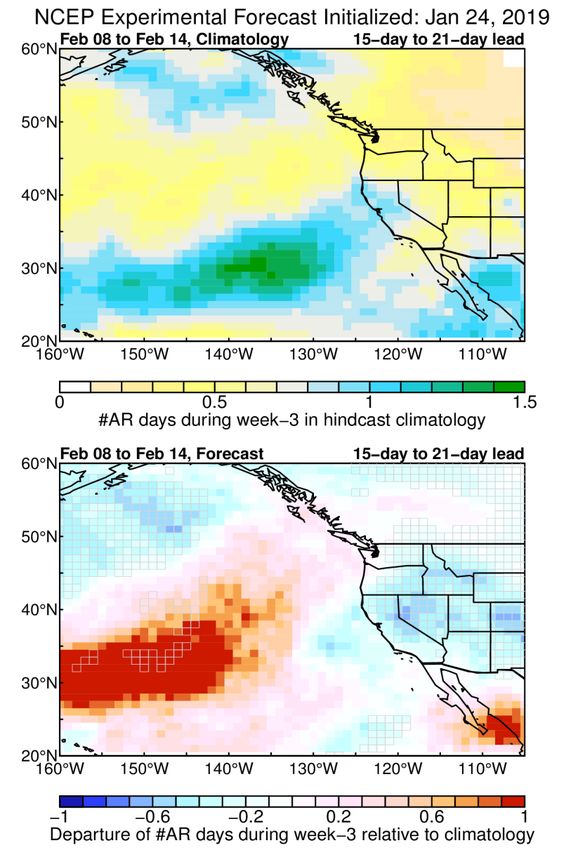
Why are our water challenges so unique in California?
Ratio of Year-to-Year Variation in Precipitation over Average Precipitation
Annual precipitation Annual precipitation
“bucket” for southern “bucket” for eastern
California half of US Year-to-
year
variations
~20%
Year-to-
year
variations
~70%
Figure credit: Peter Gibson (NASA JPL/CalTech),
adapted from Dettinger et al. 2011
Caption: Map shows the ratio of the year-to-year variability in precipitation divided by the long-term mean
precipitation (based on TRMM, 1998-2016). Thus, the eastern half of the country vary rarely experiences a significant
variation from their typical precipitation totals (~1-1.5m), about +/- 20% of the mean. Uniquely, in southern California,
the year-to-year variations are nearly as big as the total annual precipitation (~0.2-0.3m), i.e. +/- 70% of the mean.
Calculation using Tropical
Relative to the rest of the U.S., southern California experiences the Rainfall Measuring Mission
largest year to year swings in annual precipitation totals relative to its (TRMM) data, as originally
performed by Dettinger et
average values. al. 2011 with station data
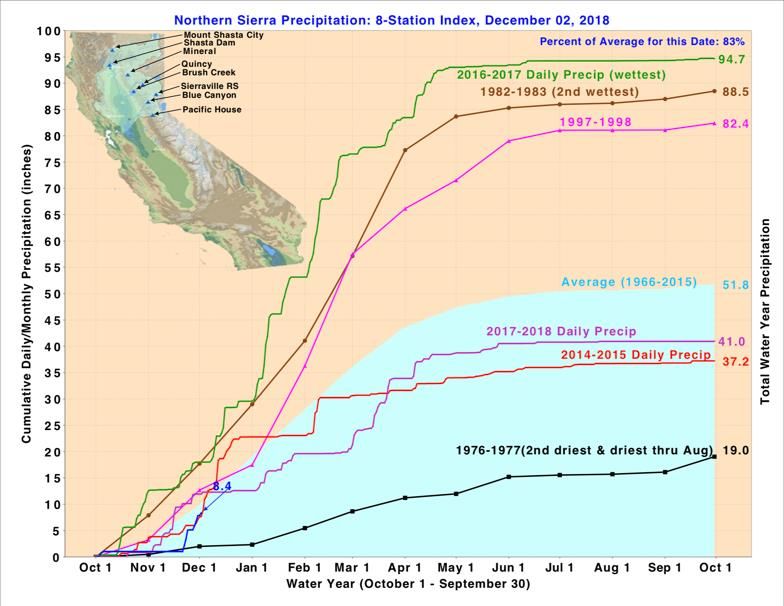
Dettinger et al. 2011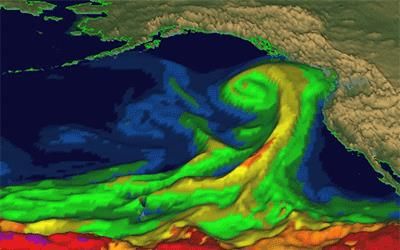
• ~ 14% of total Water
  Year precip in 2016-
  2017 fell in a ~10-
  day period in early
  January (13’’ of total
  94.7’’)

                           Source: CA DWR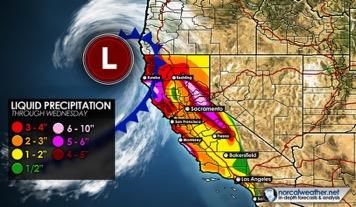
Our team at CW3E (UCSD-Scripps), NASA JPL, UCLA, and
ECMWF is focused on improving forecasts of atmospheric rivers 3
               weeks or more into the future.

A forecast this far into the future differs from a traditional weather
                               forecast.
Key Research Question Key Applications Question
What is the limit of global
subseasonal (1-week to 1-month) Can present-day subseasonal-to-
prediction skill of atmospheric river seasonal (S2S) forecast systems
occurrence, and how does it vary provide benefit to CA water
as a function of season, region, resource management decision
and certain large-scale climate makers?
conditions?Weather Forecasts (0-14 Days)
Hurricanes
Atmospheric Rivers
… cold spells, heat waves, thunderstorms/tornados, nor’easters, santa ana winds, etc“Short term” (S2S) Forecasts: Atmospheric Rivers (3-4 weeks)
Atmospheric Rivers
• How can we predict atmospheric rivers 3-4 weeks in the
future?
• Rather than try to predict the occurrence or evolution of a
single atmospheric river at such long leads, can we
predict the likelihood of an atmospheric river or expected
frequency of atmospheric rivers?A global, objective algorithm for AR identification
(Guan and Waliser 2015)
• Based on Integrated Vapor Transport (IVT) fields
and a number of common AR criteria (e.g. Ralph
et al. 2004)
• Applied to global hindcast/forecast systems and
reanalysis datasets
• Code and databases available at:
https://ucla.box.com/ARcatalog
• Databases include AR Date, IVTx,y, Shape, Axis,
Landfall Location, etc.
• Used for GCM evaluation (Guan and Waliser
2017), climate change projections (Espinoza et
al. 2018), & forecast skill assessment (DeFlorio et
al. 2018a and 2018b)Experimental S2S AR Forecasting for
Winter 2017-18 and 2018-19
Marty Ralph Aneesh
Duane Waliser Bin Guan Frédéric Vitart
Mike DeFlorio Subramanian
Alex Goodman Luca Delle Monache
Shakeel Asharaf Zhenhai Zhang
Jeanine Jones
Mike AndersonExperimental Multi-Model Atmospheric River Forecast*
Issued on Thursday, January 24, 2019
Contents:
Slide 1-2: “Weather” - Typical presentation of US west coast weather/precipitation forecast over lead
times of 1 to 14 days considering only the likelihood of an atmospheric river (AR) occurring on a given
forecast day. Novelty – a weather forecast presented only in terms of AR likelihood.
Slide 3-5: “week-3” - US west coast weather/precipitation forecast for week 3 considering the number of
atmospheric river days predicted to occur in the given forecast week.
Novelty – an S2S forecast presented only in terms of AR likelihood - specifically for week 3, an
extended/long-range or “subseasonal” prediction
Slides 1-3: ECMWF (European Centre for Medium-Range Weather Forecasts) forecast system
Slide 4: NCEP (National Centers for Environmental Systems) forecast system
*This is an experimental activity for the 2017-18 and 2018-19 winters. Methodologies and hindcast skill are documented
in DeFlorio et al. (2018a,b). Further validation of the real-time forecast results is required and underway. This phase of
the research includes gathering stakeholder input on the presentation of information – feedback is welcome.
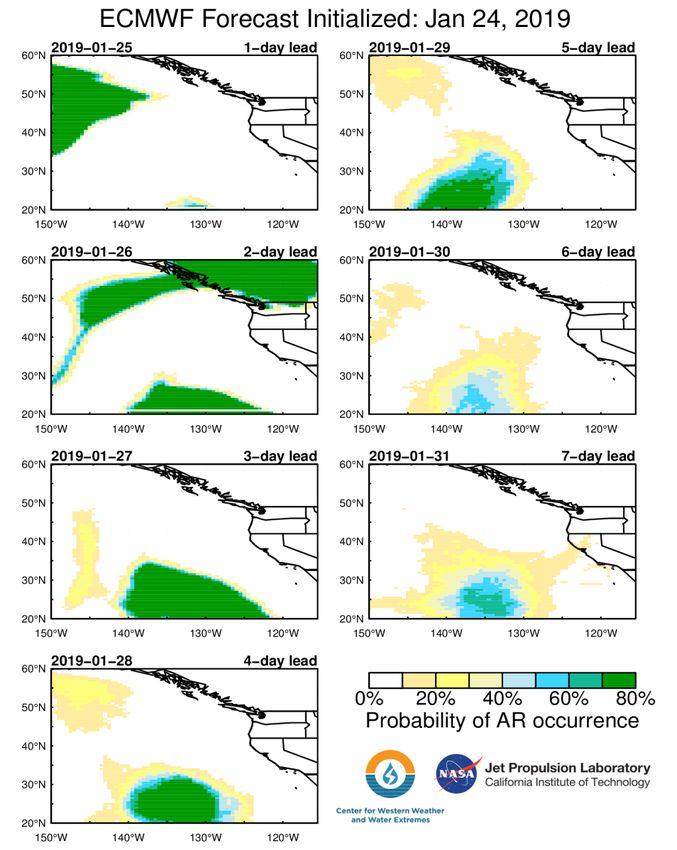
POC: Michael J. DeFlorio (mdeflorio@ucsd.edu)***EXPERIMENTAL AR FORECAST*** ECMWF
Week-1
(1-day to 7-day lead)
AR occurrence outlook issued on Thursday,
January 24, 2018 by M. DeFlorio, M. Ralph, D.
Waliser, L. Delle Monache, B. Kawzenuk, A.
Goodman, B. Guan, Z. Zhang, and A.
Subramanian using 51-member real-time ECMWF
data for an Experimental AR Forecasting
Research Activity sponsored by California DWR
Contact: M. DeFlorio
(mdeflorio@ucsd.edu)***EXPERIMENTAL AR FORECAST*** ECMWF
Week-2
(8-day to 14-day lead)
AR occurrence outlook issued on Thursday,
January 24, 2018 by M. DeFlorio, M. Ralph, D.
Waliser, L. Delle Monache, B. Kawzenuk, A.
Goodman, B. Guan, Z. Zhang, and A.
Subramanian using 51-member real-time ECMWF
data for an Experimental AR Forecasting
Research Activity sponsored by California DWR
Contact: M. DeFlorio
(mdeflorio@ucsd.edu)***EXPERIMENTAL AR FORECAST*** ECMWF
Week-3
(Combined 15-day to 21-day lead)
Top row: hindcast climatology (ECMWF 1996-2015 data)
Bottom row: real-time forecast minus climatology (ECMWF 51-
member ensemble)
Experimental AR occurrence outlook issued on
Thursday, January 24, 2018 by M. DeFlorio, M.
Ralph, D. Waliser, L. Delle Monache, B.
Kawzenuk, A. Goodman, B. Guan, Z. Zhang, and
A. Subramanian using 51-member real-time
ECMWF data for an Experimental AR Forecasting
Research Activity sponsored by California DWR
Contact: M. DeFlorio
(mdeflorio@ucsd.edu)***EXPERIMENTAL AR FORECAST*** NCEP
Week-3
(Combined 15-day to 21-day lead)
Top row: hindcast climatology (NCEP 1999-2010 data)
Bottom row: real-time forecast (NCEP 16-member ensemble)
Experimental AR occurrence outlook issued on
Thursday, January 24, 2018 by M. DeFlorio, M.
Ralph, D. Waliser, L. Delle Monache, B.
Kawzenuk, A. Goodman, B. Guan, Z. Zhang, and
A. Subramanian using 16-member real-time
NCEP data for an Experimental AR Forecasting
Research Activity sponsored by California DWR
Contact: M. DeFlorio
(mdeflorio@ucsd.edu)Summary • Atmospheric rivers occur globally and influence weather and water extremes. • Total amount of annual California precipitation is uniquely variable from year to year and is strongly influenced by occurrence or absence of atmospheric rivers. • Subseasonal (2-6 weeks and longer) forecasting of atmospheric rivers represents a critical decision-making time window for water resource managers. • Real-time experimental AR occurrence forecasting effort using ECMWF, NCEP, and ECCC data is ongoing (collaboration between CW3E and JPL), with engagement from NCEP. • Examining sources of increased prediction skill at longer lead times – e.g. atmospheric ridging events (e.g. Peter Gibson, JPL)
Thank you!

mdeflorio@ucsd.edu

  cw3e.ucsd.edu
   jpl.nasa.gov
You can also read