January 23, 2018 Presented by Betsy George - Ventura ...

Page created by Mitchell Mullins
 
CONTINUE READING
January 23, 2018 Presented by Betsy George - Ventura ...
January 23, 2018

   Presented by
   Betsy George
January 23, 2018 Presented by Betsy George - Ventura ...
Tonight's Topics

     Overall Themes of Education Budget

     State Budget and Economic Forecasts

     Education Budget

     Accountability System

     Ventura Unified and the State Budget
January 23, 2018 Presented by Betsy George - Ventura ...
Themes for the 2018-19 Governor’s Budget                                                                      2

                                                                        © 2018 School Services of California, Inc.

Fully fund the Local Control Funding Formula (LCFF) two years ahead of original 2020-
21 goal set in 2013
Student achievement rises to the highest priority and tests the Local Control Funding
Formula (LCFF)/Local Control and Accountability Plan (LCAP) model
   The true test of the LCFF/LCAP model is found in the performance of students, and
   it is now time to begin the analysis and reporting of overall results
At the end of next year, California will match the longest economic recovery since
World War II
January 23, 2018 Presented by Betsy George - Ventura ...
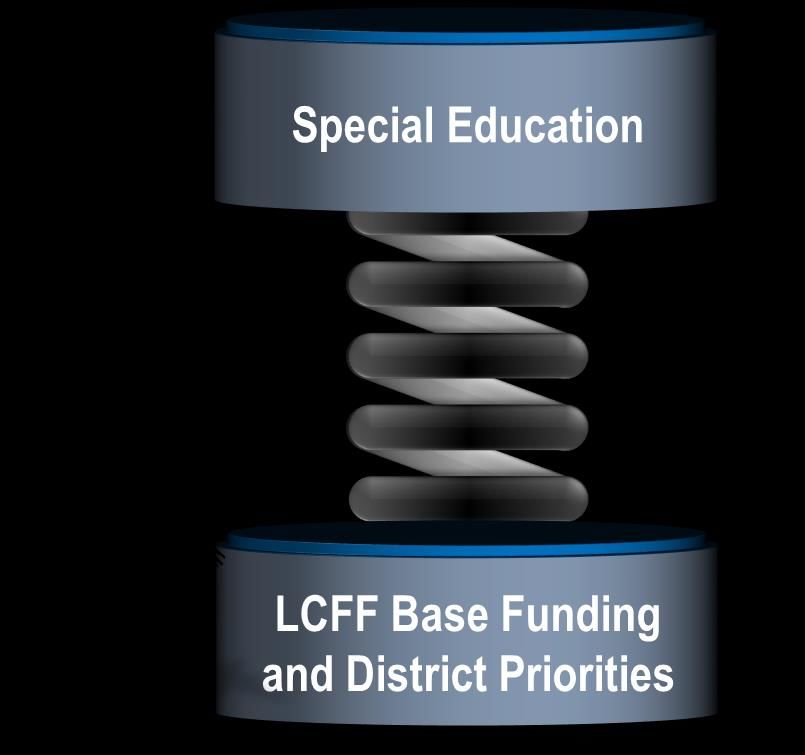
Overview of the State Budget
  and the State Economy
January 23, 2018 Presented by Betsy George - Ventura ...
Big Three Revenues – Personal Income Tax, Sales and                                           4
          Use Tax, and Corporation Tax
(in billions)

                                                                           $138.5

                                                                                               $138.6
                                                             $135.2
                                        $133.0

                                                    $133.0
                           $131.0
         $126.8

                  $126.8

                                                                                      $122.1
              2017-18
                                                 2018-19
                                                                                    2019-20
   LAO, November 2017               LAO, November 2017                2018-19 Governor's State Budget
   (Growth Scenario)                (Recession Scenario)
January 23, 2018 Presented by Betsy George - Ventura ...
Inflation Forecast                                                                                                                  5

                                                                                            © 2018 School Services of California, Inc.

                              Inflation Forecast
                              (Percent Change)

                       3.0%

                                                    3.0%

                                                                           2.9%
3.0%            2.8%

                                                           2.7%

                                                                    2.6%
                                             2.5%
        2.4%

                                     2.2%
2.5%

2.0%
                                                                                         2.0% Benchmark
1.5%
                                                                                  LAO, November 2017
1.0%                                                                              UCLA, December 2017
                                                                                  2018-19 Governor's State Budget
 0.5%

 0.0%
               2017                         2018                  2019
January 23, 2018 Presented by Betsy George - Ventura ...
Risks to the State Budget                                                                                       6

                                                                         © 2018 School Services of California, Inc.

The risks to the State Budget are the same as those that threaten our national economy
in part because of California’s unique standing as the 6th largest economy in the world
The top 1% of California’s taxpayers pay half the state income tax
The State Budget relies heavily on the highly volatile personal income tax (PIT) and any
modest change in PIT revenue has an amplified affect on the State Budget
Potential impact of the new federal tax law, particularly the newly created deduction
caps on both state and local taxes and mortgage interest
The Education Budget
Proposition 98 and the Major K-12 Proposals                                                      8

                                                           © 2018 School Services of California, Inc.

                              Fully fund LCFF

                              One-time discretionary funding
The
Governor’s                    Strong Workforce Program to establish a K-12
Budget                        specific component (CTE)
proposal
includes:                     Child Care and State Preschool to expand
                              inclusive care and education settings for
                              children up to 5 years old

                              Teacher Workforce to increase and retain
                              special education teachers
What’s Not in the Education Budget?                                                                            9

                                                                             © 2018 School Services of California, Inc.

The 2018-19 Budget proposal provides no funding for the following critical items:
       Increasing the LCFF base grant target to reach the funding level of the top ten states
       The growing local obligations for the California State Teachers’ Retirement System
       (CalSTRS) and the California Public Employees’ Retirement System (CalPERS) unfunded
       liability
       Home-to-School Transportation programs
       Increasing and equalizing Assembly Bill (AB) 602 base funding rates for special education
2018-19 LCFF Target Funding Factors                                                         10

Base grant is calculated for all students based on Average Daily Attendance (ADA)

Supplemental and concentration (S/C) grants are calculated based on the percentage of a
district’s enrolled students who are English learners (EL), free and reduced-price meal program
eligible, foster youth, or homeless – the unduplicated pupil percentage (UPP)

Ventura Unified’s 2017-18 UPP is 56.9%
                               2018-19 Proposed   20% Supplemental    50% Concentration Grant
               Grade Span
                                Grants Per ADA    Grant – Total UPP      – UPP Above 55%
                  K-3               $8,141             $1,628                 $4,071
                  4-6               $7,484             $1,497                 $3,742
                  7-8               $7,707             $1,541                 $3,854
                  9-12              $9,163             $1,833                 $4,582
Goal of LCFF - Equity                            11

                    Above and beyond
                    Targeted programs/services
                    Close the achievement gap
Special Education                                                                                                     12

1,750
                   VUSD SpEd Enrollment Trends
                                                                              17,500   • No mechanism in place to increase
          17,402
                       17,430
                                                                  1,706       17,400
                                                                                         funding based on student needs
                                     17,366
1,700
                                                1,678
                                                                              17,300   • General Fund contributions nearing
1,650
                                  1,649
                                                                              17,200
                                                                                         60% of total Special Education
                    1,605
                                                        17,125
                                                                                         expenditures
1,600                                                                         17,100

         1,558
                                                                              17,000
1,550                                                                16,981
                                                                              16,900
1,500
                                                                              16,800

1,450                                                                         16,700
        2012/13    2013/14       2014/15       2015/16           2016/17
                                SpEd     Total
Our Evolving
Accountability System
Fiscal Transparency                                                                                         14

                                                                        © 2018 School Services of California, Inc.

With concerns about the direct services provided to the students that generate LCFF
dollars, the Governor’s Budget proposes:
 Districts will be required to show how their budget expenditures align with the
 strategies detailed in their LCAPs
 The calculations and total amount of supplemental and concentration funding
 provided to each district under the LCFF will be reported on a single website
LCAP Decision-Making Guide                                                                          15

                                                                 © 2018 School Services of California, Inc.

                                                                      3
            1                              2
                                                                   Identify
         Identify                      Prioritize
                                                                 Actions and
          Needs                         Goals
                                                                  Services

The district’s leadership team    The district shares the   Based on the proposed
identifies the most significant   Dashboard and local       goals, the district works
areas of need for all students,   needs assessment with     with the LCAP committee
students in significant           an LCAP committee and     to identify proposed
student groups, and its           they work together to     actions and services for
unduplicated pupils using the     identify and prioritize   the next three years
Dashboard and local needs         goals
assessment
Ventura Unified and the State 2018-19
         Budget Proposal
Multiyear Projections                                                                             17

Under the revised                           VUSD’s Comparison of LCFF Revenue per ADA
projections, the steep   $10,000

increase happens in       $9,800
                                                                                              $9,802

2018-19 and the                                                           $9,593

remainder of the years    $9,600
                                                    $9,411
are Cost of Living        $9,400
                                                                                    $9,449
Adjustment (COLA) only
                          $9,200
                                                             $9,236
                          $9,000

                                   $8,899
                          $8,800
                                       2017-18          2018-19              2019-20         2020-21
                                                       2nd Interim    1st Interim
VUSD Progress Towards LCFF Implementation                                                                                          18

                                                       2017-18                                              2018-19
2017-18 at 97%                                $510
                         100%
    99.6% base            90%                                          $3,942

    92.1% supplemental    80%

                          70%

                          60%
Majority of additional
                          50%             $132,784                                             $134,751                    $15,256
funds in 2018-19 are
                          40%
projected to be                                                       $14,139

supplemental and          30%

concentration grant       20%

funds                     10%

                           0%
                                          17-18 Base             17-18 Supplemental            18-19 Base             18-19 Supplemental
                         (in thousands)
                                                                                Target   Gap
Employer Contribution to Employee Retirement Plan                                          19

 Future contribution rate increases for school employers are:

                                               State Teachers Retirement System (STRS)
Teachers, counselors,                           Set by State Statue                  Allowable
  librarians, nurses,                2017-18 2018-19      2019-20     2020-21     2021-22   2022-23
     principals, etc
                                     14.43% 16.28%        18.13%       19.1%       20.1%     21.1%

                                               Public Employee Retirement System (PERS)
Office staff, bus drivers,            Actual                          Projected
 custodians, cafeteria
      workers, etc
                                     2017-18 2018-19      2019-20     2020-21     2021-22   2022-23
                                     15.531% 18.1%         20.8%       23.8%       25.2%     26.1%
Declining Enrollment                                                    20

                   VUSD Enrollment Trend
         17,506 17,509
                         17,429 17,402 17,430
17,371                                          17,366

                                                         17,125

                                                                  16,981

                                                                           16,813
Enacting the State Budget                                                                                 21

                                                                          © 2018 School Services of California, Inc.

While the State Budget process is complicated and covers six months, here’s the abbreviated
edition of the process between January and the May Revision
       January 10           February           Early Spring       Early-to-Mid May

    Governor             Budget trailer       Budget                Governor
    introduces State     bills are            subcommittees        releases May
    Budget proposal      released,            examine              Revision
                         providing            Governor’s and
    Budget bill                               legislative
                         critical details
    introduced in both                        proposals
                         to the January
    houses shortly
                         proposal
    thereafter
Final Thoughts                                                                                            22

                                                                    © 2018 School Services of California, Inc.

 2nd Interim Budget presented to the board on March 13th will include the
 2018/19 Governor's budget proposal assumption in the Multiyear Projections
 (MYP)

 Continue 2018/19 budget development

 Concentrate on developing programs that increase or improve services to the
 District's enrolled students who are English learners (EL), free and reduced-
 price meal program eligible, foster youth, or homeless

 Continue to focus on improving outcomes for all students and lifting the
 performance of student groups identified by the Dashboard
Thank You
You can also read