Gardner Denver Q3 2018 Earnings Presentation - October 26, 2018 - Investors
←
→
Page content transcription
If your browser does not render page correctly, please read the page content below
Gardner Denver
Q3 2018 Earnings Presentation
October 26, 2018

Replay Information

▪ Dial toll-free:   +1.877.344.7529

▪ International:    +1.412.317.0088

▪ Conference ID:    #10125336

▪ Log on to:        http://investors.gardnerdenver.com

                                                         2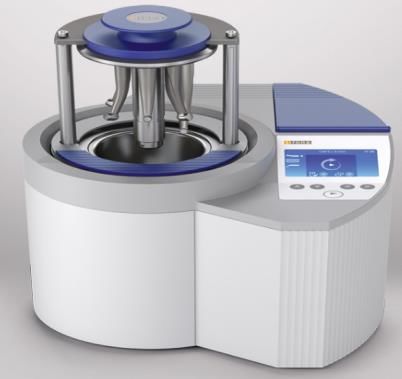
Disclaimer

Forward-Looking Statements
During the course of this presentation, we may make “forward-looking statements” within the meaning of the US
federal securities laws. In fact, all statements made during this presentation other than statements of historical fact
are forward-looking statements. Words such as “expects,” “anticipates,” “believes,” “estimates,” “plans,” “intends,”
“projects” and “indicates” and variations of such words or similar expressions are intended to identify forward-
looking statements. Although they reflect our current expectations, these statements are not guarantees of future
performance, and actual results may differ materially from what is expressed in or indicated by these forward-
looking statements. Forward-looking statements are subject to risks and uncertainties that could cause actual
performance or results to differ materially from those expressed in such forward-looking statements, including those
risks and uncertainties described under the section titled “Risk Factors” in our most recent annual report on form 10-
K filed with the Securities and Exchange Commission (“SEC”), which risks and uncertainties may be updated from
time to time in our periodic filings with the SEC (accessible on the SEC’s website at www.sec.gov). Forward-looking
statements speak only as of the date the statements are made. The Company does not undertake to update any
forward-looking statements as a result of future developments or new information, except as required by law.

Non-GAAP Financial Measures
Included in this presentation are certain non-GAAP financial measures designed to supplement, and not substitute,
the financial information presented in accordance with generally accepted accounting principles in the United States
of America because management believes such measures are useful to investors. The reconciliation of those
measures to the most comparable GAAP measures is detailed in Gardner Denver’s press release for the third quarter
of 2018, which is available at http://investors.gardnerdenver.com, together with this presentation.

                                                                                                                          3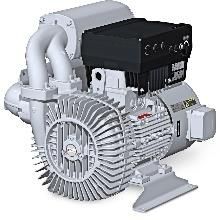
Agenda

▪ Highlights

▪ Q3 2018 Financial Performance

▪ Segment Highlights

▪ Full Year 2018 Guidance & Summary

▪ Q&A

                                      4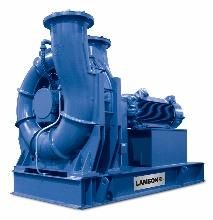
Q3 Highlights
        Solid performance across all three segments and continued
                  execution of our value-creation strategy
                • Revenue of $689M, up 6% versus prior year
Strong
                • Adjusted EBITDA of $182M, up 11% versus prior year
Execution
                • Adj EBITDA margin of 26.4%, an improvement of 100 basis points versus PY
                • Free cash flow generation of $93M, up $38M versus prior year, including 560
                   bps improvement in working capital as % of sales
Improving
                • Net debt to LTM Adjusted EBITDA ratio improved to 2.2x… 0.2x turn
Leverage           improvement since Q2’18
Profile
                • Balancing capital allocation priorities: $152M debt repayment ($262M YTD),
                   opportunistic share repurchases ($6M), & building acquisition funnel

Favorable       • Reaffirming 2018 Adjusted EBITDA guidance of $690M to $705M
Outlook         • Targeting year-end net debt to Adjusted EBITDA ratio of ~2.0x

       A premier industrial company with leading brands, mission-critical
                technologies, and diverse end market exposure
                                                                                                5
Our Strategy
Deploy Talent
Expand Margins
Accelerate Growth
Allocate Capital Effectively
6Q3 Financial Performance
Q3 2018 Financial Performance
                                                                                                                         (Dollars in millions, excl. EPS)

           Revenue                                                   Adjusted EBITDA                             Adjusted EPS1

              Up 6%                                                              Up 11%                              Up 20%
                                                                     Margin Up 100 bps
                                                                                                   $182
                               $689                                                                                               $0.49
   $650
                                                                       $165
                                                                                                                 $0.41

                                                                       25.4%                       26.4%
                                                                       Margin                      Margin

  Q3 2017                   Q3 2018                                 Q3 2017                    Q3 2018          Q3 2017          Q3 2018

           Financial Performance Reinforcing Our Value-Creation Strategy
    1   Adjusted EPS is defined as adjusted net income divided by adjusted diluted average shares outstanding
                                                                                                                                                       8
Q3 2018 Financial Performance
(Dollars in millions)
Working Capital Free Cash Flow1 Leverage
(Op. Working Capital as % of LTM Sales) (Net Debt / LTM Adjusted EBITDA)
Improved 560 bps Up $38M Improved 0.2x
Sequentially
$93 4.2x
30.8%
$54
2.4x
25.2% 2.2x
Q3 2017 Q3 2018 Q3 2017 Q3 2018 Q1'17 Q2'18 Q3'18
Pro-forma
IPO
Strengthening Position Through Strong FCF and De-leveraging
¹ Free Cash Flow is defined as cash flows from operations less capital expenditures 9Q3 2018 Segment Performance
Industrials Segment – Q3 Highlights
(Dollars in millions)
As Prior YOY Ex-FX YOY
Reported Year Change Change
Revenue $320 $288 11.0% 12.5%
Adjusted EBITDA $72 $63 14.3% 15.4%
Adjusted EBITDA Margin 22.5% 21.9% 60 bps
Innovation in Action
Highlights:
Orders up 7% as reported; up 8% ex-FX
Revenue up 13% ex-FX
Strong broad-based revenue growth with particular strength in
compressors and blowers
Adjusted EBITDA margin up 60 bps driven by improving pricing,
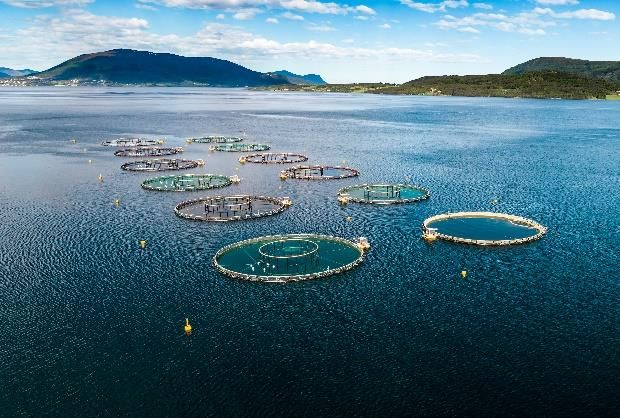
revenue mix (aftermarket), targeted cost actions, and early Compact Dry Running Blower
State-of-the-art blower technology designed
impacts of the i2V initiative specifically for the aquaculture market to
optimize capacity, minimize maintenance and
reduce noise and pulsation for such applications
as fish farming, aeration and wastewater
treatment.
11Energy Segment – Q3 Highlights
(Dollars in millions)
As Prior YOY Ex-FX YOY
Reported Year Change Change
Revenue $299 $302 (0.9)% 0.2%
Adjusted EBITDA $95 $99 (3.8)% (2.7)%
Adjusted EBITDA Margin 31.8% 32.7% (90) bps
Innovation in Action
Highlights:
Orders up 4% as reported; up 5% ex-FX
Upstream orders up 9%; revenue up 6% (ex-FX)
Consumables largest driver of growth (up 50%+)
In line with expectations, mid/downstream revenue down 10%
due to timing of large project shipments from prior year…
expecting Q4’18 to be up double digits Hoffman & Lamson Centrifugal Blowers
Highly engineered centrifugal blowers used for
Adjusted EBITDA margin decline driven by downstream project oxygen aeration in wastewater treatment
applications. Multi-unit system recently ordered for
timing… upstream and midstream margins relatively flat. large South America environmental remediation
project.
Segment margins up 260 bps sequentially as compared to Q2’18.
12Medical Segment – Q3 Highlights
(Dollars in millions)
As Prior YOY Ex-FX YOY
Reported Year Change Change
Revenue $71 $60 17.9% 18.9%
Adjusted EBITDA $21 $17 22.0% 23.2%
Adjusted EBITDA Margin 29.1% 28.1% 100 bps
Innovation in Action
Highlights:
Orders up 20% as reported; up 21% ex-FX
Revenue up 19% ex-FX
Second consecutive quarter of double digit organic revenue
growth driven by design wins and new product innovation
Strong backlog and continued execution of our growth
strategy / market expansion leading to positive organic Liquid Diaphragm Pump
Series of liquid diaphragm pumps designed for
growth medical, lab and life sciences applications such
as dental autoclaves for the proper dosing of
Adjusted EBITDA margin up 100 bps driven by volume growth water for cleaning and disinfection of dental
equipment.
and operational efficiencies
132018 Guidance & Summary
2018 Guidance

▪ Adjusted EBITDA                                                                                                       $690M to $705M

▪ Capital Expenditures (reduced)                                                                                        $50M to $60M
                                                                                                                        (from $60M to $70M)

▪ Tax Rate                                                                                                              26% to 28%

▪ Year End Net Debt Leverage                                                                                            ~2.0x

▪ Average Shares Outstanding1                                                                                           ~209M

     1Represents expectation of average shares outstanding for the balance of the year based on the full year computation of weighted average shares outstanding and share price as of
     9/30/2018; Excludes the impact of any potential future share repurchase activity
                                                                                                                                                                                         15
Summary
Strong Q3’18 performance with balanced execution across each of the segments
6% overall revenue growth with double-digit growth in Industrials and Medical segments
Positive orders momentum across all three segments, including upstream Energy growth of 9%
26.4% adjusted EBITDA margin with margin expansion of 100 bps versus prior year and 220 basis
points versus prior quarter
Free cash flow generation of $93M… leverage on track for ~2.0x by year end
Completed $152M debt repayment
Committed to ongoing commercial and operational execution to deliver 2018 commitments
Reaffirming full year 2018 Adjusted EBITDA guidance range
Expecting continued momentum on FCF generation and further reduction to leverage position1
Prudent operational efficiency and cost control actions in place
Continued execution of our value-creation strategy… Deploy Talent, Expand Margins, Accelerate
Growth and Allocate Capital Effectively
16Q&A
Appendix
Reconciliation of Net Income/(Loss) and Earnings/(Loss) per
Share to Adjusted Net Income and Adjusted Earnings per Share

                                                           19
Reconciliation of Net Income/(Loss) to Adjusted EBITDA and
Adjusted Net Income and CFOA to Free Cash Flow
20Reconciliation of Segment Adjusted EBITDA to
Income/(Loss) Before Income Taxes
21You can also read