HANSAMATRIX - August 18, 2021 Innovator and Manufacturing Solution High-Tech Group
←
→
Page content transcription
If your browser does not render page correctly, please read the page content below

HANSAMATRIX

Innovator and Manufacturing Solution High-Tech Group

     Q2 and 6m results of 2021 – Nasdaq webinar
Presenters: Jānis Sams, CEO and Maris Macijevskis, CFO
                 August 18, 2021
Executive summary

Business trends
•   Due to increased growth in remote data connectivity for business, work studies, etc., the
    demand in data networks products is strong.
•   Industrial sector is expected to experience growth as pandemic is contained
•   COVID-19 developments require active situation monitoring and rapid response approach
    to successfully manage the potential business environment and supply chain disruptions.
•   Global component shortage continues and expected to persist up to mid 2022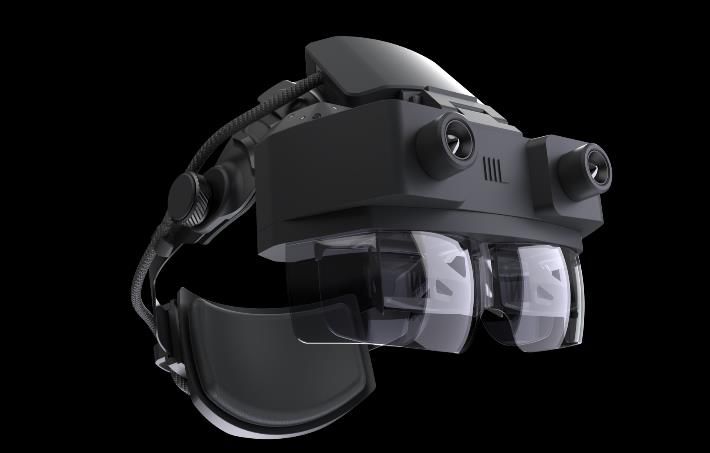
2021 Q2 summary
•   YOY sales growth 14%.
•   Very good Q2 EBITDA level – 1.151 million EUR, 19.0% EBITDA margin.
•   Q2 net profit decreased by 0.5 million by provisions for EIB warrant liabilities due to
    increased HansaMatrix share price.
•   Q2 normalized (adjusted by losses from associates, EIB loan and warrant provisions
    and lease interest) net profit is positive 0.488 MEUR.

                                  Results summary, MEUR       2020 Q2      2021 Q2     y-o-y    TTM 2021 Q2
                               Revenue                            5.290       6.042      +14%          23.985
                               EBITDA                             0.527       1.151     +118%           4.505
                               EBITDA margin                       9.9%       19.0%                     18.8%
                               Net profit                         -0.383      -0.327                   -0.015
                               Net profit margin                   -7.2%      -5.4%                     -0.1%
                               Normalized net profit              -0.115      0.488
                               P/E                                                                        n/a
Comparison with peers
• HansaMatrix EBITDA margin – the highest compared to industry peers
• Peer EV (Enterprise value) range 7.0x up to 13.3x EBITDA (HansaMatrix 7.4x)
TTM figures – EUR (EV) Enterprise TTM TTM TTM Net EBITDA Net profit
million value Revenue EBITDA Profit margin margin
HansaMatrix 33 24 4.5 0.0 18.8% -0.1%
Incap Oyj 292 131 22.2 14.3 17.0% 10.9%
Note AB 387 200 22.3 13.5 11.2% 7.3%
Kitron ASA 406 381 38.9 19.3 10.2% 5.1%
Inission AB 58 101 7.2 2.6 7.1% 2.6%
HANZA Holding 128 215 18.2 4.6 8.5% 2.1%
Source: Bloomberg, August 03, 2021Q2 results of 2021 in detail
2021 Q2 revenue
                                          Quarterly revenue, thousand EUR
                                  7,000

                                  6,000

      •   Quarterly revenue       5,000

          reached 6.04 MEUR
                                  4,000

      •   Increase by 14% in      3,000
          comparison to 2020 Q2
                                  2,000
      •   Increase by 4% in
                                  1,000
          comparison to 2021 Q1
                                      -
2021 Q2 revenue by region
Quarterly revenue by region, th EUR
4,000
• Baltic sales – 50%
3,500
✓ 62% up from 2020Q2
3,000
• Nordic sales – 26% 2,500
✓ 21% up from 2020Q2
2,000
• The rest of EU sales – 4% 1,500
✓ 76% down from 2020Q2 1,000
500
• Outside EU – 20%
✓ 1% up from 2020Q2 -
Baltic countries Nordic countries The rest of EU Outside EU
2018Q1 2018Q2 2018Q3 2018Q4 2019Q1 2019Q2 2019Q3
2019Q4 2020Q1 2020Q2 2020Q3 2020Q4 2021Q1 2021Q22021 Q2 revenue by market sector
• Data network products - 58% Quarterly revenue by sector, th EUR
✓ 59% up from 2020Q2 4,000
3,500
• Industrial products – 31% 3,000
✓ 27% down from 2020Q2
2,500
• Internet-of-things - 4% 2,000
✓ 1% down from 2020Q2 1,500
1,000
• Optics and photonics - 4%
✓ 22% up from 2020Q2 500
-
• Other – 4% Data networks Internet of Things Industrial Optics and
photonics
Other
✓ 155% up from 2020Q2 2018Q1
2019Q4
2018Q2
2020Q1
2018Q3
2020Q2
2018Q4
2020Q3
2019Q1
2020Q4
2019Q2
2021Q1
2019Q3
2021Q22021 Q2 profitability results
• 2021 Q2 EBITDA – 1.151 MEUR
Quarterly results, thousand EUR
✓ 118% up from 2020 Q2
1,400
1,200
• Net loss 0.327 MEUR vs net 1,000
loss 0.383 MEUR in 2020 Q2 800
• Net loss mostly explained by 600
0.5 million provisions for EIB 400
warrant liabilities due to 200
increased HansaMatrix share -
price
(200)
• Q2 EBITDA margin – 19.04% (400)
(600)
• Q2 normalized* net profit is Quarterly EBITDA Quarterly net profit
positive 0.488 MEUR.
*Normalized - adjusted by losses from associates, EIB loan and warrant provisions and lease interest)6m results of 2021 in detail
2021 6m revenue
                                           6 month revenue, thousand EUR
                                  14,000

                                  12,000

                                  10,000
      •   2021 H1 revenue of
                                   8,000
          11.870 million EUR
                                   6,000
      •   Increase by 13% in
                                   4,000
          comparison to 2020 H1
                                   2,000

                                       -
2021 6m revenue by region
6 month revenue by region, th EUR
7,000
• Baltic sales – 54%
✓ 46% up from 2020 6m 6,000
5,000
• Nordic sales – 23%
✓ 0% up from 2020 6m 4,000
3,000
• The rest of EU sales – 5%
✓ 64% down from 2020 6m 2,000
1,000
• Outside EU – 18%
✓ 27% up from 2020 6m -
Baltic countries Nordic countries The rest of EU Outside EU
2018H1 2018H2 2019H1 2019H2 2020H1 2020H2 2021H12021 6m revenue by market sector
• Data network products - 55% 6 month revenue by sector, th EUR
✓ 51% up from 2020 6m 7,000
6,000
• Industrial segment – 32%
✓ 19% down from 2020 6m 5,000
4,000
• Internet-of-things - 6%
3,000
✓ 18% up from 2020 6m
2,000
• Optics and photonics - 4% 1,000
✓ 29% down from 2020 6m
-
Data networks Internet of Things Industrial Optics and Other
• Other – 4% photonics
✓ 43% up from 2020 6m 2018H1 2018H2 2019H1 2019H2 2020H1 2020H2 2021H12021 6m profitability results
• 2021 6m EBITDA – 2.392 MEUR
6 month results, thousand EUR
✓ 147% up from 2020 6m 3,000
2,500
• Net loss 0.281 MEUR vs net 2,000
loss 0.818 MEUR in 2020 6m
1,500
• Net loss mostly explained by 1,000
0.7 million provisions for EIB
500
warrant liabilities due to
increased HansaMatrix share -
price
(500)
• 6m EBITDA margin – 20.15% (1,000)
• 6m normalized* net profit is 6 month EBITDA 6 month net profit
positive 1.044 MEUR.
*Normalized - adjusted by losses from associates, EIB loan and warrant provisions and lease interest)Trailing 12 months (TTM) results in detail
TTM sales and results
      •   TTM (trailing twelve months)              TTM revenue, EBITDA and margin, th EUR
          period ending 2021Q2 indicator   30,000                                                                  20.0%

          dynamics compared to TTM
                                           25,000
          period ending 2020Q2:                                                                                    15.0%

                                           20,000

      •   TTM revenue 23.98 M EUR –                                                                                10.0%

                                           15,000
          3% up
                                                                                                                   5.0%
                                           10,000

      •   TTM EBITDA 4.50 M EUR – 70%                                                                              0.0%
                                            5,000
          up
                                                -                                                                  -5.0%
      •   TTM net loss 0.015 M EUR

                                                     TTM 12 month EBITDA          TTM 12 month turnover
      •   TTM EBITDA margin reported                 TTM 12 month EBITDA margin   TTM 12 month net profit margin

          as 18.8%
Update on other activities
Investments during 2021 Q2 and 6m
Fixed assets:
• The Company carried out 196 thousand EUR investments in 2021 Q2 and 334 thousand EUR in 2021 6m.
• Due to COVID-19 situation the investments are mostly carried out to maintain the manufacturing
  equipment and other assets.
LightSpace Technologies:
• There were no investments made in Q2 and 6m into LightSpace Technologies from HansaMatrix.
• As of end of Q2 2021 investment in LightSpace Technologies amounted to 8.67 MEUR (4.96 MEUR
  convertible loan and 3.71 MEUR equity).
Zinātnes parks:
• 86 thousand EUR investments in Q2 and 177 thousand EUR in 6m in form of convertible loan in Zinātnes
  parks for industrial real estate project maintenance at Riga airport.
• As of end of Q2 2021 investment in Zinātnes parks in total amounted to 2.41 MEUR (2.05 MEUR capitalized
  fixed asset creation cost and 0.36 MEUR Zinātnes parks share acquisition goodwill).
Business development of LightSpace Technologies
 • During Q2 2021 LightSpace accomplished three product validation projects
   with 3 globally leading MedTech corporations with applications in surgical
                                                                                  Visualization of iG1050
   navigation and robotic surgeries. They highly valuated image quality of
   model iG1000. Therefore company decided to do product evolution of it with
   upgraded model iG1050 manufacturing and supply them early 2022.
 • In Q2 2021, the company restarted work with Europe leading car brands to
   identify business opportunities. As a result, LightSpace has been invited to
   organize demo roadshows, likely followed by validation projects.
 • Up 1.7 million EUR equity investment has been approved by EIC Fund Board
   in June 2021 as blended financing contribution to be used until Dec 2022.
Significant events in 2021 Q2
• New contract signed:
– 1.5M EUR to supply high complexity electronic device to transportation industrial customer in Nordic country.
• Changes in management:
– Jānis Sams, experienced in managerial roles in electronics industry, including Schneider Electric, becomes CEO
– Ilmārs Osmanis joins supervisory board of HansaMatrix and focuses on Lightspace Technologies development as its founder and
current CEO
– Baiba Anda Rubesa, experienced international company manager with extensive experience in corporate governance, becomes
chairwoman of HansaMatrix supervisory board
– Anders Lennart Borg, experienced professional in the electronics manufacturing industry, joins supervisory board as independent
board member.
• 3 cents per share or 54.88 thousand EUR dividends paid out on June 11, 2021
• Deloitte Audits Latvia selected as auditor for 2021 and 2022Significant events after the reporting period
• 2 new contracts signed:
– 3.3M EUR to supply human machine interface electronic devices to industrial customer in Germany
– 1.4M USD to supply high complexity electronic assemblies to industrial customer outside EUQ&A Session
We welcome your questions during webinar !
Please use investor contact for any other enquiries:
Māris Macijevskis, CFO
Phone: (+371) 6780 0002
e-mail: invest@hansamatrix.comQ and A submitted before webinar (1) 1) Does company have pricing power? Can you pass cost pressures to clients? Based on long-term relationship with customers and material availability difficulties, there are preliminary agreements to validate significant component price increases. In most cases the Company has managed to pass the cost pressure to clients, still remaining competitive with pricing. 2) What could be the biggest bottle necks for company for the next 24 months? Because of accumulated order backlog due to the component availability, it is expected to have peak in capacity demand after mid 2022. To avoid potential bottle neck anticipated capacity planning is carried out in cooperation with key accounts. 3) Do you expect more standby periods for 2021? No. The Company will focus on balancing the necessary resources versus confirmed customer demand (4-6 weeks).
Alternative performance measures
HansaMatrix Unaudited Interim Condensed Consolidated Financial Statements
for the 6 month period ended June 30, 2021 on page 39 include the definitions
of alternative performance indicators (APIs) used in the webinar presentation:

https://bit.ly/37MHqVC
Thank you!
You can also read