Irrigation WOF X Farm - Irrigation Performance Test - Water Strategies
←
→
Page content transcription
If your browser does not render page correctly, please read the page content below
Irrigation WOF
Irrigation Performance Test

X Farm

X 2020
2

Report Number:                WSXXX
Report Prepared By:           X
Date                          X/X/2020
Report Reviewed By:           X
Date                          X/X/2020

Disclaimer

   •   Water Strategies Limited (including its directors, employees and contractors) shall not be
       liable for damages of any kind whatsoever arising out of your reliance on the information
       in this report.
   •   Water Strategies Limited makes no representation or warranty, express or implied,
       regarding any information accessed from, or via, this report, including, but not limited to,
       all implied warranties of merchantability, fitness for a particular purpose, or non-
       infringement.
   •   The recommendation or findings in this report are subject to several risks, factors and
       uncertainties that may cause actual results, events and performance to differ materially
       from those referred to in any forward-looking statements.
   •   In no event will Water Strategies Limited be liable for any direct, indirect, special,
       incidental, consequential, or punitive damages or any damages whatsoever resulting from
       the use of, access to, or the inability to use this information, including, without limitation,
       any lost profits, business interruptions, loss of data etc whether in an action of contract,
       negligence or other tortuous action.
   •   The recommendation or findings in this report are subject to accuracy and completeness of
       the information and data provided to Water Strategies Limited
3 Table of Contents Assessment Summary .................................................................................................................................. 4 Good Farming Practice Assessment ......................................................................................................... 5 Irrigation Assessment Results..................................................................................................................... 6 Irrigation Assessment Methodology .......................................................................................................... 9 Background Information...........................................................................................................................10 Appendix A: Uniformity Explanation .....................................................................................................12 Appendix B: Methodology Detail ............................................................................................................13
4

Assessment Summary
An assessment of X Farm pivots 2, 4 and 6 was undertaken by X of Water Strategies in on X
2020.

The scope of the assessment was an Irrigation Performance Test:

•   A performance test of the irrigator pressures, flows, actual irrigation depth and the uniformity
    of application.

The testing methodologies used comply with ISO 11545, ANSI/ASAE S346.1 and the New
Zealand Performance Assessment code of practice 2014.

The wind speed during the performance tests was between 0 m/s and 1.5 m/s. This is within
permissible testing limits.

Findings:
Specific results can be found in the test results table on page 6
•   All pivots had adequate pressure for them to operate, however there was significant
    fluctuation in the water supply pressure to each.
•   The flow rates to the pivots were adequate for them to operate.
•   The application depth of pivot 2 and 6 was within 10 % of the control panel and for pivot 4
    it was within 20%.
•   The application depth for the pivot 6 corner arm was almost 40% less than the other spans.
•   None of the pivots met the minimum lower quartile distribution uniformity (DUlq) standard
    of >0.80. However, if the flood jet nozzle impacted data was removed from the calculations
    for pivot 4 the result improved to 0.85; and if the corner arm results were excluded for pivot
    6 the uniformity improved to 0.87.
•   Pivots 4 and 6 met the recommended upper quartile distribution uniformity (DUuq) standard
    of < 1.25, however pivot 2 did not. If the flood jet nozzle impacted data was removed from
    the calculations for pivot 4 the result improved to 1.15; and if the corner arm results were
    excluded for pivot 6 the uniformity improved to 1.12.
•   Pivot 4 met the international coefficient of uniformity (CU) standard of > 85%, however
    pivots 2 and 6 did not. If the flood jet nozzle impacted data was removed from the
    calculations for pivot 4 the result improved to 90.41; and if the corner arm results were
    excluded for pivot 6 the uniformity improved to 92.47.
5
• The instantaneous application rates (IAR) of all pivots were within the maximum infiltration
rate of the soils found on the property (stony silt loams are typically between 30 and 40
mm/hr).
Recommendations:
• For pivot 2 the sprinkler pack is likely not installed correctly and the endgun arc settings also
need to be checked, noting for optimum performance they should typically be 130o.
• For pivot 4 the flood jet nozzle after the last tower should be removed and replaced with a
pivot sprinkler. Due to the pivots position the endgun was not able to be tested, however it
would be advisable to also check the arc settings for it.
• For pivot 6 the corner arm sprinkler pack needs checking and if no issues are found it then
needs reprogramming so it is applying the same depth as the rest of the pivot. Due to the
pivots position the endgun was not able to be tested, however it would be advisable to also
check the arc settings for it.
• There were significant pressure variations observed with the water supply during the tests
which is being caused by the CPW water supply. Although the pressure variation is having
minimal impact upon system performance (it only impacts endgun performance as these are
not pressure regulated) you should ask CPW if anything can be done to stabilise your water
supply pressure.
Good Farming Practice Assessment
Expectation Comment
New and None of the pivots currently meet Good Farming Practice requirements.
upgraded For pivots 4 and 6 if the recommendations are implemented they will meet
irrigation Good Farming Practice requirements, however, pivot 2 will require a re-
systems test.
Annual N/A
assessment &
maintenance
Timing & depth N/A
of irrigation meet
plant demand
Management N/A
systems6
Irrigation Assessment Results
Full Irrigation Assessment (Performance Test & Scheduling Assessment) ☐
Irrigator Performance Test ☒ Irrigation Scheduling Assessment ☐
Performance Test:
Irrigator Performance Pivot 2 Pivot 4 Pivot 6
Application depth (mm) (control panel) 5.0 5.0 3.75
Application depth (mm) (measured) 5.2 4.1 3.7
Flow Rate (l/s) (design) 13.0 13.0 56.0
Flow Rate (l/s) (check flow meter) 5.7 6.3 52.0
Centre Pressure (kPa) (centre point design) 210 215 380
Centre Pressure (kPa) (centre point) 280-480 350-520 260-510
End Pressure (kPa) (above end regulator) 250-420 330-510 180-320
End Pressure (kPa) (below end regulator) 110 110 100
Pivot Speed (m/min) (at test depth) 0.53 0.64 2.4
Rotation time (hours) (at test depth) 21.5 23.15 19.2
System capacity (mm/day) (design) 13.0 8.6 5.0
System capacity (mm/day) (calculated) 5.7 4.2 5.0
*Weighted Distribution Uniformity (DUlq)1 0.76 0.79 0.74
Weighted Distribution Uniformity (DUuq)2 1.55 1.24 1.21
Weighted Co-efficient of Uniformity (CU) 3 71.97 85.69 83.74
Instantaneous Application Rate (IAR) (mm/hour) 13.8 12.7 38.1
*Calculations exclude the end gun test results.
1 See Appendix A for an explanation of lower quartile distribution uniformity
2 See Appendix A for an explanation of upper quartile distribution uniformity
3 See Appendix A for an explanation of coefficient of uniformity7 Uniformity and Depth Graphs
8
9

Irrigation Assessment Methodology
An assessment of X Farm pivots 2 and 4 was undertaken by X of Water Strategies on X 2020
and X on X 2020.

The wind speed during the performance tests was between 0 m/s (X date) and up to 1.5 m/s (X
date). These are within permissible testing limits.

The scope of the assessment was an Irrigation Performance Test.
•   A performance test of the irrigator pressures, flows, actual irrigation depth, the uniformity of
    application and topography in relation to individual tower location.

The irrigation system assessment methodology used complies with:
    •   ISO 11545;
    •   ANSI/ASAE S346.1; and
    •   IrrigationNZ Code of Practice for Performance Assessment (2014).

Appendix B contains a detailed description of the irrigation system performance testing
procedures.
10
Background Information
Irrigators
System Description Design Specifications (where available)
Pivot 2 • Part-circle – 200 o
• Flow Rate – 13.0 l/s
• 196 m length • Centre Pressure – 210 kPa
• 8.6 ha • System Capacity – 13 mm/day
• 1 year
Pivot 4 • Part circle – 220o • Flow Rate – 13.0 l/s
• 240 m length • Centre Pressure – 215 kPa
• 12.9 ha • System Capacity – 8.6 mm/day
• 1 year
Pivot 6 • Full circle • Flow Rate – 56.0 l/s
• 526 m length • Centre Pressure – 380 kPa
• 97.0 ha • System Capacity – 5.0 mm/day
• 1 year11
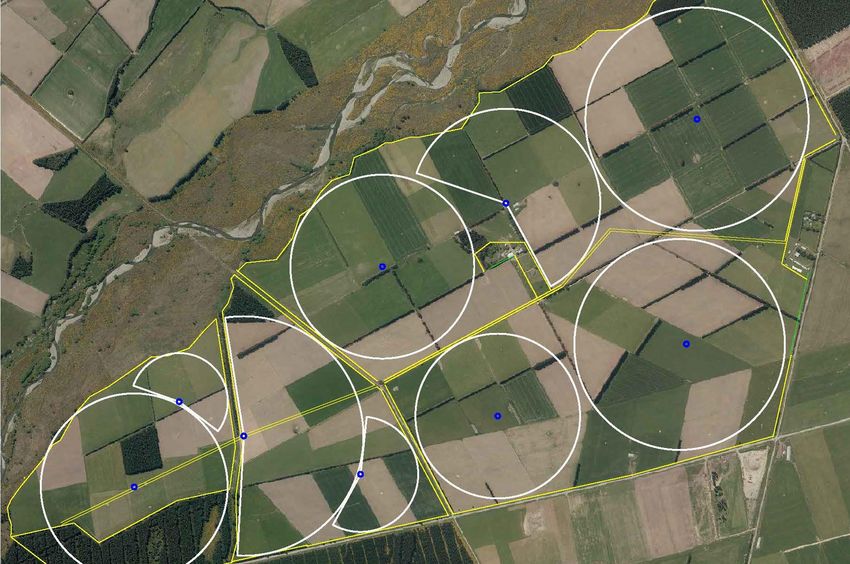
Farm Irrigation Layout
Pivot 2 test position
Pivot 6 test position
Pivot 4 test position12 Appendix A: Uniformity Explanation Distribution Uniformity Distribution uniformity (DU) is a measure of how evenly water is applied to the area being watered. It is expressed as a ratio. The DU should not be confused with the coefficient of uniformity (CU) which is explained below. The most common measure of DU for is the low quarter DU expressed as DUlq. This is a measure of the average of the lowest quarter of samples, divided by the average of all samples. The higher the DUlq, the better the uniformity of application, i.e. if all samples are equal, the DUlq is 1.0. For pivots Water Strategies uses the weighted version of the above formula. This recognises that a greater area is irrigated as you move from the centre outwards. The table below provides a performance rating in relation to the DUlq value. A value of >0.80 is regarded as the minimum standard in NZ. > 0.90 Excellent 0.80 – 0.89 Good 0.70 – 0.79 Fair 0.60 – 0.69 Poor > 0.59 Extremely Poor Source: NZ Performance Assessment Code of Practice 2014 The other DU measure, which can be used for irrigation but is more commonly used for land based effluent applications, is the upper quartile DU expressed as DUuq. It provides a measure of the overwatering risk. Its calculation differs from the lower quartile as the upper quartile of samples is instead divided by the average of all samples. The DUuq standard for land based effluent application is 85%. For pivots the weighted version (Heermann-Hein) of the above formula is used. This recognises that a greater area is irrigated as you move from the centre outwards.
13

Appendix B: Methodology Detail
Testing Methodology – Center Pivot
The following methodology was used in addition to the methodology set out in the New Zealand
Performance Assessment Code of Practice (2014):
1) Pressure test points were installed at the start and end, and for each test point pressures were
   taken above and below the regulator.
2) For the standard pivot systems one line of collectors was used and the collectors were placed
   5 metres apart.
3) For the variable rate systems two lines of collectors were used with the collectors placed at 10
   metre spacings in each line and offset by 5 metres between each line.
4) Each collectors position was measured to provides an accurate reading of distance from the
   centre point. This ensures the weighting of the volumes collected was accurate and any issues
   arising from the test results can be related to a specific location point on the machine.
5) A Siemens FUP1010 flow meter was installed at the centre point to provide flow
   measurement readings during the test.
6) The pivot was run at a 5 mm application rate.
7) The following data was recorded:
       o Centre pressure
       o Pressure readings above and below the end regulator
       o Flow rate
       o Machine speed at the last span tower
       o Span lengths, overhang length and where applicable endgun radius and corner arm
           length
       o Wetted width at the end and at two-thirds the distance along the machine
       o Wind speed and temperature
       o Any general comments
You can also read