Economics Weekly Australian economic developments - Australian Industry Group
←
→
Page content transcription
If your browser does not render page correctly, please read the page content below
13 August 2021

Economics Weekly
Australian economic developments
This week COVID-19 activity restrictions were eased in some locations but introduced or extended in many others.
More than half of Australia’s population are in some form of lockdown, including all of Melbourne, Sydney, Canberra
and several large regional towns in NSW. Interstate border movements remain heavily restricted nationwide. Advice
about current business restrictions and Government support payments is available online from Ai Group here.

Australian economic data
The NAB monthly survey of business conditions (monthly) fell by a further 14 points but remained positive at +11
index points in July, after reaching a record high in May (results above zero indicate net positive conditions in this
index). This is in line with recent results from Ai Group’s monthly industry activity indexes (the Australian PMI, PSI
and PCI, all available online here). The NAB indexes for business trading, profitability and employment fell steeply
but remained in positive territory (above zero in these series), reflecting the strength in business conditions in the
leadup to the recent COVID-19 outbreaks. Across industries, conditions declined in all non-mining industries, with the
largest declines in utilities and recreation & personal services.

The NAB survey of business confidence (monthly) fell by 19 points to -8 index points, indicating negative business
confidence (results below zero indicate net negative confidence in this index). Confidence fell across the country
and is now below average in every state except WA – possibly due to elevated commodity prices and mining
conditions. Unsurprisingly, business confidence fell most in NSW in July and was the lowest in Queensland and NSW.

The Westpac-MI consumer confidence index (monthly) fell by 4.4% m/m to 104.1 points in early August, indicating
a mildly ‘net positive’ mood among consumers (results above 100 points indicate net positive confidence in this
index). Westpac economists said, “this is a significant further loss of confidence but better than might have been
expected given virus developments… the availability of effective COVID vaccines is a key source of support confidence.”

The ANZ-Roy Morgan consumer confidence index (weekly) fell by 3.1% w/w to 98.6 points on the 7th-8th of August,
indicating a mildly pessimistic mood among consumers (results below 100 points indicate net negative confidence
in this index). Consumer confidence in this index fell below the neutral level of 100 and into ‘net pessimism’ for the
first time since early November 2020. Confidence fell sharply in Brisbane and Melbourne as new lockdowns were
imposed or extended. Confidence recovered somewhat in Sydney as vaccinations increased and restrictions on
construction work in some suburbs were eased. ANZ economists noted that “we can’t be sure the low in confidence
in the current cycle has been reached until COVID case numbers start to trend lower.”

The National Skills Commission Recruitment Experiences and Outlook Survey suggests the labour market is
deteriorating as a direct result of the recent outbreak of COVID-19 across Australia. In July, 45% of employers said
were recruiting or had recruited in the past month, down from 49% in June. The recruitment rate decreased
significantly in Capital Cities (from 49% to 43%), while the recruitment rate in regional Australia remained at the same
level (48%) compared to one month earlier.

                                                                                                 www.aigroup.com.au   1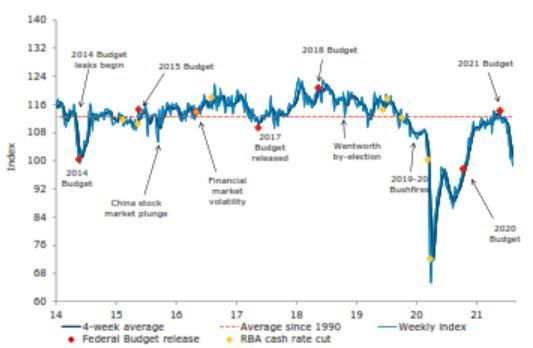
Ai Group Economics Weekly • 13 August 2021
Looking ahead, preliminary results from the National Skills Commission’s Internet Vacancy Index (IVI), indicate the
total number of online job ads fell a further 3.0% in July to 232,600 job ads. The largest decline was in NSW, where
recruitment activity fell by 10.3% m/m in July.
SEEK’s count of new job ads posted online saw a similar fall of 4.1% m/m in July. All states and territories except
for Victoria experienced a decline in job ads in July, with the largest fall in NSW at -14.2% m/m. In contrast, Victoria
saw an increase in new jobs of +4.5% m/m, possibly reflecting some catch-up after previous lockdowns. Even after
these falls in job ads, the total number of new online job ads in was 67.6% higher in July 2021 than it had been in July
2020, and 20.6% higher than in July 2019.
SEEK reports that online applications per job ad increased by 2.6% m/m in July, but current applications per job ad
are 33% lower than in 2019. Applications per job ad continue to track at low levels compared to historical trends.
SEEK’s Managing Director, Kendra Banks, noted that “Job security remains the number one priority for workers, and
there is a reluctance to switch roles in the market.”
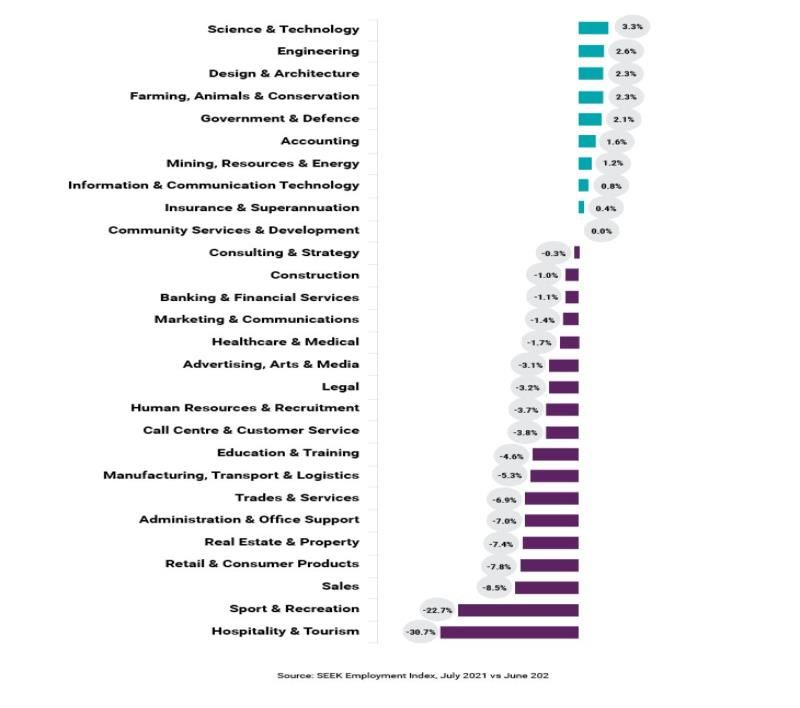
Across industries, the same industries continue to be hardest hit from lockdowns. Job ads declined in Hospitality &
Tourism, Trades & Services and Retail & Consumer Services in July because they are largely made up of customer
facing roles. The industries showing the greatest drop in new job ad volumes nationally and in NSW in July were:
• Hospitality & Tourism which declined 30.7% m/m nationally and 63.3 %m/m in New South Wales,
• Trades & Services reduced by 6.9% m/m nationally and 24.8%m/m in New South Wales and,
• Retail & Consumer Services fell by 7.8% m/m nationally and 29.6%m/m in New South Wales.
These job vacancy indicators suggest jobs growth is likely to slow in the coming months, but recent experience
suggests local employment could rebound again once the latest COVID-19 lockdown restrictions are lifted.
www.aigroup.com.au 2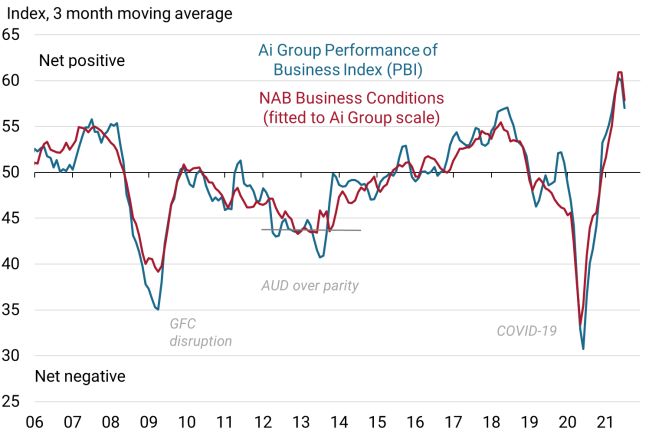
Ai Group Economics Weekly • 13 August 2021

Chart 1: The NAB monthly survey of business conditions          Chart 2: The Westpac-MI consumer confidence index
fell by a further 14 points but remained net positive at +11    (monthly) fell by 4.4% m/m to 104.1 points in August
index points in July, after reaching a record high in May.      (results above 100 points indicate net positive confidence
This is in line with recent results from Ai Group’s monthly     in this index).
industry indexes (the Aust PMI, PSI and PCI).

       Ai Group Performance of Business Index* and
       NAB Business Conditions Index, to July 2021                   Westpac Consumer Sentiment Index, to Aug 2021

* weighted composite of Ai Group Australian PMI, PSI and PCI.   Source: Westpac-MI
Source: ABS and RBA.

Chart 3: The ANZ-Roy Morgan consumer confidence index           Chart 4: In July, the recruitment rate decreased
(weekly) fell by 3.1% w/w to 98.6 points on the 7th-8th of      significantly in Capital Cities (from 49% to 43%) but
August (results below 100 points indicate net negative          remained at the same level in regional Australia (48%)
confidence in this index).                                      compared with June.

       ANZ-Roy Morgan Consumer Confidence Index                 Recruitment (proportion of employers who are recruiting)

Source: ANZ-Roy Morgan                                          Source: NSC

                                                                                                  www.aigroup.com.au   3
Ai Group Economics Weekly • 13 August 2021

Chart 5: Preliminary results from the National Skills         Chart 6: All states and territories experienced a monthly
Commission’s Internet Vacancy Index (IVI), indicate online    decline in new job ads posted on SEEK, except for Victoria
job ads fell a further 3.0% in July to 232,600 job ads.       which saw a 4.5% m/m increase. The largest fall was in
                                                              NSW with a 14.2% m/m decline in job ads.

                  Internet Vacancy Index                             State job ad volumes – Jan 2020 to Jul 2021

Source: NSC                                                   Source: SEEK

Chart 7: Across industries, the same industries continue to   Chart 8: The World Container Index increased to a new
be hardest hit from lockdowns. Job ads declined in            record high of $9,421.48 per 40ft container in the week to
Hospitality & Tourism, Trades & Services and Retail &         12 August 2021. Up by 358% from the same week in 2020
Consumer Services in July because they are largely made       and up from USD $1,500 in March 2020 (pre-pandmeic).
up of customer facing roles.

National SEEK Job Ad percentage change by industry
             (July 2021 vs June 2021)                         World container index, freight rate ($USD 40ft containers)

Source: SEEK                                                  Source: Drewry World Container Index. This is a weighted freight rate
                                                              assessment of eight major east-west trade routes.

                                                                                                        www.aigroup.com.au       4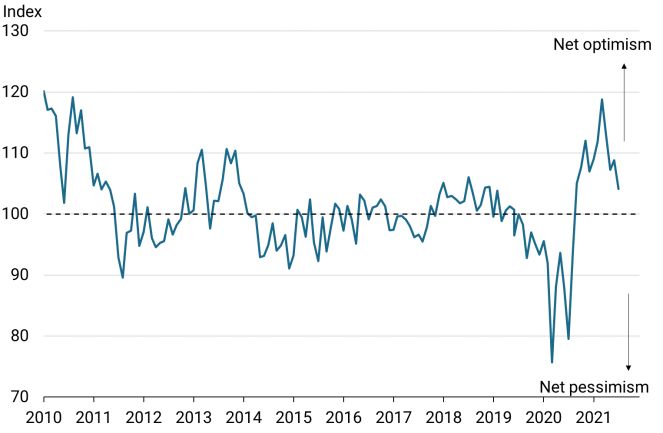
Ai Group Economics Weekly • 13 August 2021

Australian Industry Group monthly performance of industry indices

 Australian Performance of Manufacturing Index®                          Jul 2021 (M)                  60.8 ▼

 Australian Performance of Construction Index®                           Jul 2021 (M)                  48.7 ▼

 Australian Performance of Services Index®                               Jul 2021 (M)                  51.7 ▼

Arrows represent direction of movement relative to last observation. Source: Ai Group.

Australian economy: latest annual growth rates and RBA forecasts (as of Aug 2021)

                                                    Dec            Jun         Dec           Jun         Dec            Jun         Dec
% change over the year
                                                    2020          2021         2021         2022         2022          2023         2023
Gross domestic product (GDP)                         -1.1          9.5          4.0          4.5          4.5          2.75          2.5

Household consumption                                -2.7         15.0         2.75          5.25          6.0         3.25         3.25

Dwelling investment                                   0.6         19.0         14.25         1.25         -0.5         0.25         1.75

Business investment                                  --5.1        4.75          8.5          8.0           9.0          6.5         5.25

Public demand                                         6.3         4.75          4.5          5.5           3.5         1.25          0.5

Gross national expenditure                           -0.3         13.0         4.75          4.75         5.25         2.75          2.5

Imports                                              -9.6        17.25          8.5          7.25          9.0          8.5          6.5

Exports                                             -11.7         0.25          5.0          6.25         4.25          7.5          6.0

Terms of trade                                        7.3         21.5         9.75         -11.5        -12.5         -7.25        -3.75

Real household disposable income                      4.4          1.0         1.25          1.5          1.75          1.5          1.5

Unemployment rate (qtr average, %)                    6.8          5.2          5.0          4.5          4.25         4.25          4.0

Employment                                           -0.9          6.4          2.5          1.5          1.75         1.25         1.25

Average wage rates (WPI)                              1.4         1.75         2.25         2.25          2.5           2.5         2.75

Trimmed mean inflation (CPI)                          1.2          1.6         1.75          1.5          1.75          2.0         2.25

Headline inflation (CPI)                              0.9          3.8          2.5          1.5          1.75          2.0         2.25
     = actual.    = forecast. Sources: ABS, various data; RBA ‘baseline scenario’ in Statement on Monetary Policy, May 2021.

RBA forecasts include the following technical assumptions: The cash rate is assumed to remain at its current level (0.1%) with other elements
of the Bank’s monetary stimulus package, including the 0.1% target for the 3‐year government bond yield, assumed to remain consistent with
current settings. Other technical assumptions include the TWI at 60 points, A$ at US$0.70 and Brent crude oil price at US$42 per barrel.

Ai Group Economics Research Team

 Julie Toth                    Andrew Bridger                Colleen Dowling                         Agnes Fok
 Chief Economist               Senior Economist              Senior Research Analyst                 Research Coordinator

economics@aigroup.com.au

                                                                                                                     www.aigroup.com.au         5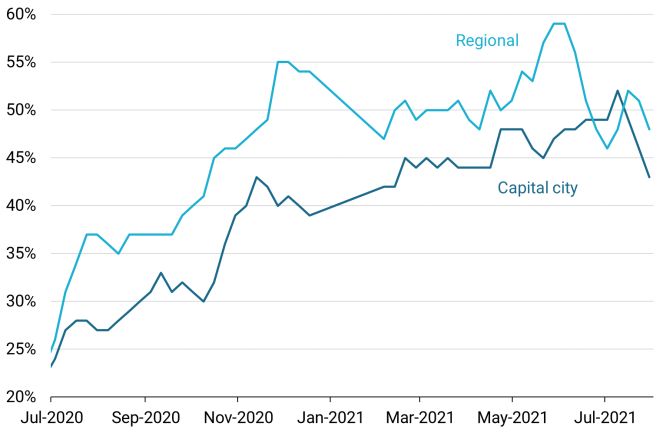
You can also read