OYSTER INDUSTRY BENCHMARKING SNAPSHOT INDUSTRY EDITION
←
→
Page content transcription
If your browser does not render page correctly, please read the page content below
Oyster Industry Benchmarking SnapShot

Industry Edition

                            November 2012

                            Carlyn Sherriff
                            Rural Directions Pty Ltd
                            PO Box 646 Clare
                            South Australia 5453
                            T 08 8841 4500
                            F 08 8842 1766
                            E csherriff@ruraldirections.com
                            www.ruraldirections.com
                            AFS Licence No 221556

                            Project delivered by: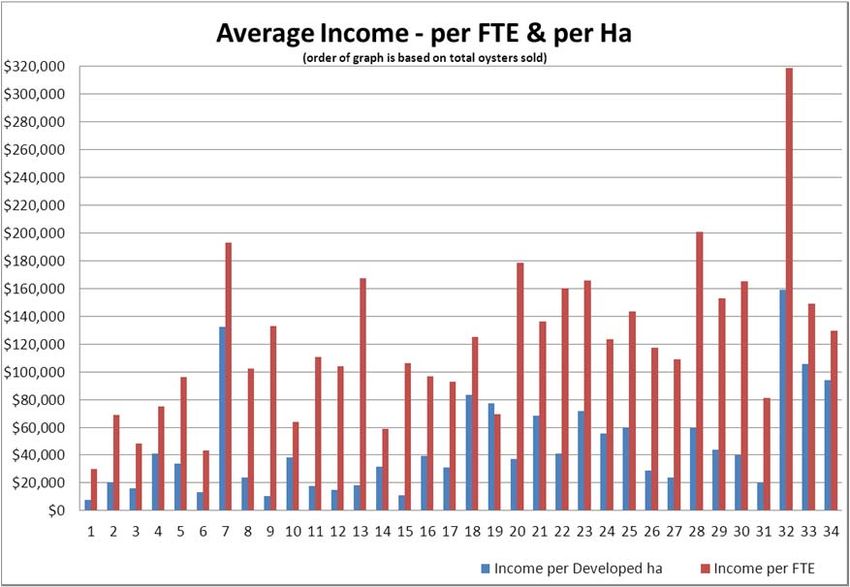
1

Australian Oyster Industry SnapShot 10/11 – Industry Edition

Disclaimer

This report has been produced by Rural Directions Pty Ltd (herein referred to as “the Company”)
and associated consultants/specialists. Whilst all due care has been taken in collecting, collating
and interpreting information for this report, some omissions may have occurred. The statements
and opinions contained in this report are given in good faith and in the belief that they are not false
or misleading.

Neither the consultants nor the Company undertakes responsibility in any way whatsoever to any
person (other than the Client) in respect to the document, including any errors or omissions therein,
arising through negligence or otherwise however caused.

This report is copyright. No part of it in any way may be by any means reproduced or stored in a
retrieval system, or transmitted without prior permission of the Company.

Purpose
This report has been produced for members of the oyster industry including growers and industry
organisations.

The purpose of this report is to summarise the performance of Oyster businesses in South
Australia, Tasmania and New South Wales that have participated in the Oyster Benchmarking
program. This report is a shortened version of the report that participating growers have received.

The year of data analysis in this report is 2010/2011, collected on a financial year basis.

Every attempt has been made to ensure the identity of businesses within this report is kept
confidential and all data is presented anonymously.

Would you like to see your businesses performance in the next report?

The oyster benchmarking program is open to ALL oyster growers.

We will be undertaking another round of benchmarking in January 2013. Please call Carlyn
Sherriff at Rural Directions Pty Ltd on 08 8841 4500 to discuss your involvement in the program.
2

Overview
Businesses in data set:                 34
Production year:                        1 July 2010 to 30 June 2011

Type of grower

Table 1: Type of growers within the data
                                                                                            Number of growers
 Finished Oysters only
 These businesses produce oysters at a mature size and sell to customers and consumers.            25
 Nursery and finished
 These businesses produce oysters at a mature size and also operate a nursery enterprise
 selling juvenile oysters.                                                                         1
 On-grower only
 These businesses grow oysters to a smaller than finished size, selling them to another
 grower to fatten and finish for the customer.                                                     3
 On-grower and Finished
 These businesses are a combination of on-grower and finishers, selling both mature stock
 as well as oysters to be finished by other operators.                                              5
 Total growers                                                                                     34

Developed hectares per business

‘Developed hectares’ indicates the total area that is leased by the business (owned or sub-leased)
that has been developed.

Table 2: Average developed hectares of each farm by state
                Average       17ha
 Summary
                Range         1.5 – 79ha
 State            Average developed hectares (by state)
 SA                             13.69ha
 Tas                            24.47ha
 NSW                            12.47ha

Oysters sold per business

Table 3: Average dozen oysters sold by state in 10/11
                Average 142,557 doz
 Summary
                Range   10,179 – 724,054
 State            Average sold (by state)
 SA                      119,006
 Tas                     197,062
 NSW                     108,791

Table 4: Average total Full Time Equivalents (FTE) in each business
                Average   5.86 FTE
 Summary
                Range     1.03 – 32.31 FTE
 State            Average FTE (by state)
 SA                       5.73
 Tas                      7.90
 NSW                      3.76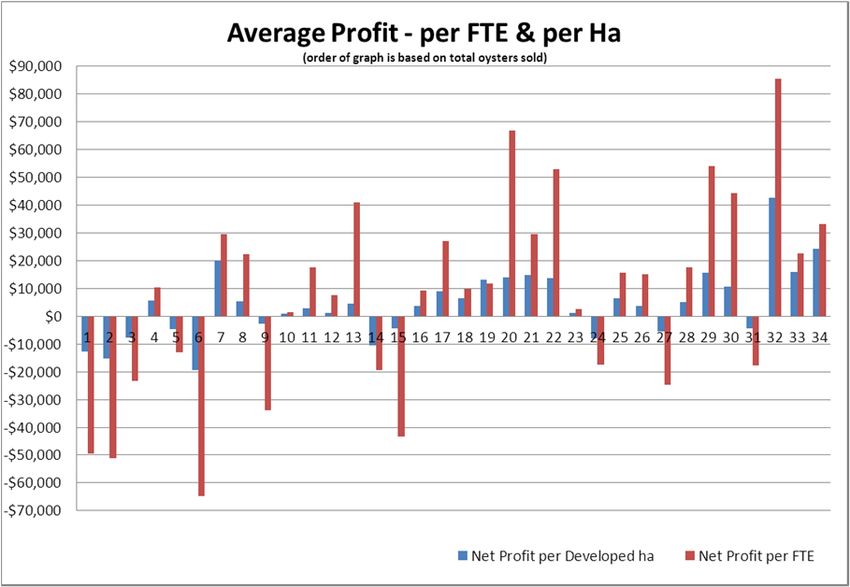
3

The summarised information above demonstrates that, on average, Tasmanian businesses operate
the largest lease area (Table 2), have the most labour units (Table 4) and produce the most oysters
per business (Table 3).

Performance analysis
The following sections outline the comparative performance of the businesses within this data set.
Business performance, cost comparison and whole of business position is presented.

SnapShot Premium analyses whole of business performance. Within this report there are
businesses operating: different business models; small to very large businesses and multi-state
businesses. These business models can still be compared against one another at a whole of
business performance level.

Business performance comparison

This section provides a summary of the results relating to dozens of oysters sold, income and profit
per business based on the states each business is located. A range of graphs are provided which
outline the results achieved by individual businesses. Individual businesses appear in the same
order in each of these graphs; the order is based on total oysters grown (e.g. number 34 produced
the highest number of oysters in the year analysed). This structure allows for data to be presented
in a manner which respects confidentiality of participating businesses.

Dozens sold

Table 5: Average dozens sold in 10/11 based on FTE’s and developed hectares
Average                              All States         SA               Tas              NSW
Dozens sold per FTE                   28,095          26,625            31,113           27,313
Dozens sold per developed Ha          11,989          10,663            10,322           14,776

The variance within these results, (Figure 1), is related to the type of grower and scale of business.
The diversity expressed on the right hand side of the graph (Figure 1) is highlighting larger
businesses, nursery businesses and/or on-growers.

Figure 1: Average dozen sold per business
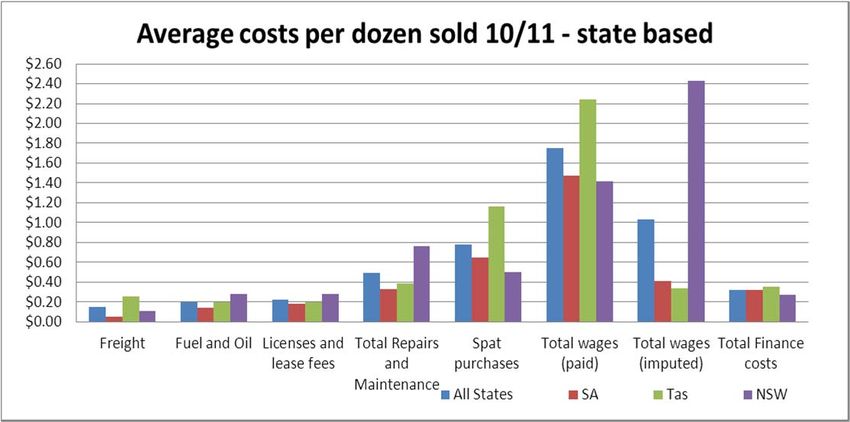
4

Business income

In 2010/2011 South Australian growers achieved the greatest income per developed hectare, while
Tasmanian growers had the highest income per dozen earned and the most income per FTE.

Table 6: Average income per business
Average                                 All States       SA               Tas            NSW
Total income per FTE                    $121,029      $125,703         $148,559         $88,055
Total income per developed Ha            $46,212       $57,599          $44,476         $32,213
Total income per dozen sold               $5.92         $5.23            $6.43           $6.03

Figure 2 shows the range of income received by businesses in 2010/2011. Some businesses were
affected by weather events and some by high mortality events. This meant less stock was available
for sale during this year. It was common for businesses in this data set to describe 10/11 as a year
that they want to put behind them.

Figure 2: Average income per business

Cost comparison

This section provides a summary of the results relating to average costs as a percentage of income
and the costs associated on a per dozen basis. The section focuses on the key costs for an oyster
business including: freight, fuel, lease fees and wages. The key costs presented in this report are
those that oyster business operators indicated were of importance to their business.

Costs as a percentage of Income

Wages and spat purchases consume the largest percentage of income for all states, they also cost
the most on a $/dozen basis. Repairs and maintenance and finance costs were also high. This
confirms the feedback from oyster growers, as shown in Table 7.

Licenses and lease fees were 4% of income (Table 7). This is not as high as some businesses may
have expected. This figure does not take into account businesses that pay a sub-lease for leases
that they do not own. There were less than 10 businesses with all or part of their leases set-up this
5

way. If these extra lease payments are added to the calculations above (licenses and lease fees),
the revised average is 5%. This is still not as significant as spat purchases and wages.

Table 7: Average costs per business based on percentage of income results
Average – percentage of income (%)         All States         SA           Tas            NSW
Freight                                        2%             1%            3%             2%
Fuel and Oil                                   4%             3%            3%             5%
Licenses and lease fees                        4%            4%             3%             5%
(Inc. industry levies, QAP / food safety)
Total Repairs and Maintenance                  8%            7%             6%             13%
Spat and on-grower purchases*                 14%            13%           18%             11%
Total Wages (paid)                            29%            29%           34%             22%
Total wages (imputed)                         19%             8%            5%             44%
Total Finance costs                            6%             7%            6%              4%
*Spat purchases includes purchase of spat and juvenile oysters less than
6

One of the biggest impacts on the profit figures for NSW was imputed labour, which is based on the
hours worked in the business by owners remunerated via drawings. This does not mean the NSW
growers work harder than the other states, it indicates that in 10/11 the income received by the
NSW businesses was not enough to cover all essential businesses costs; including setting aside
money for owners wages.

Figure 4 indicates that the most profitable business on a per hectare and FTE basis are not
necessarily the businesses who are selling the most oysters. Three of the four businesses
achieving profit per FTE of greater than $50,000 were finished producers and the other was an on-
grower. They produced between 100,000 and 500,000 dozen oysters per business and profit per
dozen varied from $0.72 to $2.92. This highlights the difference between business models for each
of these profitable businesses.

Figure 4: Average profit per business

Whole of business position – key performance indicators

The section relates to whole of business performance of the businesses analysed. In this section,
profit performance analysed in association with the balance sheet.

Some indicators have been coloured based on the benchmark key (Table 9). This table outlines
standards relating to a strong (green), okay (orange) or poor (red) benchmark result.
Table 9: Key to benchmark results

Benchmark Key                               Weakness               OK               Strength
Equity %                                  Less than 70%          70 - 80%      Greater than 80%

Debt to Income Ratio                      Greater than 1.5       1.5 - 1.2        Less than 1.2
Total Financing Costs (as % income)      Greater than 15%       15% - 7%         Less than 7%
Operating Costs (as % of income)         Greater than 60%       60% - 50%        Less than 50%

Key performance indicators
7

Operating costs as a percentage of income is high (Table 10). Ideally, a business should not
commit more than 60% of their income to paying operating costs (variable and overhead). The
10/11 data shows that the industry was spending an average of 73% on operating costs.

Table 10: Average operating costs as a percentage of income
Average                                               All States         SA           Tas      NSW
Operating costs as percentage of income                  73%            72%           74%      72%
Finance costs as percentage of income                     6%             7%            6%       4%

The average results for the benchmarks in Table 11 are all within the strength range. This indicates
that on average, the industry is not stressed or overcommitted with debt relative to their income and
businesses are building strong net worth positions.

Table 11: Net worth, debt to income ratio and equity results
Average                                   All States               SA            Tas           NSW
Net worth                                 $1,935,480           $2,262,056     $1,812,545    $1,018,636
Debt to income ratio                         0.77                 0.74           0.91          0.74
Equity                                       81%                  85%            73%           84%

Ideally, return on equity greater than 5% is good but greater than 10% is the target. This result was
not achieved by the oyster businesses in 10/11 (Table 12).

Table 12: Return on equity results by state and grower type
Average                                  All States             SA              Tas           NSW
Return on Equity (%)                         1%                 2%              4%            -5%
8

Summary
The purpose of this report was to summarise the performance of oyster businesses in South
Australia, Tasmania and New South Wales that have participated in the Oyster Benchmarking
program. Data was analysed for the financial year of 2010/2011. This was the first round of oyster
benchmarking analysed within the SnapShot Premium system.

Business size, oyster species grown and business model varied among the 34 participating
businesses analysed across New South Wales, South Australia and Tasmania. Profitability levels
across the businesses analysed also varied.

It was common for businesses in this data set to describe 10/11 as a year that they want to put
behind them. Some businesses were affected by weather events and some by high mortality
events. This meant less stock was available for sale during this year.

In 10/11 South Australian growers achieved the greatest income per developed hectare, Tasmanian
growers had the highest income per dozen earned and generated the most income per FTE.
Average profit per business in 10/11 was $89,746, with Tasmania achieving the highest average
profit of $71,060. NSW businesses achieved the lowest average profit in 10/11.

The report also provided analysis on some key benchmarks and found that on average the
businesses were performing okay in regards to finance costs as a percentage of income and debt
to income ratio. Operating costs as percentage of income was high but future benchmarking
analysis will determine if this benchmark needs to be adjusted or if there is an underlying issue for
the industry.

The businesses within this report have highlighted the diversity that exists within the oyster industry
and also showed similarities with the other industries in managing large costs such as wages.

Future rounds of benchmarking will provide a valuable trend for the individual businesses and
industry.

Please contact Rural Directions Pty Ltd if you wish to discuss these results
further or if you would like to be involved in the next round of benchmarking
- phone 08 8841 4500.
You can also read