Weekly climate hazards outlook - Recent conditions and outlooks Operational Climate Services 23 September 2021
←
→
Page content transcription
If your browser does not render page correctly, please read the page content below

Weekly climate hazards outlook
Recent conditions and outlooks

Operational Climate Services
23 September 2021

National severe weather outlook: September 2021–April 2022 summary
          Impact                                Likelihood compared to recent decades

                   Widespread flooding                    More likely

                   Coastal flooding / erosion             More likely

                   Severe storms                          Similar

                   Bushfire risk                          Similar, increased for parts of Qld/NSW

                   Heatwave                               Similar spring, increased summer

                   Tropical cyclones                      More likely

                   Marine heatwave                        More likely

                   Drought                                Less likely

                   Dust                                   Less likely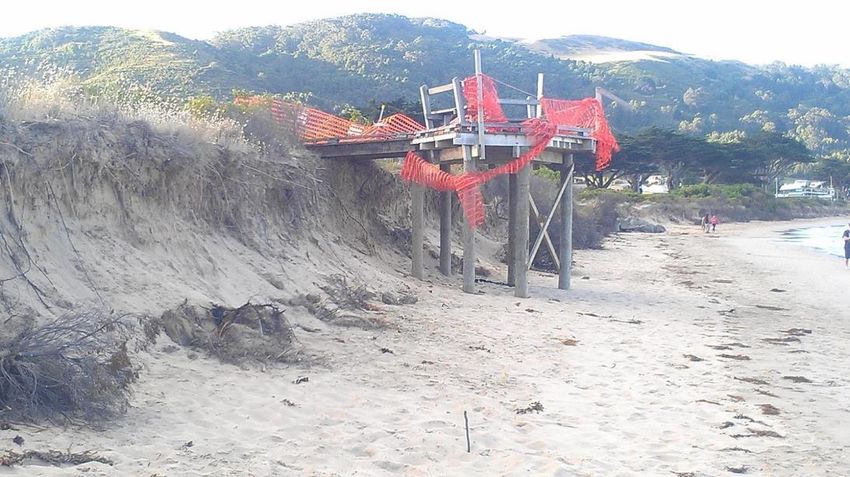
Severe weather summary
• Flood risk
• Bushfire risk

                         4
Flooding influences in coming weeks

     Very much above
     average

     Above average

     Average

     Below average

     Very much below
     average

                       1 – 22 September 2021                              Four weeks: 20 Sep – 17 Oct 2021
                       Top metre soil moisture                                   Rainfall anomalies
                                                                                     Model run date 20/09/2021

•   Soil moisture is above-average in eastern Victoria, parts of NSW and southern Qld, parts of southern WA,
    western Tasmania and across northern Australia
•   More rain on wet soils means increased risk of high runoff and flooding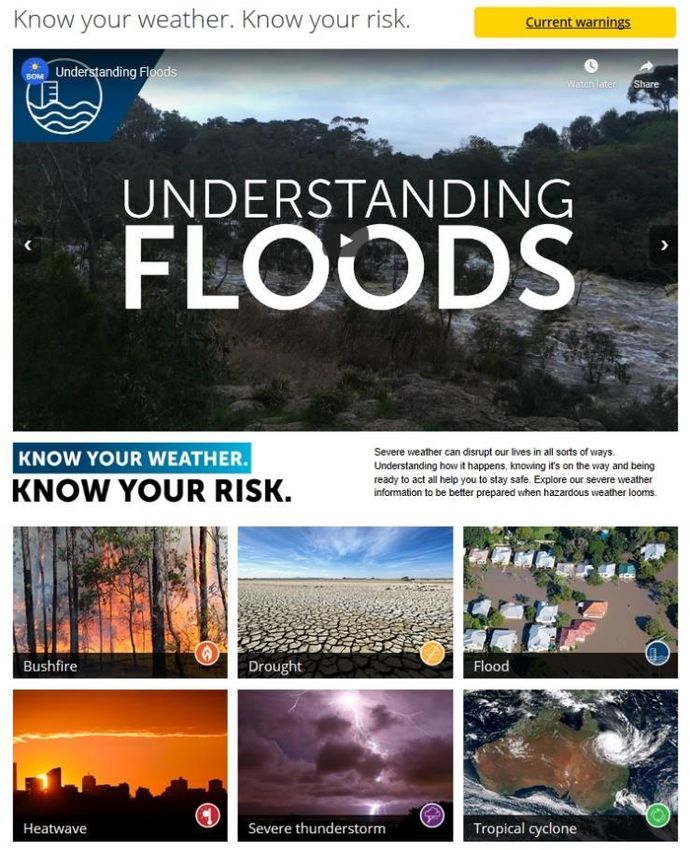
Forest Fire Danger Index (FFDI) summary
      Months 1 & 2 and Seasons 1 & 2

• September: Above-median FFDI likely for much of
  WA, western Tasmania and parts of SA and Vic;
  broadly near- to below-median FFDI elsewhere.
• October: Below-median FFDI likely for most regions
  apart from western WA, western Tas and near the
  SA/Vic border.

• September–November: Below-median FFDI likely for
  most regions apart from western WA, western Tas and
  near the SA/Vic border.
• October -December: Below-median FFDI likely for
  most regions apart from much of WA, and parts of
  western Tas and near the SA/Vic border.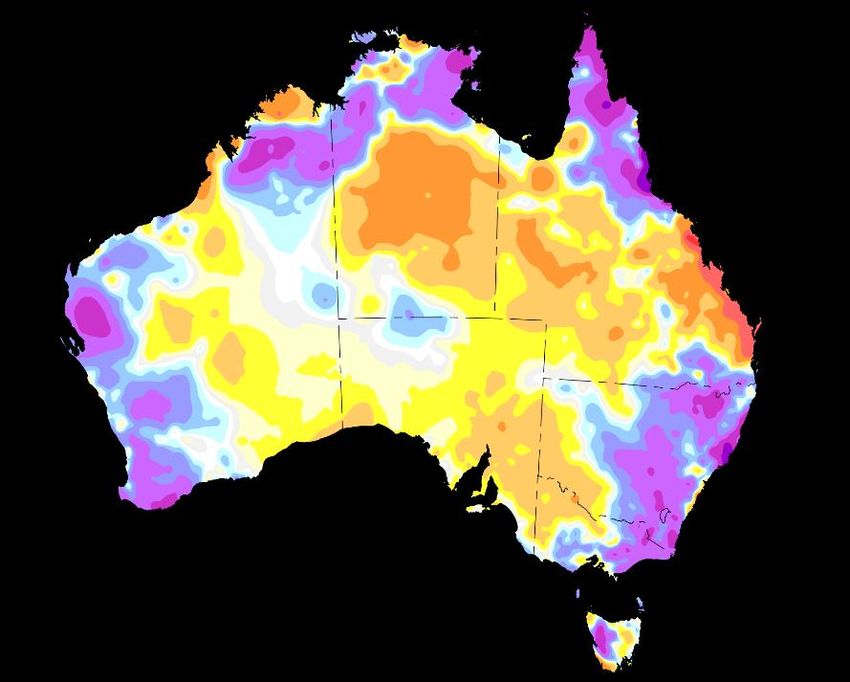
Climate influences summary
•       Indian Ocean Dipole (IOD)
    -     A negative IOD is underway
    -     A negative IOD typically increases the likelihood of above-average rainfall
          across much of Australia during the winter-spring period

•       El Niño-Southern Oscillation (ENSO)
    -     A La Niña WATCH has been issued, meaning around a 50% chance of La
          Niña developing in 2021—twice the normal likelihood

•       Madden-Julian Oscillation (MJO)
    -     Influence has shifted to the northern hemisphere, less impact over
          Australia

•       Southern Annular Mode (SAM)
    -     SAM is currently positive and expected to remain positive for the coming
          week.
    -     During spring, positive SAM typically increases likelihood of above-average
          rainfall for parts of south-eastern Australia

•       Long-term trends
    -     Australia's climate has warmed by ~1.44°C over the 1910–2019 period,
          while southern Australia has seen a reduction in cool season (April–
          October) rainfall in recent decades
    -     These trends can become more apparent in the outlooks when other
          climate drivers are neutral
Climate and severe weather
outlooks
• Rainfall and temperature: weekly, monthly &
  seasonal outlooks
• Heavy rainfall risk
• Flood risk
• Severe frost risk
• Strong wind, MSLP and cloudiness outlooks
• Bushfire seasonal outlook
                                                10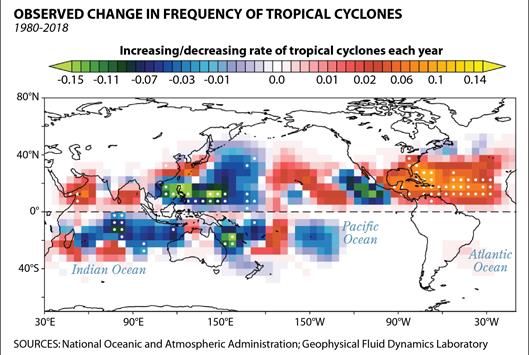
October 2021 outlook
             Chance of above median

           Maximum temperature                            Minimum temperature                             Rainfall

•   Above-median daytime temperatures very likely in far northern Australia and Tasmania; near to below
    median elsewhere
•   Above-median minimum temperatures likely for most regions apart from WA and parts of SA
•   Near to below median rainfall in WA and western Tas, mostly above-median rainfall elsewhere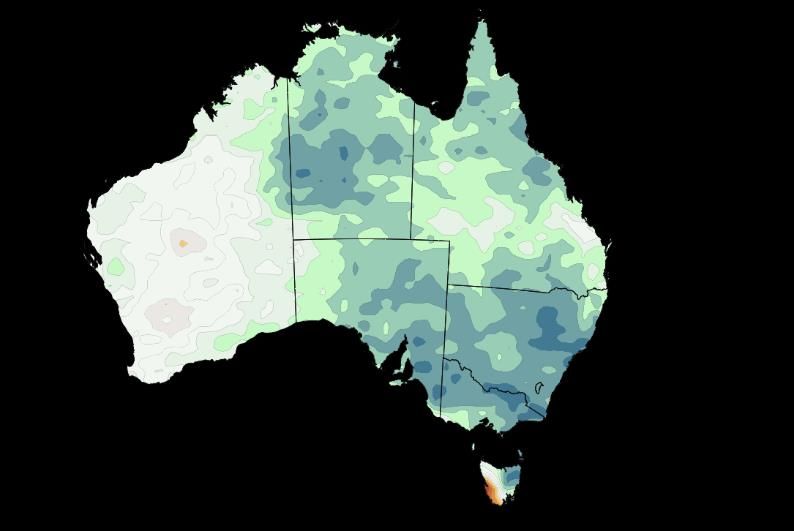
October – December 2021 outlook
             Chance of above median

           Maximum temperature                             Minimum temperature                               Rainfall

•   Above-median daytime temperatures very likely in parts of far northern Australia and Tasmania; near to
    below median elsewhere
•   Above-median minimum temperatures very likely for most regions apart from southern WA
•   Near to below median rainfall for most of WA and western Tas, mostly above-median rainfall elsewhere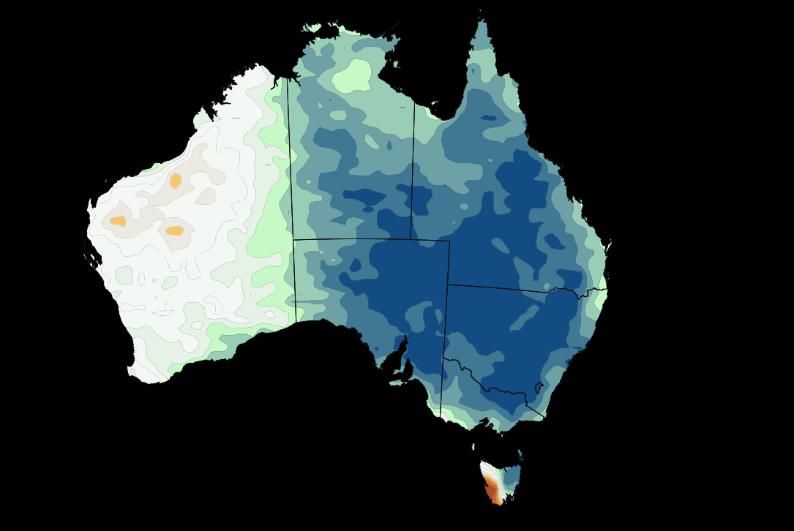
November 2021 – January 2022 outlook
            Chance of above median

          Maximum temperature                            Minimum temperature                              Rainfall

• Above-median daytime temperatures likely in parts of the far north and Tasmania; near to below median
  elsewhere
• Above-median night-time temperatures likely for most regions
• Near- to below-median rainfall for most of WA and western Tasmania, mostly above-median elsewhere
Rainfall anomaly forecast
October 2021 November 2021 October – December 2021
Experimental product
Typical rainfall: Typical rainfall: Typical rainfall: Maps not issued publicly
October November October-December Not for wide distributionWeekly rainfall outlooks
Week 1 (weather model) Week 2 (climate model) Week 3 (climate model)
23 – 29 September 27 September – 3 October 4 – 10 October
Experimental product
Maps not issued publicly
Not for wide distribution
• Week 1: significant rainfall totals (25+ mm) in western Tasmania, Vic/NSW alpine, and far SW WA
• Weeks 2-3: significant totals for western Tasmania, Vic/NSW alpine and Tablelands
• Week 1: ADFD (GFE–forecaster input) forecast
• Weeks 2 & 3: 50% chance of exceeding rainfall amount (ACCESS-S)Probability of 30 mm rainfall in 3 days
Week 2: 27 Sept – 3 October Week 3: 4 – 10 October Weeks 3+4: 4 – 17 October
Experimental product
Maps not issued publicly
Not for wide distribution
• Weeks 2 & 3: Moderate (50-75%) chance of 3-day totals exceeding 30 mm across western Tasmania and
alpine areas of Vic/NSW
• Weeks 3 + 4: Moderate to High (>50%) chance of 3-day totals exceeding 30 mm across western Tasmania
and alpine areas of Vic/NSW, parts of SE Qld and NE NSWWeek 2: 27 September – 3 October 2021 outlook
Maximum temperature anomaly Minimum temperature anomaly Rainfall anomaly
Experimental product
Maps not issued publicly
Not for wide distribution
• Average to above-average daytime temperatures likely for much of eastern Australia; below average for
much of WA, southern SA and eastern Qld/NE NSW
• Average overnight temperatures likely for much of eastern Australia; below average for much of WA,
southern SA, western Vic and eastern Qld/NE NSW
• Near to above average rainfall likely much of eastern mainland; below-average parts WA, SA and W TasWeek 3: 4 – 10 October 2021 outlook
Maximum temperature anomaly Minimum temperature anomaly Rainfall anomaly
Experimental product
Maps not issued publicly
Not for wide distribution
• Average to above-average daytime temperatures likely for most regions; below average parts of central east
and WA
• Average to above-average night-time temperatures likely most regions
• Near to above average rainfall likely much of eastern mainland; below-average parts WA, S Vic and W TasFrost potential: chance of temperatures below 2 °C
Week 2: 27 Sept – 3 October Week 3: 4 – 10 October Weeks 3+4: 4 – 17 October
Experimental product
Maps not issued publicly
Not for wide distribution
• Week 2 & 3: High (>70%) chance of frost for Tasmania, inland and elevated parts of Vic and NSW, and
elevated parts of south-east SA
• Weeks 3+4: High (>70%) chance of frost for Tasmania, inland and elevated parts of Vic and NSW, and
elevated parts of south-east SAWind direction, cloud and MSLP anomaly outlook
Week 2: 27 Sept – 3 October Week 3: 4 – 10 October Weeks 3+4: 4 – 17 October
Experimental product
Maps not issued publicly
Not for wide distribution
• Week 2: Anomalously low MSLP over much of the mainland, with westerly anomalies in the north;
enhanced north-easterly flow for parts of eastern Australia
• Weeks 3+4: Anomalously low MSLP over northern parts; anomalously high MSLP far southAustralian Seasonal Bushfire Outlook: September–November 2021
• The above-normal fire potential over northern New South Wales and south-
eastern Queensland are driven by grass and crop growth in these areas.
• In Western Australia, the above-normal fire potential in the north is driven by
grass growth and dry soil in this area.
• Below-normal fire potential predicted across the ACT, NSW and Victoria is a
result of vegetation recovering from the 2019-20 bushfire season
• While the current negative Indian Ocean Dipole increases the likelihood of
above-average spring rainfall for the eastern two-thirds of the mainland, the
climate could rapidly transition back to a neutral state from December.
• Enhanced grass growth over spring may lead to above-normal fire risk during
summer if weather conditions are conducive for drying of abundant fuels.
• It is important to remember that fire is a regular occurrence across Australia,
and areas designated as normal fire potential may still experience fire. Normal
fire risk does not mean there is no risk.
• This map incorporates weather and fuel information, as well as the rainfall
outlook
• For more information: Bushfire Seasonal Outlook for Spring 2021Severe storms
Thunderstorm asthma
• In Victoria, forecast service resumes 1st October
2021 and runs until end of December (typical grass
pollen season)
• Distributed by Vic Emergency, partnered by the
Bureau of Meteorology
• The 2021 negative Indian Ocean Dipole (IOD) is the
first negative IOD since 2016, the year of the
Melbourne thunderstorm asthma event
• Severe thunderstorms bring heavy rainfall, flash flooding, damaging winds, and large hail
• The Melbourne Thunderstorm Asthma event occurred in 2016, the last year prior to 2021 that a negative
Indian Ocean Dipole was active
• Increased grass growth in spring could increase the thunderstorm asthma risk due to above-average pollen
levelsTropical cyclone formation outlook Probability of tropical cyclone intensity surface wind: • Week 2 (28 Sep-4 Oct): Low-Moderate (10-40%) chance of TC forming in western North Pacific Ocean; Low (
Recent conditions

 •   Current water storages
 •   Recent rainfall and maximum temperatures
 •   Drought conditions
 •   Recent soil moisture

                                                25
Water storages as at 19 September 2021
Water storages
as at 22 September 2021
Rainfall and maximum temperatures (anomalies)
             Recent conditions (2021-to-date)

     Rainfall anomalies:                                                 Maximum temperature anomalies:
     1 January – 23 September 2021                                       1 January – 22 September 2021

•   Rainfall (Jan–Aug 21): Australia 1% above average | Australia wettest Jan-Aug since 2017
•   Max. temperature (Jan–Aug 21): Australia 0.67 °C above average| Australia coolest Jan–Aug since 2012
Rainfall and maximum temperatures
Recent conditions (2020)
Rainfall deciles: Maximum temperature deciles:
January–December 2020 January–December 2020
• Rainfall (2020): Australia 4% above average | No states/territories in top/bottom 10
• Max. temperature (2020): Australia 1.24 °C above average, 8th highest on record | WA 2nd highest (behind
2019), NT 5th highest, Qld 8th highest on recordRainfall and maximum temperatures (deciles)
Recent conditions (2021-to-date)
Rainfall deciles: Maximum temperature deciles:
January – August 2021 January – August 2021
• Rainfall (Jan–Aug 21): Australia 1% above average | Australia wettest Jan-Aug since 2017
• Max. temperature (Jan–Aug 21): Australia 0.67 °C above average| Australia coolest Jan–Aug since 2012Rainfall and maximum temperatures
Recent conditions (last 3 months)
Rainfall deciles: Maximum temperature deciles:
June – August 2021 June – August 2021
• Rainfall (Jun–Aug 21): Aust 4% below average (wettest since 2016) | No states/territories in top/bottom 10
• Max. temperature (Jun–Aug 21): Aust 1.27 °C above average, 7th highest on record | Qld 4th highest, NT
5th highest, Tas & SA both 9th highestRainfall and maximum temperatures
Recent conditions (last month)
Rainfall deciles: Maximum temperature deciles:
August 2021 August 2021
• Rainfall (Aug 2021): Aust 39% below average | No states/territories in highest/lowest 10 on record
• Maximum temperature (Aug 2021): Aust 1.77 °C above average, equal 9th highest on record | Qld 5th
highest, WA 10th highestRainfall deficiencies
17-months 48-months
April 2020 – August 2021 September 2017 – August 2021
• Short-term deficiencies (since February 2021) have been alleviated due to near-average rainfall in 2021.
• Medium-term deficiencies (since April 2020) are most notable in eastern Queensland.
• Long-term deficiencies (since September 2017) persist across several regions, with greatest deficiencies in
eastern South Australia, northern Victoria, western New South Wales, southern Western Australia, south-
eastern Queensland, and the northern Murray-Darling BasinRoot zone soil moisture
Recent conditions (0–100 cm below surface)
Very much above
average
Above average
Average
Below average
Very much below
average
August 2021 July 2021
• Soil moisture in July was above average in eastern NSW and southern Qld, southern parts of WA, SA and
Victoria, and western Tasmania
• Soil moisture in August has recently decreased across much of the mainland, particularly away from far
southern locationsForest Fire Danger Index (FFDI)
July 2021
August 2021
June 2021Trends in extremes
• Extreme heat
Coastal erosion
• Fire weather
• Tropical cyclones
36Trends in extreme heat • Extreme heat days: recent trend shows increased likelihood • 43 extreme heat days in 2019 is highest on record • La Niña in 2020–21 likely contributed to reduced number of extreme heat days in 2020
Trends in coastal erosion and inundation

•   Global sea level has risen by around 25 cm since 1880; half of this rise has occurred since 1970
•   Approximately 1 metre of horizontal incursion for every 1 cm of sea level rise
•   Rates of sea level rise vary across the Australian region, with the largest increases to the north and south-
    east of the Australian continent
Trends in dangerous fire weather days
• There has been an increase in the annual frequency of dangerous fire weather days across Australia
• Map shows the change in number of days that the FFDI exceeded 90th percentile, between two periods:
• July 1950 – June 1985
• July 1985 – June 2020Tropical cyclone numbers and IOD phase
During negative IOD years:
• Average to above-average TC seasons since 1970/71 were more likely during neutral or negative IOD years
• In the 8 negative IOD years since 1970, the average date of the first tropical cyclone in the Australian region was around
3 weeks earlier than normal (mid-November compared to the normal date of early December)
• Long-term trend: steadily declining TC numbers across Australia—average since 1970 is 11, since 2000 the average is 9Tropical cyclone numbers and ENSO phase During La Niña years: • Average to above-average number of tropical cyclones since 1970/71 associated with La Niña or neutral-ENSO state • Only 3 seasons since 2000 have seen 11 or more TCs • The only time multiple severe tropical cyclones made landfall in Queensland was during a La Niña year • Long-term trend: steadily declining TC numbers across Australia—average since 1970 is 11, since 2000 the average is 9
Trends in tropical cyclones
                                 Observed change in frequency of tropical cyclones
                                 1980-2018

                                Sources: National Oceanic and Atmospheric Administration; Geophysical Fluid Dynamics Laboratory

•   Red and orange areas show where tropical cyclone frequency has increased, while blue and green signifies
    decreased frequency from 1980–2018
•   There has been a downward trend in the number of tropical cyclones observed in the Australian region
    since 1982. The trend in cyclone intensity is harder to quantify.
http://bom.gov.au/knowyourweather
You can also read