Upper Missouri River Basin August 2021 Calendar Year Runoff Forecast - Missouri River Basin, Water ...
←
→
Page content transcription
If your browser does not render page correctly, please read the page content below
Upper Missouri River Basin
                     August 2021 Calendar Year Runoff Forecast
                                          August 5, 2021

                    U.S. Army Corps of Engineers, Northwestern Division
                          Missouri River Basin Water Management
                                        Omaha, NE

Calendar Year Runoff Forecast
Explanation and Purpose of Forecast

The long-range runoff forecast is presented as the Calendar Year Runoff Forecast. The Calendar
Year Runoff Forecast is available at https://www.nwd-mr.usace.army.mil/rcc/reports/runoff.pdf.
This forecast is developed shortly after the beginning of each calendar year and is updated at the
beginning of each month to show the actual runoff for historic months of that year and the
updated forecast for the remaining months of the year. This forecast presents monthly inflows in
million acre-feet (MAF) from five incremental drainage areas, as defined by the individual
System projects, plus the incremental drainage area between Gavins Point Dam and Sioux City.
Due to their close proximity, the Big Bend and Fort Randall drainage areas are combined.
Summations are provided for the total Missouri River reach above Gavins Point Dam and for the
total Missouri Basin above Sioux City (upper Basin). The Calendar Year Runoff Forecast is
used in the Monthly Study simulation model to plan future system regulation in order to meet the
authorized project purposes throughout the calendar year.

Observed Runoff

July runoff was 1.1 MAF, 34% of average for the Basin above Sioux City, IA. Runoff was well-
below average in the upper three reaches (Fort Peck, Garrison, and Oahe). Runoff in the Fort
Peck reach was the record lowest for July in 123 years of record-keeping. Observed
precipitation in July was below normal in the majority of the upper Basin.

2021 Calendar Year Forecast Synopsis

The 2021 calendar year runoff forecast for the upper Basin (above Sioux City, IA) is 14.6 MAF,
57% of average. If realized, this runoff amount would be the 10th lowest runoff in 123 years of
record-keeping. The 2021 calendar year runoff forecast for the Basin above Gavins Point is 13.2
MAF, 56% of average. Current and forecasted drier-than-normal and warmer-than-normal
conditions has led to a 1.0-MAF reduction from the July 1 annual runoff forecast of 15.6 MAF.

Due to the variability in precipitation and other hydrologic factors that can occur over the next 6
months, expected inflow could range from the 15.5 MAF upper basic forecast to the 13.8 MAF
lower basic forecast. The upper and lower basic forecasts are used in long-term regulation

                                                 1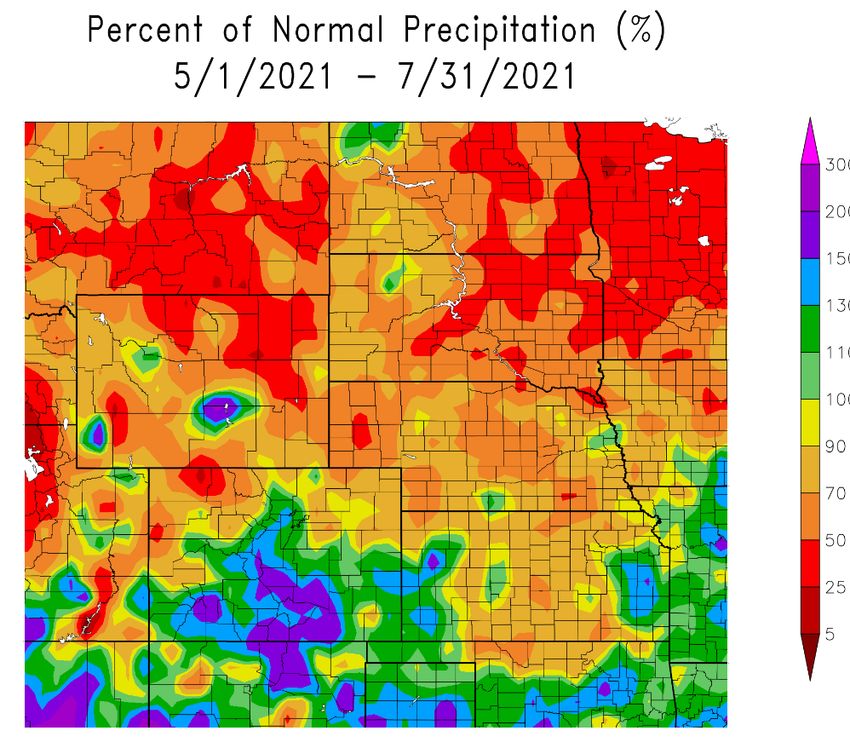
planning models to “bracket” the range of expected runoff given wetter-than-expected or drier-
than-expected conditions, respectively.

Current Conditions
Drought Analysis

The National Drought Mitigation Center’s drought monitor for August 3, 2021 is shown in
Figure 1. The drought monitor is available at https://droughtmonitor.unl.edu/. The U.S.
Drought Monitor for the Missouri Basin (Basin) shows at least Abnormally Dry (D0) conditions
are present in 79% of the Basin, with Extreme (D3) or Exceptional (D4) Drought present in 30%
of the Basin, mostly in Montana and into the Dakotas. The Seasonal Drought Outlook in Figure
2, which extends through the end of October, indicates drought conditions are likely to persist or
expand throughout the upper Basin.

                     Figure 1. National Drought Mitigation Center U.S. Drought Monitor.

                                                     2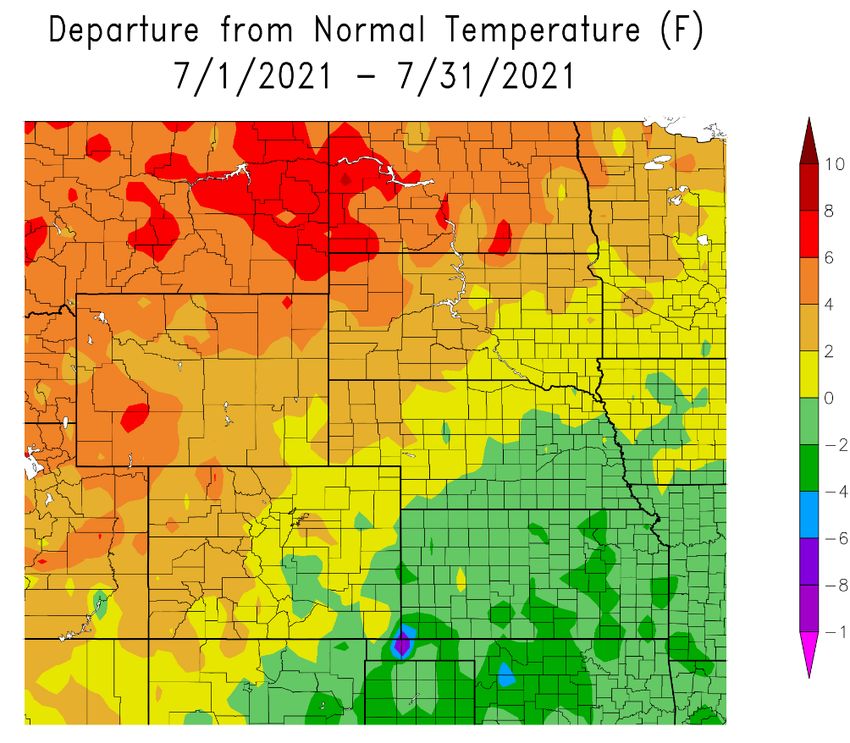
Figure 2. National Drought Mitigation Center U.S. Drought Seasonal Drought Outlook.
Precipitation
Monthly precipitation accumulations are shown using High Plains Regional Climate Center
(HPRCC) images available at https://www.hprcc.unl.edu/. The July precipitation accumulations
are shown in Figure 3 as a percent of normal precipitation. July precipitation was below normal
in the Basin except for small pockets of normal to above-normal precipitation. Much of
Montana and North Dakota saw less than 50% of their normal precipitation accumulation over
the last month.
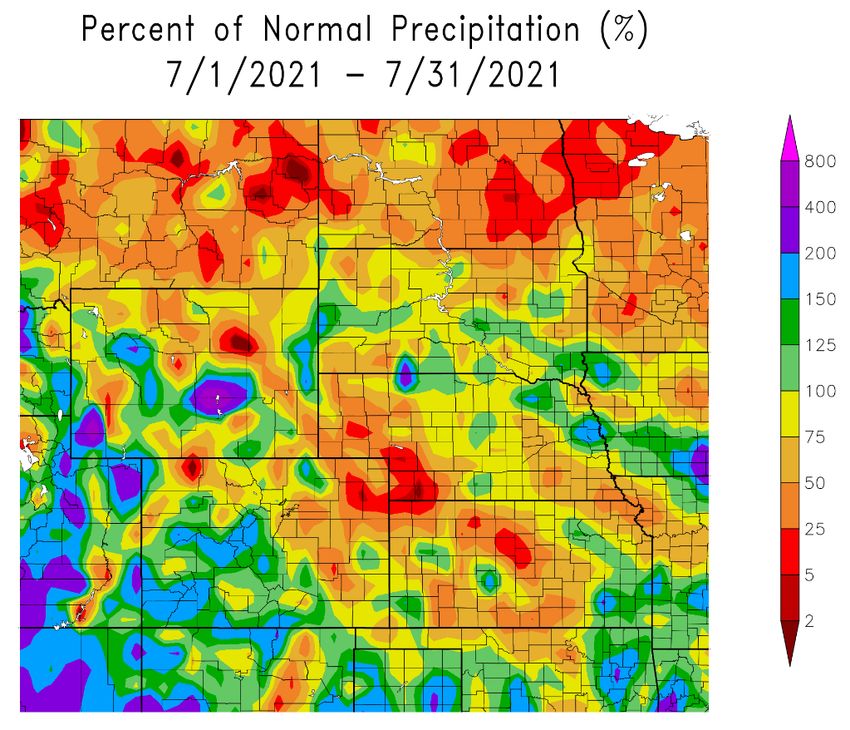
Precipitation as a percent of normal for the May-June-July 2021 period was below normal for
most of the Basin except for pockets in Kansas and into Missouri (Figure 4). Much of the Basin
saw less than 70% of its normal precipitation accumulation over the latest 3-month period; large
areas of Montana, northern Wyoming, and the eastern Dakotas saw less than 50% of their normal
precipitation accumulation.
3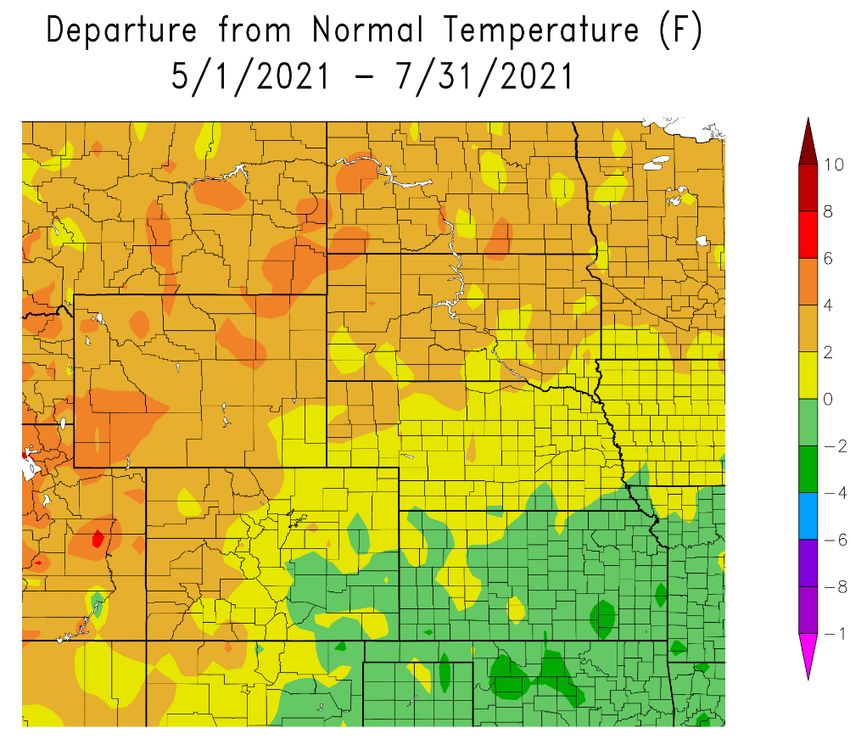
Figure 3. HPRCC July 2021 Percent of Normal Precipitation.

Figure 4. HPRCC May-June-July 2021 Percent of Normal Precipitation.

                                 4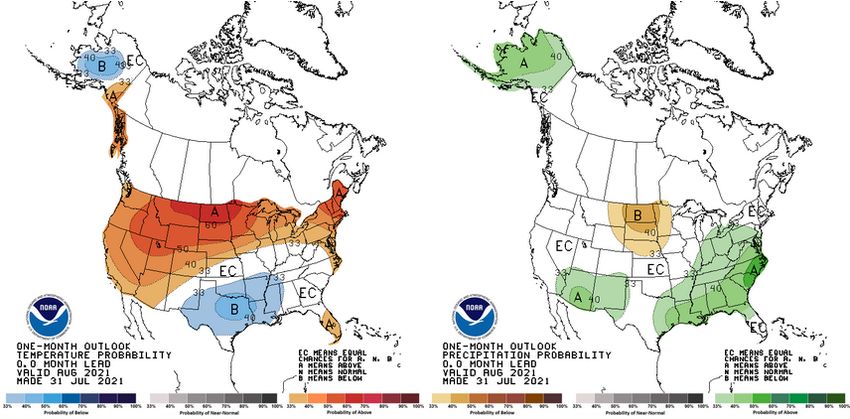
Temperature

July temperature departures in degrees Fahrenheit (deg F) in Figure 5 indicate that temperatures
were warmer than normal over the upper Basin and cooler than normal in the lower Basin. In the
Montana and North Dakota, temperature departures ranged from 4-8 deg F above normal. May-
June-July 2021 temperature departures are shown in Figure 6. The three-month average
departures were slightly above normal for most of the Basin, and slightly below normal for
Kansas and Missouri.

                     Figure 5. HPRCC June 2021 Departure from Normal Temperature.

                                                  5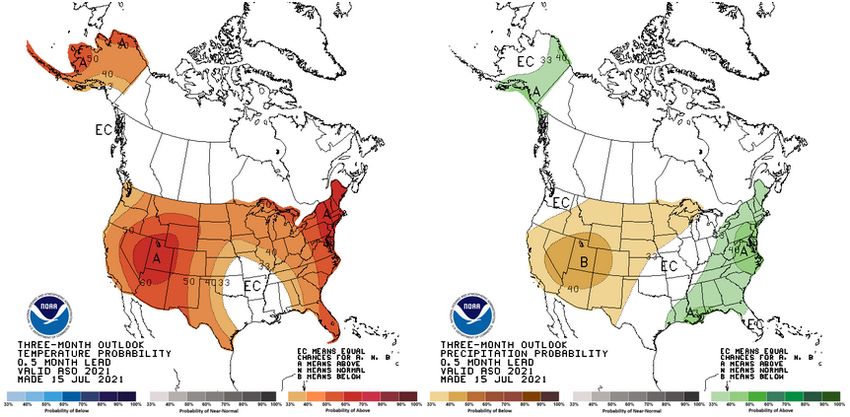
Figure 6. HPRCC May-June-July 2021 Departure from Normal Temperature.

Soil Moisture

Soil moisture is factored into the forecast as an indicator of wet or dry hydrologic basin
conditions. Typically, when soil moisture conditions are wet or greater than normal, rainfall and
snowmelt runoff is greater than when soil moisture is dry or less than normal. Not only is soil
moisture a physical parameter that influences runoff, but it can also be used as an indicator of
future runoff. As the calendar year approaches winter, the soil moisture conditions will provide
some insight into late winter and early spring runoff potential.

Soil moisture at the beginning of August 2021 is drier than normal across most of the Basin
except for Missouri and parts of Kansas. Soil moisture ranks in the lowest to 5th lowest
percentile for almost all of Montana and North Dakota. This is shown in soil moisture estimates
from the Climate Prediction Center (CPC) in Figure 7. Both the soil moisture anomalies and the
soil moisture percentiles are shown in Figure 7.

                                                  6
Soil Moisture Anomaly (mm) Soil Moisture Percentile
Figure 7. NOAA CPC Soil Moisture Anomaly (mm) and Soil Moisture Percentile. Source: NOAA NLDAS Drought Monitor
Soil Moisture. https://www.cpc.ncep.noaa.gov/products/Soilmst_Monitoring/US/Soilmst/Soilmst.shtml
Plains Snowpack
Plains snowpack is an important parameter that influences the volume of runoff occurring in the
Basin during the months of March and April. Historically, about 25% of annual runoff occurs in
March and April, during the time when plains snow is melting, due to both melting snowpack
and rainfall runoff. Runoff occurs in March and April whether or not there is any plains snow to
melt. Determining exact rainfall amounts and locations are nearly impossible to predict more
than a week in advance. Thus, the March-April runoff forecast is formulated based on existing
plains snowpack and existing basin conditions and hydrologic forecasts, which primarily
includes long-term precipitation outlooks. As the plains snowpack reaches its ultimate peak
accumulation, better forecasts of future runoff can be made.
Plains snowpack in the Basin has been nonexistent since before April 1, so was not factored into
the April 1 forecast.
Mountain Snowpack
Mountain snowpack is the primary factor used to predict May, June, and July runoff volumes in
the Fort Peck and Fort Peck to Garrison mainstem reservoir reaches. May, June, and July runoff
in the Fort Peck and Garrison reaches has good correlation to the June 1 snowpack. The
snowpack typically peaks in mid-April.
Figure 8 includes time series plots of the average mountain snow water equivalent (SWE)
beginning on October 1, 2020 based on the NRCS SNOTEL data for the headwater basin above
Fort Peck and the incremental basin from Fort Peck to Garrison. The current year’s average
SWE values (shaded blue area) are plotted against the 1981-2010 basin average SWE (bold red
line), a recent low SWE year in 2001 (green line), and two historic high SWE years occurring in
1997 (purple) and 2011 (dark blue).
7Figure 8. Mountain snowpack water content on June 27, 2021 compared to normal and historic conditions. Source:
Corps of Engineers - Missouri River Basin Water Management.
As of June 27, 2021, the mountain snowpack in the Fort Peck reach and the Garrison reach had
both completely melted. Mountain snowpack in the Fort Peck reach peaked on March 31 at
14.1”, which is 86% of the normal peak. Mountain snowpack in the Garrison reach peaked on
April 26 at 14.0”, which is 96% of the normal peak. Mountain snowpack melted out several
weeks earlier than normal, and runoff from that snowmelt had already been realized into Fort
Peck and Garrison reservoirs before July 1.
Climate Outlook
MRBWM participates in the monthly North Central U.S. Climate/Drought Outlook Webinar
coordinated through NOAA, the regional climate centers, and the American Association of State
Climatologists (AASC). These webinars provide updates on near-term climate outlooks and
impacts including the ENSO climate pattern and its implications on winter temperature and
precipitation patterns in the Missouri Basin.
ENSO (El Niño Southern Oscillation)
El Niño Southern Oscillation is an oscillation that occurs in the tropical Pacific Ocean and
fluctuates between warm episodes (El Niño), neutral conditions, and cold episodes (La Niña).
During El Niño winters, the favored storm track is typically across Canada, resulting in warm
temperatures and less snowfall in the Basin. During La Niña winters, the storm track typically
favors northwest flow across the Basin, resulting in cooler temperatures and above normal
snowfall.
8The latest ENSO Outlook indicates that ENSO-neutral conditions are present with a La Niña
watch in effect. There is a 51% chance that ENSO-neutral conditions will continue through the
August-October season. La Niña conditions could emerge during the September-November
season and last through the 2021-2022 winter with a 66% chance of La Niña conditions during
November through January.
Temperature and Precipitation Outlooks
The NOAA CPC outlooks provide the forecasted probability (or chance) of occurrence of future
weather conditions during periods ranging from 1 to 12 months into the future. The CPC
outlooks are available at https://www.cpc.ncep.noaa.gov/.
The August CPC outlooks in Figure 9 indicate increased chances for above-normal temperatures
over most of the basin and equal chances of above-normal, normal, or below-normal
temperatures in Kansas and Missouri. Precipitation outlooks indicate increased chances for
below-normal precipitation over the Dakotas, eastern Montana and Wyoming, and into Nebraska
and Iowa. Equal chances of above-normal, normal, or below-normal precipitation are possible in
the rest of the Basin.
Figure 9. NOAA CPC One-Month Temperature and Precipitation Outlooks (August).
Three-month temperature and precipitation outlooks for August-September-October 2021 and
November-December-January 2021-2022 are shown below in Figure 10 and Figure 11. During
the August-September-October period (Figure 10), the CPC indicates increased chances for
above-normal temperatures and below-normal precipitation over most of the Basin.
9Figure 8. NOAA CPC Three-Month Temperature and Precipitation Outlooks (August-September-October).
For the remainder of the 2021 calendar year into January 2022, CPC outlooks show equal
chances for above-normal, normal, or below-normal temperatures in much of the Basin.
Wyoming, Colorado, western Nebraska, and Kansas indicate increased chances for above-
normal temperatures. Equal chances for above-normal, normal, or below-normal precipitation
are indicated throughout the Basin (Figure 11).
As previously noted, there is limited confidence in long-term climate outlooks; therefore, the
climate outlooks will likely change as the calendar progresses.
Figure 9. NOAA CPC Three-Month Temperature and Precipitation Outlooks (November-December-January).
10Summary
Given the current and forecasted dry soil conditions and dry climate conditions, we expect runoff
to remain below average during the remainder of the calendar year. In summary, the 2021
calendar year runoff forecast is 14.6 MAF, 57% of average.
11You can also read