Data link Network Operational Status Report
←
→
Page content transcription
If your browser does not render page correctly, please read the page content below
Data link Network Operational Status Report
January 2021
This report is the monthly ‘Data link Network Operational Status Report’ as identified in
the DPMF Report Catalogue available from the DPMF OneSky team web site. It provides
a summary of the operational status and technical performance of data link in Europe
covering a rolling 12 month period for monthly statistics and a 15 week period for
weekly statistics, ending in January 2021.
The report covers three main areas of the datalink operations in Europe:
1. Operational Status
2. Technical Performance
3. VDL Mode 2 Performance
For each of the three areas above different metrics are presented. A detailed definition
of the metrics used in this report is available in the DPMF Report Catalogue. In the
following report, the identifier for each metric used in the DPMF Report Catalogue is
shown in angled brackets e.g. .
Notes:
The performance reports from 2021 onwards assess the technical performance
of data link above the level from which each ATSU provides the data link service,
using a single level for each Centre as described in
https://ext.eurocontrol.int/WikiLink/index.php/Implementation_Status_Table
As soon as new ANSPs are providing LISAT logs to DPMF, the metrics are updated
accordingly (sometimes retroactively) and the values presented in this report might
evolve from a report to another.
As from August 2020 this report now includes data from LEBC, LEBM and GCCC (Spain)
with data since March 2020
As from September 2020 this report now include data from EVRR (Latvia).
As from December 2020 this report now include data from DSNA (LFEE, LFFF, LFMM,
LFRR and LFBB) with data since January 2020.
1 Classification:TLP : White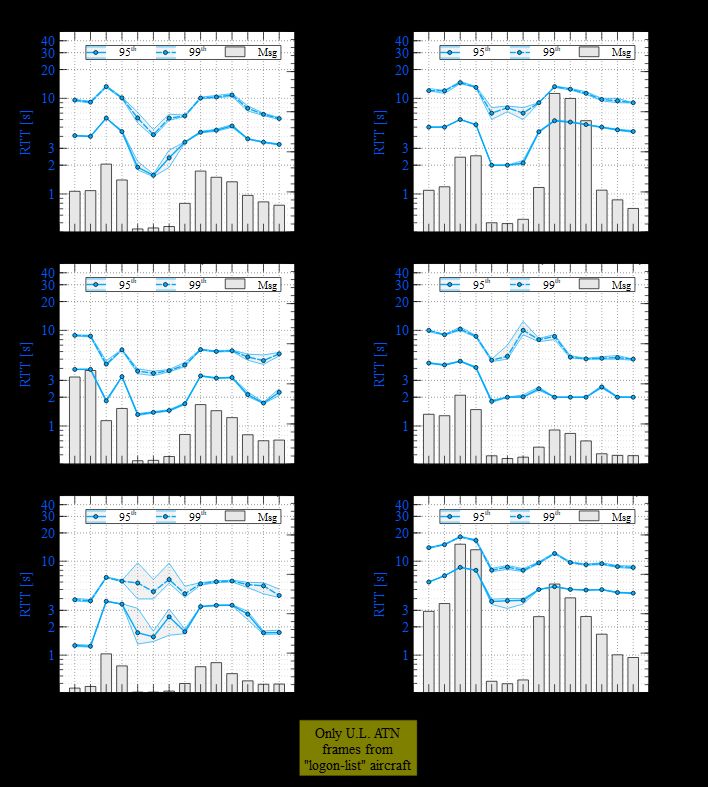
1. Operational Status
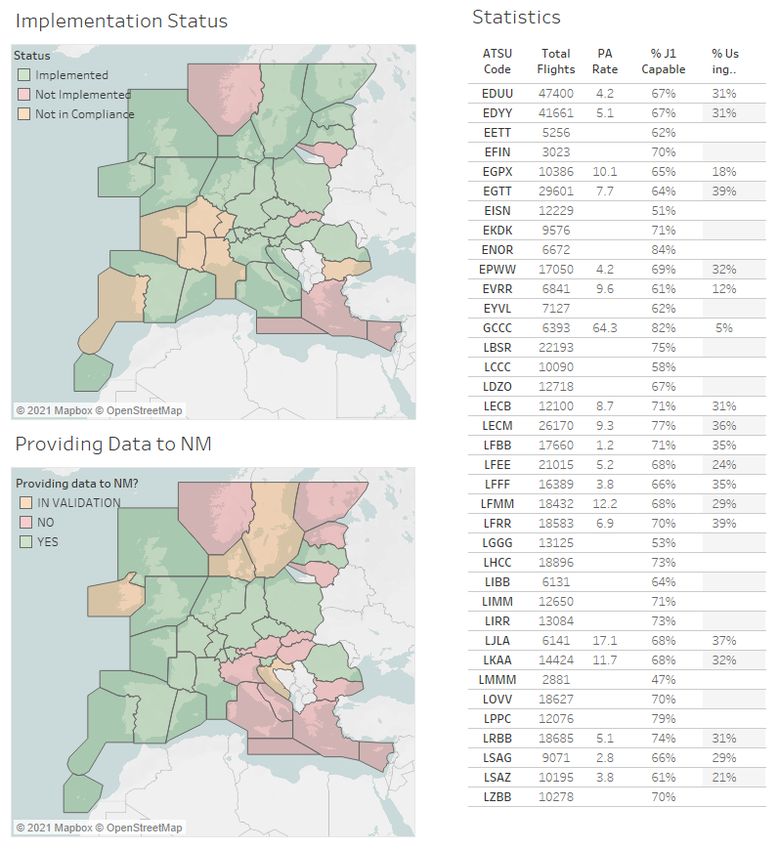
Figure 1 on the following page provides a status for each FIR/UIR covered by the DLS IR.
The top map shows the operational status of each centre () as of end of January
2021. The map below shows which centres are providing LISAT data to NM as of end of
January. The table on the right shows per centre for the month of January: i) the number
of flights operating above FL285, ii) The Provider Abort rate (only for those centres
providing LISAT data to NM), iii) what percentage of flights indicate that they are capable
of performing CPDLC over the ATN (i.e. file ‘J1’) and iv) what percentage of the flights
operating above FL285 are actually seen using CPDLC over the ATN
ANSPs with service limitations
The table below explains the limitations of service for those centres shown in yellow in
‘Implementation Status’ map on Figure 1 i.e. those centres that provide data link but not
in full compliance with (EC) No 29/2009 as amended.
Centre Limitation of service
LPPC Only the DLIC service is provided.
LFEE, LFFF, DLIC, ACM, AMC services provided (no ACL).
LFMM
LFRR, LFBB DLIC, ACM, AMC and ACL services provided, but no downlink
messages of ACL are supported.
LBSR DLIC, ACL, ACM, AMC services provided but only for the SITA
network.
EDUU Airspace control in south-eastern part below FL315 is delegated to
Munich ACC (EDMM). In this airspace DLS services are only
available after prior coordination (i.e. when EDUU agrees to
take/maintain control of flight).
2 Classification:TLP : White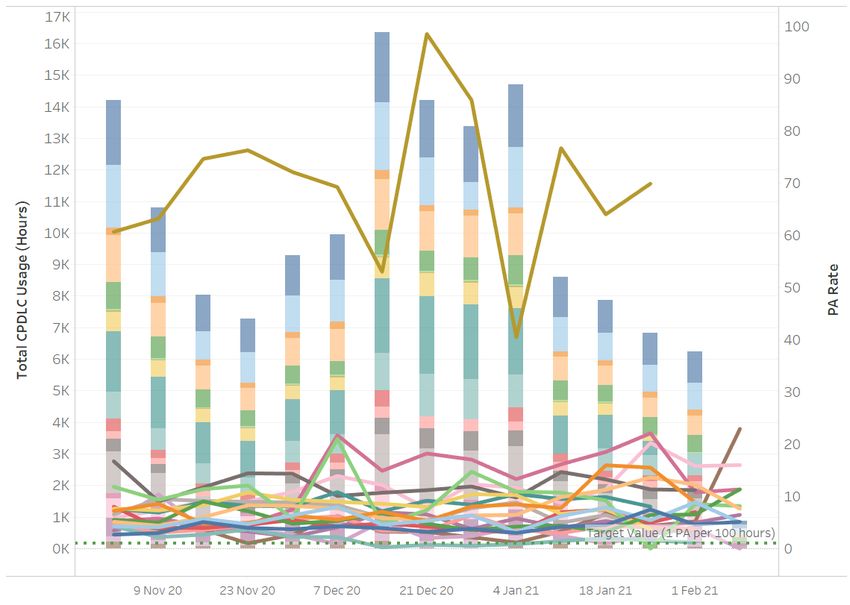
Figure 1: Current operational status of data link over the ATN

3                                                Classification:TLP : White

CPDLC / ATN Flights
Figure 2 presents data only for flights operating above FL285 in the DLS airspace. It
shows what percentage of flights in that airspace1 file ‘J1’ in their flight plan and
what percentage indicate in the flight plan that the aircraft is exempt. For January 2021
67.3% of flights indicated the capability to perform CPDLC over ATN/VDL Mode 2
26.5% indicate they are exempt. The remaining 6.2% filed neither capability, nor
exemption. Considering the known exceptions, NM is estimating that about 2.2% of the
filed FPLs are likely contravening the DLS IR.

                   Figure 2: Proportion of flights capable of using CPDLC over ATN/ VDL Mode 2

1 EHAAFIR, LOVVFIR, LECBUIR, LIBBUIR, EBURUIR, GCCCUIRN, GCCCUIRS, LFFFUIR, EDVVUIR, LPPCFIR, EGTTUIR, LECMUIR, LIMMUIR,
EDUUUIR, LIRRUIR, EGPXUIR, EISNUIR, LZBBFIR, LRBBFIR, LHCCFIR, EKDKFIR, LJLAFIR, LCCCFIR, LKAAFIR, LBSRFIR, EPWWFIR, EFINFIR,
LGGGUIR, LMMMUIR, EVRRUIR, ESAAUIR, EETTUIR, EYVLUIR.

4                                                                                 Classification:TLP : White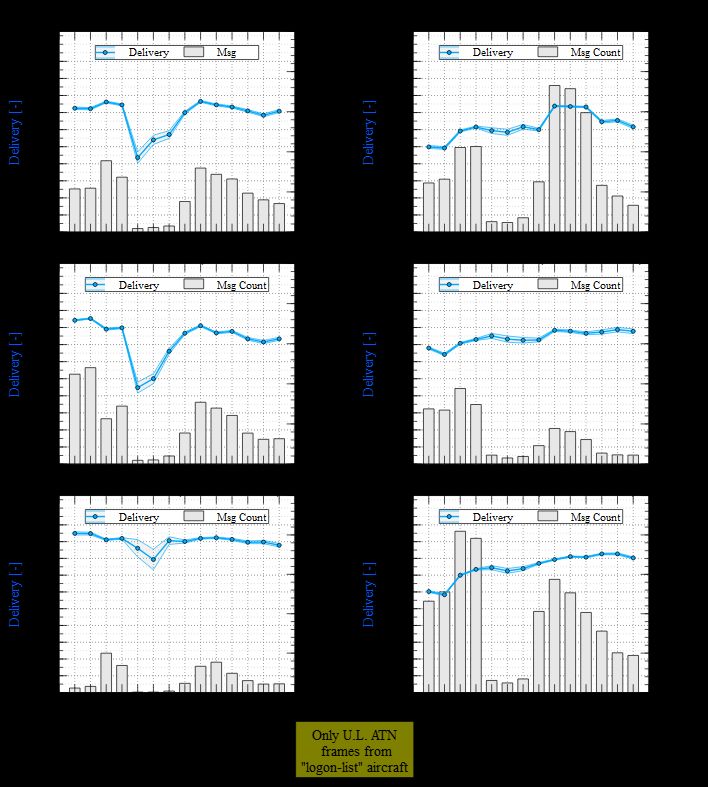
2. Technical Performance
Overall Provider Abort Rate
Figure 3 below shows the PA rate  aggregated for all ANSPs providing data to
LISAT2. The target value is 1 PA per 100 hours CPDLC (shown as a dashed line on the
graph below). The overall average rate for January 2021 was 6.7 PAs per 100 hours.

                                            Figure 3: PA rate

Figure 4 below shows the PA rate of aircraft on the Logon List against aircraft not on the
Logon List using only data from centers that do not support the Logon List3.

                                 Figure 4: Logon Listed Aircraft PA rate

2 Currently MUAC, Skyguide, DFS, NATS, ANS CZ, Slovenia Control, PANSA, ENAIRE, Latvia, Romatsa and
DSNA.
3 EDUU,EGTT,EGPX,LKAA,GCCC,LECB,LECM,LJLA,EPWW,.

5                                                                 Classification:TLP : White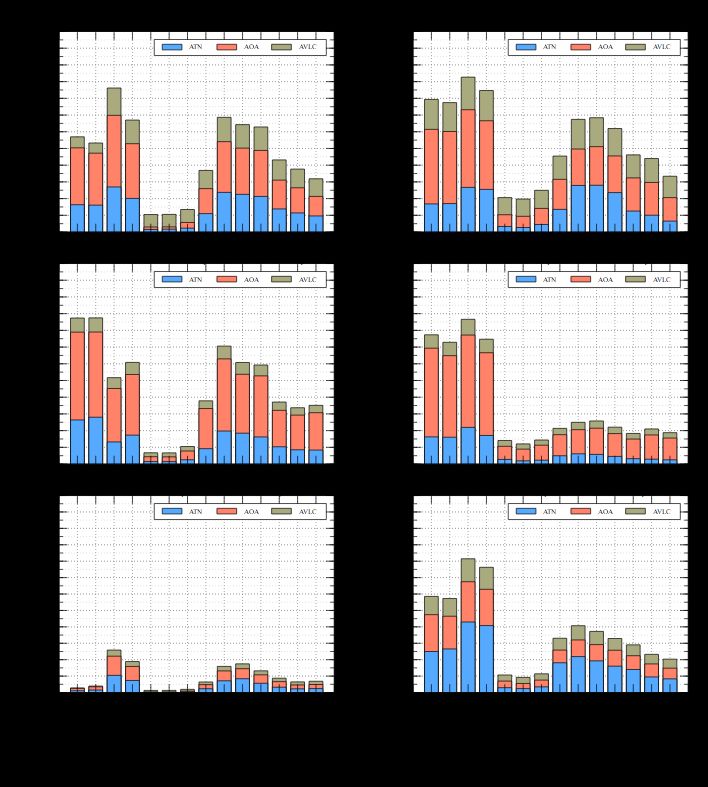
PA rate per ACSP
Figure 5 below shows the PA rate per ACSP for aircraft on the Logon List. The ACSP
information is taken from the declarations made by the aircraft operators when adding
their aircraft to the Logon List; ‘BOTH’ implies that the aircraft may use ARINC or SITA.

                                    Figure 5: ACSP PA rate

Weekly PA rate per Centre

                              Figure 6: Weekly PA Rate per Centre

6                                                            Classification:TLP : White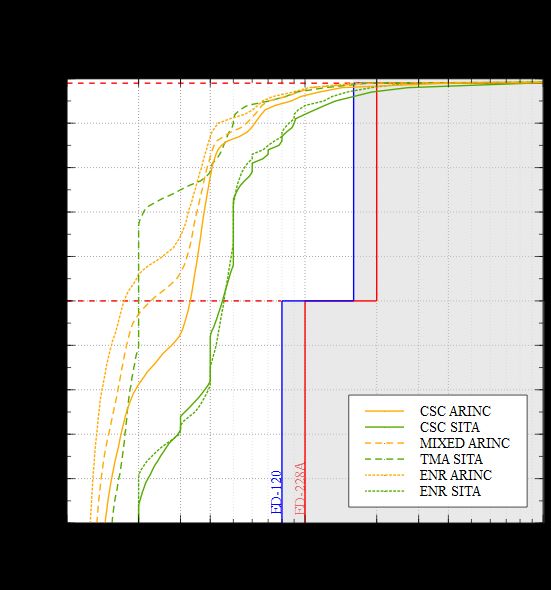
Weekly PA Rate for Major Aircraft Operators
Figure 7 below shows the weekly PA rate for the three aircraft operators with the lowest
average PA rate and the three aircraft operators with the highest average PA rate from a
list of the top 30 aircraft operators in terms of usage of CPDLC/ATN over the past 15
weeks.

                 Figure 7: Top 3 and bottom 3 PA Rate for Major Aircraft Operators

Weekly PA Rate for 5 biggest CPDLC users
Figure 8 below shows the weekly PA rate for the five aircraft operators that have used
CPDLC most over the past 15 weeks.

                         Figure 8: PA Rate of the 5 biggest users of CPDLC

7                                                              Classification:TLP : White
Weekly PA Rate for various aircraft types
The figures below show the weekly PA rate for specific aircraft types for the five aircraft
operators using CPDLC the most over the past 15 weeks with the particular aircraft type.
Airbus A320 Family
Figure 9: A320 Family (A318/319/320/321/20N/21N) Aircraft Operator PA Rates
Boeing B737 Family
Figure 10: B737 Family Aircraft Operator PA Rates
8 Classification:TLP : WhiteTechnical Round Trip Delay
Figure 11 below shows the 95th and 99th percentile of the technical round trip delay . It represents the delay between when a message is uplinked and the ground
system receives the corresponding application level acknowledgement (aggregated for
all systems providing data to LISAT). As agreed during DPMG8, the TRTD is now
computed taking into account downlinked error messages. This has resulted in an
increase of the 99th percentile.
Figure 11: Technical Round Trip Delay
9 Classification:TLP : WhiteTechnical Continuity
The graph below shows the ‘Technical Continuity” (). This is the probability that
a LACK is received for an uplink message before the technical response timer expires i.e.
within 40 seconds.
1 1400000
0.95
1200000
0.9
0.85 1000000
Technical Continuity
Total transactions
0.8
800000
0.75
600000
0.7
0.65 400000
0.6
200000
0.55
0.5 0
Total transactions Technical Continuity
Figure 12: Technical Continuity
N.B.: The way this metric is calculated is now correct (compared to previous reports)
and taking into account messages which do not receive a LACK.
10 Classification:TLP : White3. VDL Mode 2 Performance
The following metrics4 are computed based on the available data from the VGS logs
provided each month to the DPMF by ARINC and SITA. These logs contain the AVLC
traffic recorded at each VGS during the 24hrs of the first Friday5 of each month.
AVLC Round Trip Time for the first Friday of the month.
The graph below shows the cumulative distributions per frequency (and per CSP) for
the AVLC Round Trip Time (RTT) of acknowledged AVLC INFO frames conveying ATN
packet to Logon-List aircraft and considering all the VGS logs. The 95th and the 99th
percentile of ED-120 together with the 95th and the 99.9th percentile of ED-228A are also
provided for comparison purposes and tabulated values are reported in the legend.
Please note the logarithmic scale of the RTT.
Figure 13: AVLC Round Trip Time
Important note: SITA is providing logs for all their users whereas ARINC is only providing
data for their 28 largest ATN users as well as non-AOC users. Moreover, ARINC is providing logs
for all their European VGSs whereas SITA is only providing logs of VGSs from which they have
access to (mainly: Norway, Sweden, UK, The Netherlands, Germany, Czech Rep., France,
Switzerland, Austria and Spain). Therefore the CSPs data does not represent the behaviour of
their network as a whole. The trend information for each CSP is valuable and useful but the
comparison between the two CSPs is problematic since different data sets are being compared.
4 The Channel load, the AVLC RTT distribution and the number of retransmission distribution are defined in
the DPMF report catalogue.
5 Friday is observed to have the highest flight traffic of the week.
11 Classification:TLP : WhiteNumber of retransmissions for the first Friday of the month.
The graph below shows the cumulative distributions per frequency (and per CSP for the
CSC) for the number of retransmissions needed before acknowledgement of uplink
AVLC INFO frames conveying ATN packet to Logon-List aircraft considering all the VGS
logs. N=0 represents successes on the first attempt, N=1 to N=5 represent successes on
the first to the fifth retransmissions and N>5 represents N2T1 events.
Figure 14: AVLC Uplink INFO frame retransmission count
Important note: SITA is providing logs for all their users whereas ARINC is only providing
data for their 28 largest ATN users as well as non-AOC users. Moreover, ARINC is providing logs
for all their European VGSs whereas SITA is only providing logs of VGSs from which they have
access to (mainly: Norway, Sweden, UK, The Netherlands, Germany, Czech Rep., France,
Switzerland, Austria and Spain). Therefore the CSPs data does not represent the behaviour of
their network as a whole. The trend information for each CSP is valuable and useful but the
comparison between the two CSPs is problematic since different data sets are being compared.
12 Classification:TLP : WhiteAVLC Round Trip Time per frequency trend
The following set of graphs show the 95th and the 99th percentile of the AVLC RTT (in
seconds) of acknowledged AVLC INFO frames conveying ATN packet to Logon-List
aircraft for the first Friday of each month for each frequency with the CSC split over the
two CSPs. The RTT axis has a logarithmic scale with the same range for the different
frequencies. The graphs also shows the number of AVLC frames taken into account in
the percentiles calculations (Frame count in linear scale) and the 95% confidence
interval (gray area).
Figure 15: AVLC Uplink INFO Round Trip Time per Frequency
Important note: SITA is providing logs for all their users whereas ARINC is only providing
data for their 28 largest ATN users as well as non-AOC users. Moreover, ARINC is providing logs
for all their European VGSs whereas SITA is only providing logs of VGSs from which they have
access to (mainly: Norway, Sweden, UK, The Netherlands, Germany, Czech Rep., France,
Switzerland, Austria and Spain). Therefore the CSPs data does not represent the behavior of
their network as a whole. The trend information for each CSP is valuable and useful but the
comparison between the two CSPs is problematic since different data sets are being compared.
13 Classification:TLP : WhiteUplink delivery success rate
The following set of graphs show the uplink delivery rate of AVLC INFO frames
conveying ATN packet to Logon-List aircraft for the first Friday of each month for each
frequency with the CSC split over the two CSPs. It is the probability that an AVLC uplink
INFO frame is correctly delivered to the aircraft (ACK received). The graphs also shows
the number of AVLC frames taken into account in the calculations (Msg count in linear
scale = AVLC frame count sent on first attempt) and the 95% confidence interval (gray
area).
Figure 16: AVLC successful delivery rate per frequency
Important note: SITA is providing logs for all their users whereas ARINC is only providing
data for their 28 largest ATN users as well as non-AOC users. Moreover, ARINC is providing logs
for all their European VGSs whereas SITA is only providing logs of VGSs from which they have
access to (mainly: Norway, Sweden, UK, The Netherlands, Germany, Czech Rep., France,
Switzerland, Austria and Spain). Therefore the CSPs data does not represent the behavior of
their network as a whole. The trend information for each CSP is valuable and useful but the
comparison between the two CSPs is problematic since different data sets are being compared.
14 Classification:TLP : WhiteChannel load per frequency trend
The following set of graphs show the channel load per AVLC payload type (ATN, AOA
and AVLC protocol related frames6) for the first Friday of each month for each frequency
with the CSC split over the two CSPs. The channel load is expressed in megabytes with
the same range for the different frequencies.
Figure 17: AVLC Channel load per frequency
Important note: SITA is providing logs for all their users whereas ARINC is only providing
data for their 28 largest ATN users as well as non-AOC users. Moreover, ARINC is providing logs
for all their European VGSs whereas SITA is only providing logs of VGSs from which they have
access to (mainly: Norway, Sweden, UK, The Netherlands, Germany, Czech Rep., France,
Switzerland, Austria and Spain). Therefore the CSPs data does not represent the behavior of
their network as a whole. The trend information for each CSP is valuable and useful but the
comparison between the two CSPs is problematic since different data sets are being compared.
6 i.e. RR, SREJ, XID, …
15 Classification:TLP : White©2020 The European Organisation for the Safety of Air Navigation (EUROCONTROL). This document is published by EUROCONTROL for information purposes. It may be copied in whole or in part, provided that EUROCONTROL is mentioned as the source and the extent justified by the non-commercial use (not for sale). The information in this document may not be modified without prior written permission from EUROCONTROL. 16 Classification:TLP : White
You can also read