Media Phone Conference Q2 2021 - Ludwigshafen am Rhein, July 28, 2021 - BASF

Page created by Patrick Luna
 
CONTINUE READING
Media Phone Conference Q2 2021 - Ludwigshafen am Rhein, July 28, 2021 - BASF
Media Phone Conference Q2 2021
                                                            Ludwigshafen am Rhein, July 28, 2021
  1    July 28, 2021 | Media Telephone Conference Q2 2021
Photo: Vattenfall/Jorrit Lousberg
Media Phone Conference Q2 2021 - Ludwigshafen am Rhein, July 28, 2021 - BASF
Q2 2021: BASF with very strong second quarter
supported by higher prices and volumes
▪ Strong growth momentum continued in Q2 2021                      EBIT before special items by quarter
                                                                   million €
▪ In Q2 2021, volumes and prices grew across all regions and all                     137%
                                                                                                      942%
  segments                                                         2,500                                      2,355

▪ Earnings in upstream businesses considerably above Q2 2020,      2,000
  despite a slight sequential decline in margins compared with
  Q1 2021                                                          1,500

                                                                            995
▪ Downstream businesses with strong demand and increased           1,000
  prices but continued pressure from raw materials prices
                                                                    500
                                                                                             226

                                                                      0
                                                                           Q2 2019          Q2 2020          Q2 2021

2   July 28, 2021 | Media Telephone Conference Q2 2021
Media Phone Conference Q2 2021 - Ludwigshafen am Rhein, July 28, 2021 - BASF
Recovery of global chemical production continued in Q2 2021

Chemical production compared with prior-year quarter1
%

                                                                                                                                                                              Global
                                                                                                                                                                                                          10.7     9.6
                                                                                                                                                                                                    5.2
                                                                                                                                                                                              1.7

                                                                                                                                                                                      -2.9
                                                                                                                                                                               -4.8

                                                                                                                                                                               Q1     Q2      Q3    Q4    Q1       Q2
                                                                                                                                                                                           2020             2021

                                                           Source: BASF, data: IHS, Feri, NBS China, FED, Eurostat, Statistics Canada;
                                                           Asia: India, Japan, South Korea, Taiwan, Thailand; North America: USA and Canada
                                                         1 Estimates, data available for China and the U.S. until June, for all other countries/regions until May or April.

3   July 28, 2021 | Media Telephone Conference Q2 2021     Historical data partly preliminary and subject to revision. China data based on BASF seasonal adjustment
Media Phone Conference Q2 2021 - Ludwigshafen am Rhein, July 28, 2021 - BASF
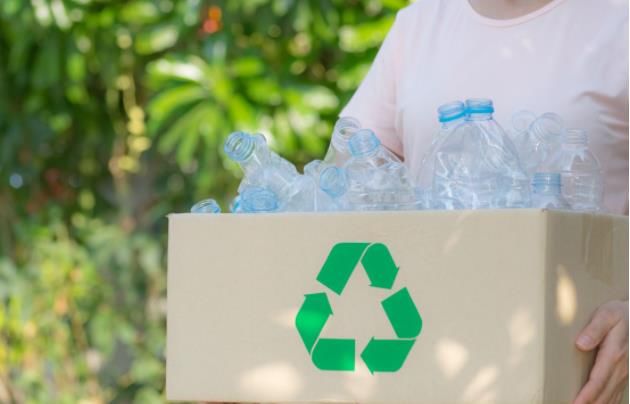
BASF Group Q2 2021: Volume growth across all regions

Sales volumes development by region1
quarters compared to prior-year quarters
%
                BASF Group                                                Europe                      North America                     Greater China
 44.0
 40.0
 36.0
 32.0
 28.0                                                                                                                                               43
 24.0
 20.0                                                                                       34
 16.0                                       28                                                                            27
 12.0                                                                                                                              16
  8.0                                 9
                                                                                                                                          17   12        10
  4.0     4                    7                         5                         9    3        5               4    4
  0.0                                                                     -4
 -4.0           -11    -2                                                                            -13   -10                 0
 -8.0                                                            -18
-12.0
-16.0
-20.0
-24.0
        Q1 Q2 Q3 Q4                  Q1 Q2               Q1 Q2 Q3 Q4                    Q1 Q2    Q1 Q2 Q3 Q4          Q1 Q2    Q1 Q2 Q3 Q4          Q1 Q2
             2020                     2021                    2020                       2021         2020             2021         2020             2021

4   July 28, 2021 | Media Telephone Conference Q2 2021       1   Location of customer
Media Phone Conference Q2 2021 - Ludwigshafen am Rhein, July 28, 2021 - BASF
BASF Group Q2 2021: Volume growth across all segments

Volume development by segment
Q2 2021 vs. Q2 2020                                                                                                     Overall
absolute (million €) terms                                                                       Agricultural           volume
                                                                        Surface      Nutrition    Solutions     Other
                                                                                      & Care                             3,516
                                                                      Technologies                   265         87
                                                                         1,367          79

                                                         Industrial
                                                         Solutions
                               Materials                    466
                                 902

    Chemicals
       350

      20%                        42%                     26%           44%         5%           15%        17%    28%

relative (%) terms

5   July 28, 2021 | Media Telephone Conference Q2 2021
Media Phone Conference Q2 2021 - Ludwigshafen am Rhein, July 28, 2021 - BASF
BASF Group Q2 2021: Sales increased considerably due to higher
prices and volumes
Sales bridge Q2 2021 vs. Q2 2020
million €
25,000                                                   63% organic sales growth

                                                                                4,468             -18          -893
20,000                                                                                                                         19,753
                                                                                                           Negative FX
                                                     3,516                                                 effects were
15,000                                                                      All segments                   mainly related to
                    12,680                                                                                 the U.S. dollar
                                                                            increased prices
                                                  All segments
10,000                                            increased
                                                  volumes

 5,000

    0
                   Q2 2020                         Volumes                     Prices          Portfolio   Currencies          Q2 2021

Sales development
Q2 2021 vs. Q2 2020                                   28%                     35%               0%
                                                                                                              
                                                                                                                  -7%           56%

6   July 28, 2021 | Media Telephone Conference Q2 2021
Media Phone Conference Q2 2021 - Ludwigshafen am Rhein, July 28, 2021 - BASF
BASF Group Q2 2021: Very strong earnings growth

EBIT before special items growth by segment Q2 2021 vs. Q2 2020
million €

EBIT before special items by segment
Q2 2021, million €                   990                 792   307   289   138   75   -236   2,355

7   July 28, 2021 | Media Telephone Conference Q2 2021
Media Phone Conference Q2 2021 - Ludwigshafen am Rhein, July 28, 2021 - BASF
Nutrition & Care and Agricultural Solutions: Main drivers for
EBIT before special items development in Q2 2021
                           Nutrition & Care                                                                                           EBIT before special items by quarter
                           ▪ Nutrition & Health                                                                                       million €
                             ▪ The segment’s earnings decline was mainly driven by Nutrition & Health. The division’s margins         300                    256
                               declined due to negative currency effects, lower prices and higher variable costs compared with               220
                               the strong prior-year quarter.                                                                         200
                                                                                                                                                                             138
                             ▪ The earnings decline was most pronounced in animal nutrition. Lower volumes in vitamin A, mainly due
                               to the start-up of the vitamin A expansion, and higher costs from turnarounds were the main drivers.   100
                           ▪ Care Chemicals
                             ▪ Higher raw materials prices put pressure on margins compared with the strong prior-year quarter.         0
                                                                                                                                             Q2             Q2                Q2
                            Sales development                 Volumes              Prices            Portfolio       Currencies
                                                                                                                                            2019           2020              2021
                                                                5%                 2%
                                                                                                                        
                            Q2 2021 vs.Q2 2020                                                              -1%              -4%

                           Agricultural Solutions                                                                                     EBIT before special items by quarter
                                                                                                                                      million €
                            ▪ Significant volume increase and higher prices could not compensate for                                  150
                              ▪ Strong FX headwind                                                                                           121           120
                              ▪ Higher fixed costs and freight cost increases due to higher sales volumes                             100
                                                                                                                                                                             75
                              ▪ Unfavorable margin development on account of product mix effects
                                                                                                                                       50

                           Sales development                 Volumes               Prices            Portfolio       Currencies         0

                           Q2 2021 vs.Q2 2020                   15%                3%                     0%
                                                                                                                         
                                                                                                                             -7%
                                                                                                                                             Q2            Q2             Q2
                                                                                                                                            2019          2020           2021

8   July 28, 2021 | Media Telephone Conference Q2 2021
Media Phone Conference Q2 2021 - Ludwigshafen am Rhein, July 28, 2021 - BASF
Major portfolio measures: Acquisitions

                                                                                                                                                                    Photo: Vattenfall/Jorrit Lousberg

BASF and Shanshan to form a joint venture                                                                         BASF to acquire 49.5% of the offshore wind farm
for battery materials production in China                                                                         Hollandse Kust Zuid (HKZ) from Vattenfall

▪   BASF to hold 51%, Shanshan 49%                                                                                ▪   Once fully commissioned HKZ will be the largest offshore wind
▪   BASF investment in a mid-triple-digit million-euro range                                                          farm in the world with a total installed capacity of 1.5 gigawatts

▪   Hunan Shanshan Energy operates four production sites for CAM                                                  ▪   BASF will use the zero-emission electricity for its sites in Europe,
    and PCAM in China, with an annual capacity of 90 kt by 2022                                                       mainly in Antwerp, Belgium

▪   By forming the JV, BASF further strengthens its position in Asia and is                                       ▪   Purchase price of €0.3 billion, BASF’s initial total commitment is
    increasing its global annual capacity to 160 kt by 2022 with further                                              ~€1.6 billion. BASF intends to reduce its investment by selling
    expansions underway                                                                                               shares to a financial co-investor

▪   Closing is targeted for later this summer1                                                                    ▪   Closing is expected in Q4 20211

9   July 28, 2021 | Media Telephone Conference Q2 2021   1   Following the approval of the relevant authorities
Major portfolio measures: Divestitures

                                                                     BASF and Clayton, Dubilier & Rice to sell
DIC acquired BASF’s pigments business                                Solenis to Platinum Equity                                                              Initial public offering of Wintershall Dea

▪    Sales 2018: ~€1 billion                                        ▪     Sales 20202: $2.8 billion                                                          ▪   Sales 2020: ~€3.6 billion
▪    BASF and DIC reached an agreement on                           ▪     Enterprise value: $5.25 billion for Solenis,                                       ▪   Merger took place on May 1, 2019
     the acquisition of BASF’s pigments                                   which includes net debt of around                                                  ▪   Realization of synergies on track,
     business in August 2019                                              $2.5 billion                                                                           integration completed
▪    Purchase price of €1.15 billion1                               ▪     BASF holds 49% of the shares in Solenis;                                           ▪   Initial Public Offering planned beyond
▪    Closing took place on June 30, 2021                                  51% of the shares are held by Clayton,                                                 2021, subject to market conditions
                                                                          Dubilier & Rice and the Solenis
                                                                          management
                                                                    ▪     Closing of the transaction expected before
                                                                          the end of 20213

                                                           1   On a cash and debt-free basis
10    July 28, 2021 | Media Telephone Conference Q2 2021   2   Fiscal year ending September 30, 2020; 3 Following the approval of the relevant authorities
BASF Group Q2 2021 and H1 2021: Financial figures
Financial figures                                         Q2 2021     Change   H1 2021     Change
                                                          million €       %    million €       %
Sales                                                       19,753        56     39,153        33
EBITDA before special items                                  3,217       162      6,398        68
EBITDA                                                       3,199       199      6,375        82
EBIT before special items                                    2,355         .      4,676       151
EBIT                                                         2,316         .      4,627       205
Net income from shareholdings                                  -44        94         24         .
Net income                                                   1,654         .      3,372         .
Reported EPS                                                  1.80         .       3.67         .
Adjusted EPS                                                  2.03         .       4.03       167
Cash flows from operating activities                         2,537        13      2,012        66

11   July 28, 2021 | Media Telephone Conference Q2 2021
Cash flow development in Q2 2021 and H1 2021
                                                                  Q2 2021     Q2 2020     H1 2021     H1 2020
                                                                  million €   million €   million €   million €
 Cash flows from operating activities                                2,537       2,242       2,012       1,212
 Thereof Changes in net working capital                                  9       1,190      -2,764      -1,810
                Miscellaneous items                                      -9        880        -344         966
 Cash flows from investing activities                                  323        -705        -112      -2,525
                Payments made for property, plant and equipment
 Thereof                                                              -767        -726      -1,223      -1,295
                and intangible assets
                Acquisitions / divestitures                          1,125           –       1,118      -1,245
 Cash flows from financing activities                               -4,144         373      -3,434       4,667
 Thereof Changes in financial and similar liabilities                 -999       3,470        -282       7,799
                Dividends                                           -3,145      -3,100      -3,152      -3,136
 Free cash flow                                                      1,770       1,516        789          -83

12   July 28, 2021 | Media Telephone Conference Q2 2021
BASF’s plastic additives VALERASTM enable customers
to achieve their sustainability goals

                                                          ▪ To enable customers to achieve their sustainability goals, BASF has focused its sustainable
                                                            solutions for plastic additives under the new global brand VALERAS™:
                                                              - Use of bio feedstocks and renewable feedstocks
                                                              - Increased product carbon footprint transparency
                                                          ▪ VALERAS™ includes additive solutions that make a substantial sustainability contribution
                                                            to plastic applications. Examples:
                                                              - Irgastab® PUR 70 reduces VOC emissions in foams
                                                              - Tinuvin® NOR® 356 enhances biodiversity in plastic greenhouses
                                                              - Irgatec® CR 76 reduces energy consumption for production of PP nonwoven fibers
                                                          ▪ To help customers to reach global recycling targets (ranging from 25%-100% in packaging),
                                                            the portfolio will expand to include BASF’s additive packages for mechanically recycled
                                                            plastics and applications. Examples:
                                                              - Process stabilizers for rigid and flexible PP packaging
                                                              - UV light protection of recycled polyethylene and polypropylene
                                                              - Contaminant neutralizers for polyolefins

13   July 28, 2021 | Media Telephone Conference Q2 2021
Outlook 2021 for BASF Group

 Outlook 2021                                      revised forecast                            previous forecast
 Sales                                             €74 billion – €77 billion                   €68 billion – €71 billion
 EBIT before special items                         €7.0 billion – €7.5 billion                 €5.0 billion – €5.8 billion
 ROCE                                              12.1% – 12.9%                               9.2% – 11.0%
 Accelerator sales                                 €21 billion – €22 billion                   €19 billion – €20 billion
 CO2 emissions                                     20.5 – 21.5 million metric tons             20.5 – 21.5 million metric tons

Underlying assumptions for 2021 (previous assumptions in parentheses)
▪ Growth in gross domestic product: 5.5% (5.0%)
▪ Growth in industrial production:                           6.5% (5.0%)
▪ Growth in chemical production:                             6.5% (5.0%)
▪ Average euro/dollar exchange rate: $1.20 per euro ($1.18 per euro)
▪ Average annual oil price (Brent):                          $65 per barrel ($60 per barrel)

14   July 28, 2021 | Media Telephone Conference Q2 2021
You can also read