Nevada Drought Update - Living with Drought
←
→
Page content transcription
If your browser does not render page correctly, please read the page content below
Nevada Drought Update
Drafted: June 2-7, 2021
Prepared by: S. McAfee, State Climatologist

Current drought conditions in Nevada and across the West
Currently, all of Nevada is in drought (Fig. 1). Just over 40% of the state, mostly in the south and east,
is in D4 or Exceptional Drought and another almost 35% of the state is in D3 or Extreme Drought. These
are the deepest drought categories shown in the Drought Monitor, and the occurrence of either during
the growing season can trigger a FastTrack drought emergency declaration by the US Department of
Agriculture. Roughly 18% of the state is in D2 or Severe Drought. Eight or more weeks of D2 drought
during the growing season can also drive the USDA to issue a FastTrack drought emergency
declaration. All of Nevada’s counties have received a USDA Secretarial Disaster Designation for
drought. The remaining 6% of the state is in D1 or Moderate drought. The relatively mild drought
conditions are limited to northern Humboldt and Elko counties. Drought in Nevada is part of a larger
drought stretching across much of the western United States. The Southwest, the northern Great
Plains, California, Utah and western Colorado are all experiencing significant drought.

 Figure 1. US Drought Monitor map released on June 3, 2021, reflecting conditions as of June 1, 2021.

                                                                                                        1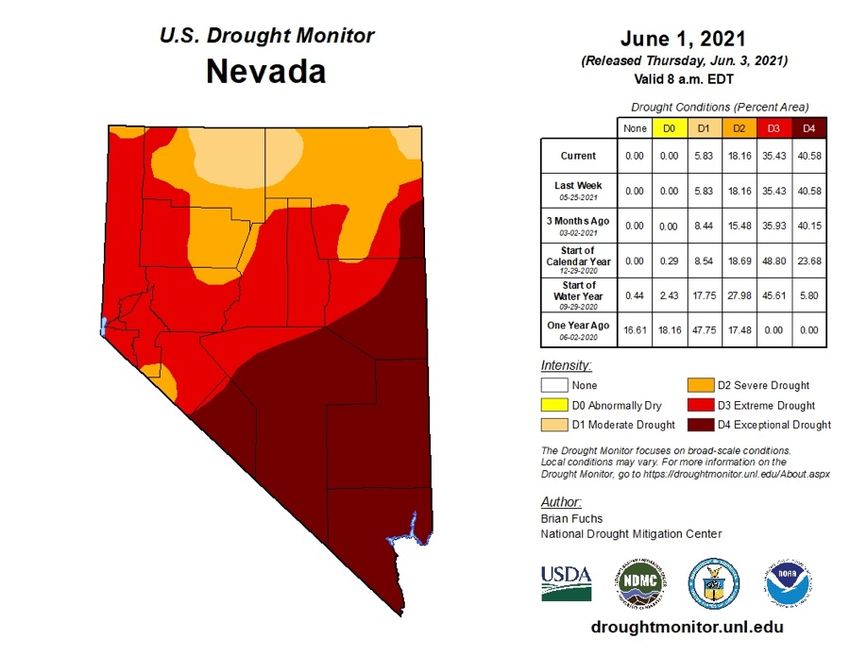
About the US Drought Monitor
The US Drought Monitor tracks the extent and severity of drought in the United States. Experts across
the country use weather and climate data, lake, stream, and reservoir levels, and information about the
health of natural vegetation and crops to evaluate drought conditions and report on them weekly. It is
the most comprehensive assessment of drought available in the United States. Despite its many
strengths, the Drought Monitor does have one key drawback. It presents drought information as a single
map each week, but not everyone experiences the same drought. For example, after a dry winter,
streams and reservoirs will often be low, but if it rains in the spring, some vegetation can still grow well.
S and L indicators on the Drought Monitor map show when there are differences between short- and
long-term drought conditions, and the written narrative provides more information about drought
characteristics, but there may still be situations where some sectors or individuals experience drought
more or less intensely than the Drought Monitor shows.

Water Resource Conditions
Reservoirs
Currently most reservoirs in Nevada are near or below their usual capacity for this time of year (Fig. 2).
Reservoir levels reflect both climatic conditions and management choices. The biggest news is that, by
the end of May, Lake Mead had fallen to 1,073.5 feet, below the 1,075 foot elevation that triggers the
implementation of shortage rules. The Natural Resources Conservation Service expects that more
water will evaporate from Lake Tahoe than will flow into the lake during the coming months, so water
levels might drop below the rim.

                                    Figure 2. Reservoir data are current as of June 1, 2021. Average refers to
                                    1981 - 2010. Source: https://www.wcc.nrcs.usda.gov/basin.html

                                                                                                                 2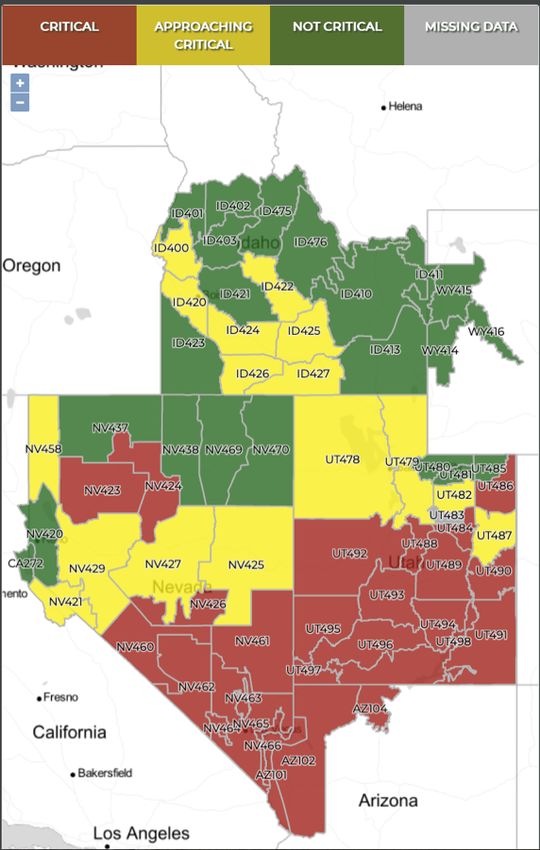
River and Streamflow
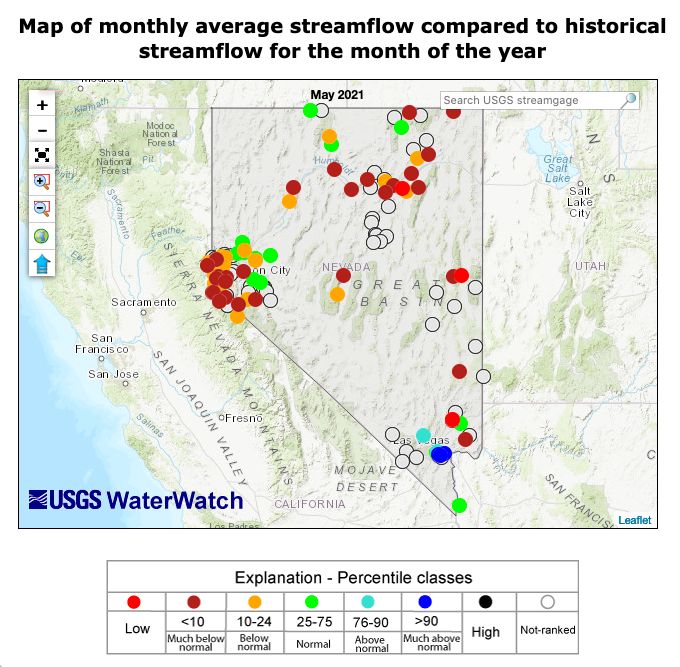
May streamflow was lower than
normal at most gaged stations
(Fig. 3). As reported by NWS
Reno, stream gages below dams
can report near-normal flow in dry
years because of reservoir
management.
Figure 3. Average May stream flow relative to normal seasonal conditions.
Source: https://waterwatch.usgs.gov/index.php?id=mv01d&sid=w__gmap&r=nv
Snowpack
By late May or early June, even high-elevation snowpack is usually low and waning. This year’s
snowpack, tracked by snow water equivalent (SWE), the amount of water stored in snow, is much lower
than normal, about 10 % of the median (Fig. 4).
Figure 4. Snow water equivalent at SNOTEL stations in Nevada and the eastern Sierra Nevada as of June
3, 2021. Source: https://www.nrcs.usda.gov/wps/portal/nrcs/detail/nv/snow/products/?cid=nrcseprd1685435
3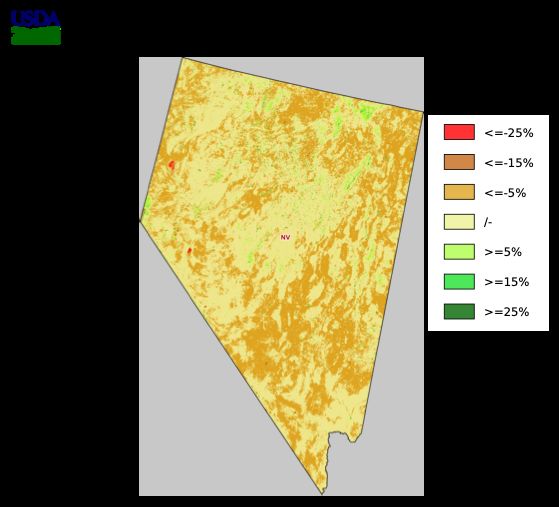
Soil moisture
Higher elevation soil moisture (measured at SNOTEL stations) is lower than normal and was at record
lows for much of the winter (Fig. 5), but the record is relatively short. Soil moisture has been measured
at Nevada SNOTEL stations only since 2006. New stations have been added regularly, so we now
have information from almost twice as many stations as in 2006. Low soil moisture stresses vegetation.
It also tends to limit the amount of streamflow generated when snow melts or during smaller rain events,
as that water moistens soils before reaching streams and rivers.
Figure 5. Soil moisture at SNOTEL stations in Nevada and the eastern Sierra Nevada as of June 3,
2021. Source: https://www.nrcs.usda.gov/wps/portal/nrcs/detail/nv/snow/products/?cid=nrcseprd1685435
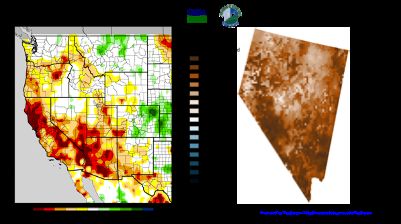
Broad-scale soil moisture estimates are made using models or remotely sensed information and they
don’t always agree perfectly. Nonetheless, many of the currently available products demonstrate drier
than normal soil conditions over much of Nevada and particularly southern Nevada (Fig. 6), which is
consistent with the very low precipitation that area has received.
Figure 6. Soil moisture anomalies from the (left) Surface Water Hydrology at UCLA and (right) NASA SMAP data.
Sources: http://www.hydro.ucla.edu/SurfaceWaterGroup/forecast/monitor/index.shtml,
https://nassgeo.csiss.gmu.edu/CropCASMA/.
4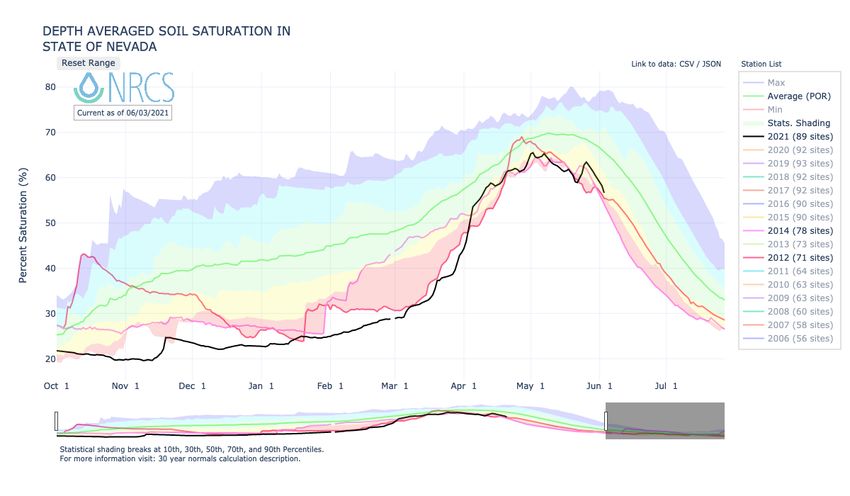
Vegetation Conditions
  Vegetation
  As with soil moisture, vegetation
  conditions are often monitored using
  remotely sensed products. The Mean
  Vegetation Condition Index, one of
  many indices, compares current
  vegetation conditions as measured by
  the Normalized Difference Vegetation
  Index (NDVI) to the usual NDVI for that
  time of year. Low values across much of
  the state show that vegetation in parts of
  Nevada is stressed (brown colors), but
  there are areas where vegetation
  appears to be in normal conditions for
  the time of year (Fig. 7).

                                                Figure 7. Mean Vegetation Condition Index for late May. Negative
                                                values in brown indicate places where vegetation is less robust
                                                than usual. Positive values in green where vegetation is doing
                                                better than usual. Source:
                                                https://nassge.csis.gmu.edu/CropCASMA/

                                               Fuel Moisture
                                               In much of Nevada, fuel moisture levels are very low. The
                                               Great Basin Coordination Center indicates critical and near
                                               critical conditions across most of the state (Fig. 8). When fuel
                                               moistures are low, fires can burn hotter and faster, making
                                               them more difficult to control.

                                               Impacts reported by Nevadans
                                               Dry conditions have caused problems for Nevadans. By
                                               summer of 2020, ranchers were reporting needing to haul
                                               water and purchase supplemental feed. Nevadans in rural
                                               and urban areas reported impacts on their yards,
                                               recreational activities and local wildlife. If you want to see
                                               individual reports, you can visit the 2020 and 2021 Condition
                                               Monitoring Observer Reports (CMOR) maps. Your
                                               observations of drought impacts are important. They help
                                               ensure that the Drought Monitor is accurately describing
Figure 8. Fuel moisture status in and around   drought and help us understand the impacts Nevadans are
Nevada as of June 6, 2021. Red and yellow      facing. You can (please do!) report your drought impacts at
indicate low fuel moisture. Source: https://   livingwithdrought.com.
gacc.nifc.gov/gbcc/predictive/cfs/#/

                                                                                                                   5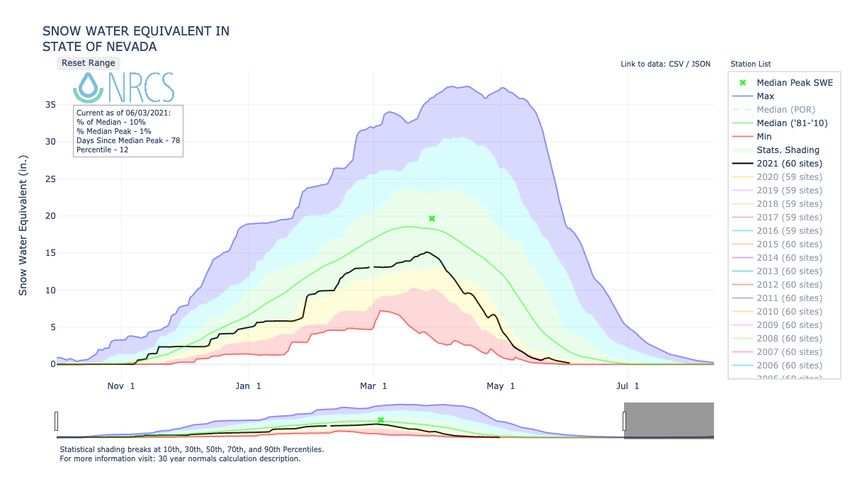
Figure 9. Percent of normal precipitation for the 2020 water year (left) and for the 2021 water year to-date (Oct -
May). Source: https://wrcc.dri.edu/wwdt/

How did this drought develop?
For most of the state, this is the second year of
below normal precipitation. During the 2020 water
year (Oct 1 2019 – Sep 30 2020), precipitation
was 30 – 70% of normal across most of the state
(Fig. 9). The abnormally wet spring over Clark
county was followed by extremely dry conditions
that began in April 2020 and continue to present.
The winter of 2020 – 2021 was also dry. While
spring rains have improved conditions in north-
central Nevada, the rest of the state has remained
dry. Southernmost Nevada has received less
than a third of the expected precipitation between
October 1 2020 and the end of May 2021.
        High temperatures made dry conditions
worse. Average temperatures last summer and
early fall (May – Oct 2020) were above normal
over essentially all of the state (Fig. 10). In some
places, temperatures were 3-4 °F degrees above
average for that time of year. High summer and
fall temperatures increased evaporation, drying
soils and drawing down reservoirs already Figure 10. Difference from normal temperature for May
impacted by lower than usual rain and snow - Oct 2020. Source: https://wrcc.dri.edu/wwdt/
amounts.

                                                                                                                      6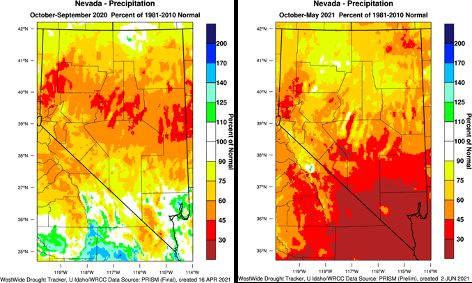
You can also read