Study of Z-R relationship among different topographies in Northern Thailand - IOPscience
←
→
Page content transcription
If your browser does not render page correctly, please read the page content below
Journal of Physics: Conference Series

PAPER • OPEN ACCESS

Study of Z-R relationship among different topographies in Northern
Thailand
To cite this article: N Auipong and P Trivej 2018 J. Phys.: Conf. Ser. 1144 012098

View the article online for updates and enhancements.

 This content was downloaded from IP address 46.4.80.155 on 27/11/2020 at 15:39

Siam Physics Congress 2018 (SPC2018) : A Creative Path to Sustainable Innovation IOP Publishing
IOP Conf. Series: Journal of Physics: Conf. Series 1144 (2018)
 1234567890 ‘’“” 012098 doi:10.1088/1742-6596/1144/1/012098

Study of Z-R relationship among different topographies
in Northern Thailand

 N Auipong and P Trivej
 Department of Earth Sciences, Faculty of Science, Kasetsart University

 E-mail: fscipntr@ku.ac.th

 Abstract. Topography can affect climate. Different topographies have different climates.
 Rainfall in each area varies by topography. Northern Thailand has been chosen as a study area
 due to its various topographies such as ridge, flat, plain and valley. This research studies
 reflectivity data and rainfall rate. Z-R relationship is a relationship between a radar reflectivity
 (Z) and a rainfall rate (R). Z-R relationship can be used to determine characteristics
 of precipitation and rainfall and can be applied in hydro-meteorological model to forecast
 the weathers. Data are from Omkoi Radar Station, covering the area of 240 kilometre around
 the station. Further, daily rainfall data have been gathered from Thai Meteorological Department.
 In this study, topographies are classified by Topography Position Index, showing highland, flat
 and valley. The results show that the empirical relations of rainfall rate and reflectivity measured
 by radar vary among different topographies which are highland, flat and valley, i.e. Z = 94R1.5,
 Z = 137R1.5 and Z = 143R1.5 respectively. The data indicates that if A parameter is low,
 the cloud is cumulonimbus. If value of A parameter is high, the cloud is nimbostratus.
 The variety of rain-cloud type and Z-R relationship also varies by topography.

1. Introduction
The rain is important for human in many ways, for example in agriculture, transportation, communication
and consumption. Too high or too low rainfall affect living things. Moreover, the different topography lead to
different rainfall. For weather radar rainfall estimation, consider relationship between the rainfall rate and
radar reflectivity called the Z-R relationship [1] as followed by equation (1):
 Z=ARb (1)
 Z is reflectivity (mm6m-3), R is rainfall rate (mmh-1), A and b are the relationship parameters which
depend on the raindrop number distribution and raindrop diameter. Study the A parameter of
the proposed Z-R relationship of cumulonimbus and nimbostratus rain-cloud. A value of cumulonimbus
is higher than those nimbostratus. The rainfall intensity of nimbostratus rain-cloud is lower than those
of cumulonimbus because the nimbostratus rain-cloud produces a larger amount of raindrop with smaller
diameters than the cumulonimbus rain-cloud. In this study, Northern part of Thailand has been chosen
as a study area due to various topographies such as ridge, flat, plain and valley. This area is covered
by an Omkoi radar station. The purpose of this research is to study the influence of topography on
the Z-R relationship.

 Content from this work may be used under the terms of the Creative Commons Attribution 3.0 licence. Any further distribution
 of this work must maintain attribution to the author(s) and the title of the work, journal citation and DOI.
Published under licence by IOP Publishing Ltd 1
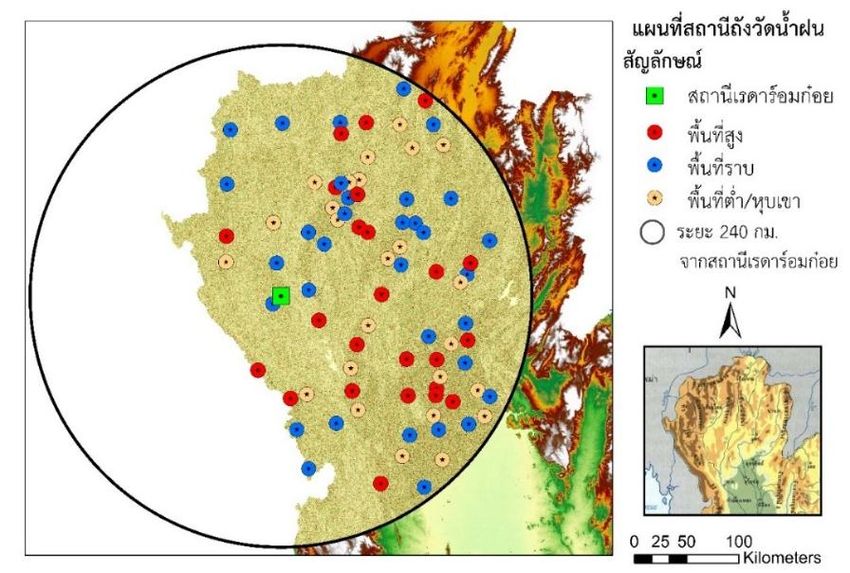
Siam Physics Congress 2018 (SPC2018) : A Creative Path to Sustainable Innovation IOP Publishing
IOP Conf. Series: Journal of Physics: Conf. Series 1144 (2018)
 1234567890 ‘’“” 012098 doi:10.1088/1742-6596/1144/1/012098

2. Methodology
Data collection has been gathered from Thailand Meteorological Department and Department of Royal
Rainmaking and Agriculture Aviation. Next step is the data processing including topographical
classification, Z-R Matching Techniques, and static analysis of rainfall each group. There are different
varieties of topography in the Northern part of Thailand. This area covered by mountain, plain, and
valley. The area is clearly different from other part of Thailand, it locates in Omkoi radar radius. Omkoi
radar station covers 240 kilometres radius covering Mae Hong son, Lampoon, Lampang, Prae,
Sukhothai, Chaingmai, Tak, Kamphaengphet, and some parts of Uttaradit, Chaingrai, Payao, Nan and
Pitsanulok. There are 82 gauge rainfall station around Northern part of Thailand but only 41 stations
are active for collection. The rainfall data and reflectivity data since January 2015 to December 2015.
Rainfall station were operated by Thai Meteorological Department (TMD) within the Omkoi radar
radius as represented in figure 1.

 Omkoi radar Station
 Highland
 Flat
 Valley
 240 km. from Omkoi Radar Station

 Figure 1. The Omkoi radar radius cover daily rainfall station in Northern Thailand.

 Finally, the data processing mainly consists of topographical classification by using GIS software
and topographic classification by location of rain gauge Z-R matching techniques

2.1 Topographic classification
Topographic classification by using geographic information system (GIS). The input data from a Digital
Elevation Model (DEM) has been collected a resolution of 30 x 30 m. To set topographic classify,
it depends on slope and topographic position index. The Topographic Position Index (TPI) is an
algorithm for classifying and comparing a cell elevation value and the divide elevation of
a neighbourhood around that cell. Negative TPI indicates that the location tends to be bottom of valley
while position. TPI indicates that locations tend to be top of a hill or ridge and TPI with nearly zero
indicates locations tend to be flat area or mid-slope area. In this study, land facet corridor designer tool
was used for creating 6-class TPI raster based on TPI standard deviation (SD). In this study, automate
topographic classification using criteria derived from GIS [2]. As with the TPI thresholds of each
classification, highland was distinguished using a TPI value of > + 1 SD, flat were used a TPI value between
of ≥ -0.5 SD and ≤ 0.5 SD using a threshold slope value of 5 ̊ and valley using TPI value of < -1.0 SD.
A full description of each topographic classification can be found [2-3]. The result showed in the Table 1
as follow:

 2
Siam Physics Congress 2018 (SPC2018) : A Creative Path to Sustainable Innovation IOP Publishing
IOP Conf. Series: Journal of Physics: Conf. Series 1144 (2018)
 1234567890 ‘’“” 012098 doi:10.1088/1742-6596/1144/1/012098

Table 1. Topographic classification in Northern part of Thailand (modified from [2-3]).

 Topography category Description In Combination with
 Highland Areas are mid TPI shallow slope Ridge & Upper Slope
 Flat Areas are lower than flat Middle Slope & Flat Slope
 and low TPI
 Valley Areas are lower slope Lower Slope & Valley
 and very low TPI
2.2 Z-R Matching Techniques
There are several Z-R matching techniques. In this study, Probability Matching Method (PMM),
was applied because it is well-understood. The matching is done between the cumulative distribution
function (CDFs) of Z value and R from rain gauge measurement [4] as described in equation (2).
P(R) is probability density function of rainfall from rain gauge measurement and P (Z) is the probability
density function of radar reflectivity values by radar [5], as equation (2):
 ∞ ∞
 ∫ ( ) R = ∫ ( ) Z (2)

3. Results
There are 385 events of Z-R pairs from PMM for highland, 423 events of Z-R pair from PMM for flat
and 316 events of Z-R pair from PMM for valley. b is fixed at 1.5 because b does not affect to RMSE,
and A is used in order to set least value of RMSE as shown in table 2.
 Table 2. Z-R pairs from Probability Matching Method (PMM).

 Group Event b parameter A parameter RMSE
 Highland 385 1.5 94 2.66
 Flat 423 1.5 137 5.49
 Valley 316 1.5 143 2.37

 The results show that the empirical relationship between rainfall rate and reflectivity measured by
radar varying between different topography which are highland, flat and valley for Z = 94R1.5,
Z = 137R1.5 and Z = 143R1.5 respectively. The A parameter obtained from the PMM method varies to
topography rain-cloud type. The A parameter presents Z-R relationship of rain-cloud type including
cumulonimbus and nimbostratus. Therefore, nimbostratus rain-cloud should be lower than
cumulonimbus for the similar reflectivity value. Because the nimbostratus produces a large amount
of droplets with small size and cumulonimbus produces a small amount of droplets with big size
as shown in equation of radar reflectivity factor as equation (3):
 = ∑ 6 (3)
 Where Z is rain are calculated assuming Rayleigh scattering of the same rainfall intensity,
D is diameter of droplets or size of droplets and N is numerical of droplets. Accordingly, when high
A parameter rain-cloud tend to be nimbostratus and less parameter A rain-cloud tend to be
cumulonimbus [6]. The summary of output in this study, the A parameter of highland is less than that
of flat and valley. So, rain-cloud type of highland tends to be cumulonimbus and rain-cloud type of flat
and valley tend to be nimbostratus.

 3
Siam Physics Congress 2018 (SPC2018) : A Creative Path to Sustainable Innovation IOP Publishing
IOP Conf. Series: Journal of Physics: Conf. Series 1144 (2018)
 1234567890 ‘’“” 012098 doi:10.1088/1742-6596/1144/1/012098

 Highland Flat Valley

 35
 rainfall (N)(N)
 ofRAINFALL 30
 25
 20
 FrequencyOF

 15
 FREQUENCY

 10
 5
 0
 0 10 20 30 40 50
 AMOUNT
 Amount OF RAINFALL
 of rainfall (mm.) (MM.)

 Figure 2. The amount of rainfall in one day of study area.
 From figure 2, adjust value of rainfall measured on different scale to standard common scale.
Rainfall in three parts was analysed and it was found that in the valley there was more rainfall than
highland in period 0.5 mm. Although in the beginning of the data collecting day it rained heavier in flat
and valley rather than highland, but when analysing the amount of rain in whole day, highland have
heavy rain more than other areas.

4. Discussion and Conclusion
The study on Z-R relationship among difference topographies. Found that if value of A parameter
is low, the cloud is cumulonimbus. If value of A parameter is high, the cloud is nimbostratus. The variety
of rain-cloud types and Z-R relationship also varies by topography. However, it should be considered
other criteria i.e. season, latitude, longitude, prevailing wind, or other criteria of interest. The result from
this study will be useful for observing the behaviour and detailed structure of rainfall events. Individual
rainfall events and rain-cloud type can then be used as the input data for hydro-meteorological model
and run-off model and flood estimation.

Acknowledgments
The authors are grateful to Department of Royal Rainmaking and Agriculture Aviation (DRRAA)
for providing the weather radar data, Thai Metrological Department (TMD) for the rain gauge data
for use in this study. Special thank goes to the proof readers throughout the research: Dr. Natthapong
Monarumit, and Mr. Manoch Lakkham.

References
[1] Mapiam P and Sriwongsitanon N 2008 SCIENCE ASIA 34 215-22
[2] Jones K B, Heggern D T, Wade T G, Neal A C, Ebert D W, Nash M S, Mahaffey M H,
 Goodman I A, Hermann K A, Selle A R, Bolgrien D, Augustine S, Pedersen J, Lin C J,
 Vixger J M, Ciang D, Zhang Y, Baker J and Van Remorter R D 2000 Environ. Monit.
 Assess. 64 227-45
[3] Jenness J 2005 Topographic Position Index (tpi_jen.avx) Extension for ArcView 3.x Jenness
 Enterprises. http://www.jennessent.com
[4] Tantanee S and Prakarnrat S 2008 WSEAS 3 304-13
[5] Piman T, Babel M S, Das Gupta A and Weesakul S 2007 Hydrol. Earth Syst. Sci. 11 1361-72
[6] Chumchean S, Aungsuratana P, Khommoang A and Hanchoowong R 2009 18th
 World IMACS/MODSIM Congress congress (Cairns: Australis) pp 3682-89

 4
You can also read