Validation of INSAT-3D Derived Rainfall - Suman Goyal, Satellite Meteorology Division, India Meteorological Department ...
←
→
Page content transcription
If your browser does not render page correctly, please read the page content below
Validation of INSAT-3D Derived
                  Rainfall

           Suman Goyal,
  Satellite Meteorology Division,
India Meteorological Department,
     suman.imd@gmail.com
   suman_goyal61@yahoo.co.in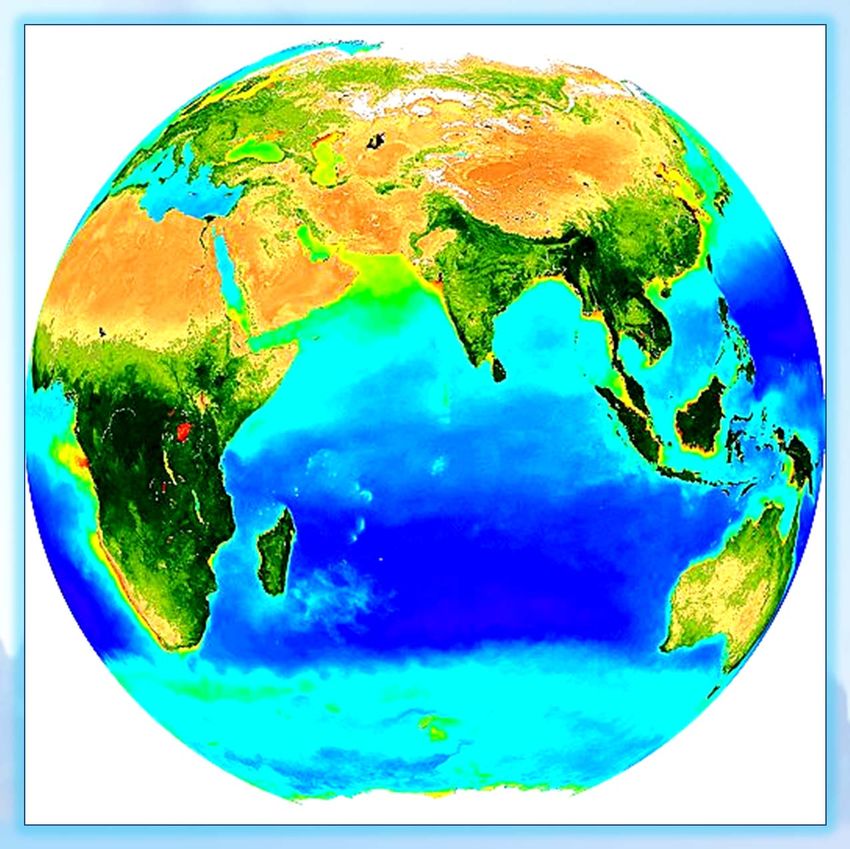
Locations of
Indian Geostationary Meteorological Satellites

                   74o              93.5o
                            82o

       Kalpana-1                      INSAT-3A
                         INSAT-3D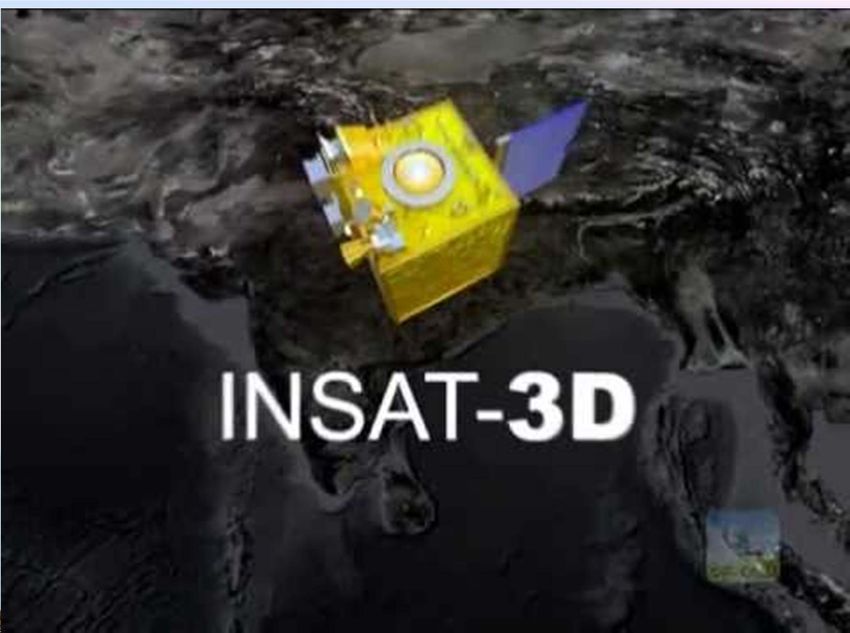
INTRODUCTION
India’s geo-stationary satellites
Kalpana-1
INSAT-3A
INSAT-3D
Satellite imageries & products are used to
analyses and forecast
Channels used in Satellite
Kalpana‐I                Channels       Spectral Range     Resolution
                         Visible           0.55 - 0.75 µ       2 Km.
             (i) VHRR
                         Infrared          10.5 - 12.5 µ       8 Km.
                         Water Vapour       5.7 - 7.1 µ        8 Km.

INSAT‐3A                Channels        Spectral Range     Resolution
                        Visible           0.55 - 0.75 µ        2 Km.
            (i) VHRR Infrared             10.5 - 12.5 µ        8 Km.
                        Water Vapour       5.7 - 7.1 µ         8 Km.
                        Channels        Spectral Range     Resolution
                        Visible           0.63 - 0.69 µ        1 Km.
            (ii) CCD
                        NIR               0.77 - 0.86 µ        1 Km.
                        SWIR              1.55 - 1.69 µ        1 Km.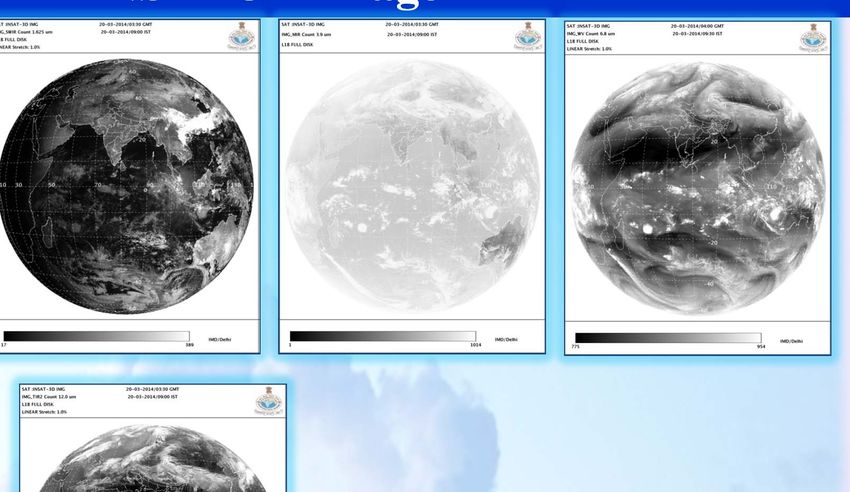

INSAT-3D launched on July 26, 2013

     Payloads on INSAT-3D Satellite
         1. Six Channel Imager
         2. 19 Channel Sounder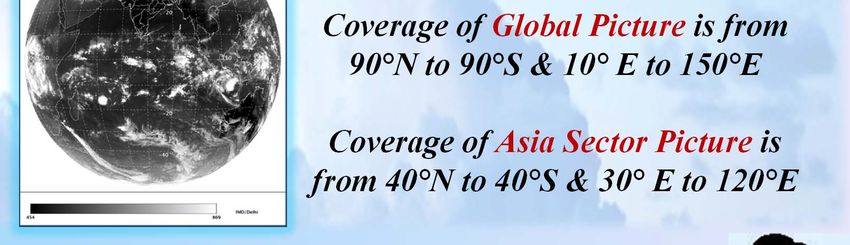
INSAT-3D Imager Channels
Channel no. Spectral Band Spectrum (μm)     Ground
                                           Resolution
                                              (km)
    1           VIS          0.55 – 0.75      1x1
    2          SWIR          1.55 – 1.70     1x1

    3           MIR          3.80 – 4.00     4 X4

    4           WV           6.50 – 7.10     8x8

    5           TIR1         10.2 – 11.3     4x4

    6           TIR2         11.5 – 12.5     4x4
INSAT-3D Imager

Visible 0.65 µm   SWIR 1.625 µm    MIR 3.9 µm            WV 6.8 µm

                                  Coverage of Global Picture is from
                                   90°N to 90°S & 10° E to 150°E

                                   Coverage of Asia Sector Picture is
                                  from 40°N to 40°S & 30° E to 120°E
 TIR1 10.8 µm      TIR2 12.0 µm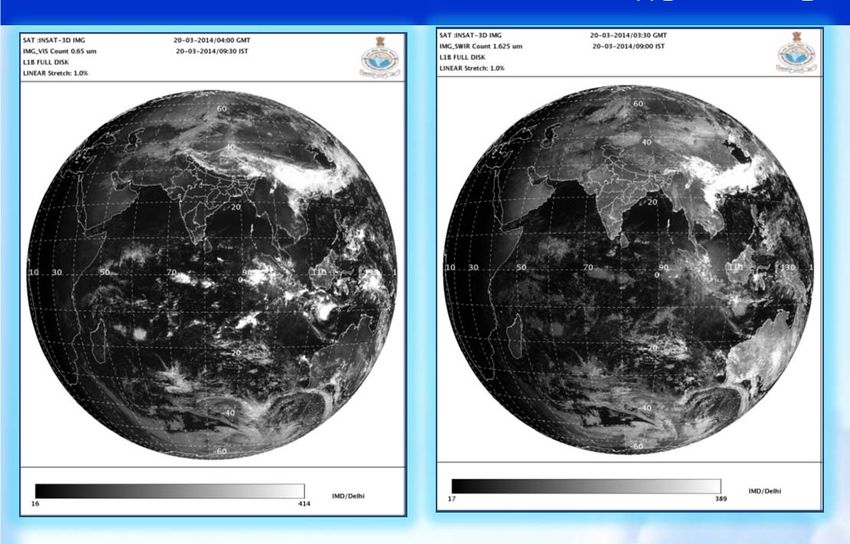
INSAT-3D Sounder Channels Characteristics
c c NET Principal
Detector Ch. No. Purpose
(m) (cm-1) @300K absorbing gas
1 14.67 682 0.17 CO2 Stratosphere temperature
2 14.32 699 0.16 CO2 Tropopause temperature
3 14.04 712 0.15 CO2 Upper-level temperature
Long wave 4 13.64 733 0.12 CO2 Mid-level temperature
5 13.32 751 0.12 CO2 Low-level temperature
6 12.62 793 0.07 water vapor Total precipitable water
7 11.99 834 0.05 water vapor Surface temp., moisture
8 11.04 906 0.05 window Surface temperature
9 9.72 1029 0.10 ozone Total ozone
Mid wave 10 7.44 1344 0.05 water vapor Low-level moisture
11 7.03 1422 0.05 water vapor Mid-level moisture
12 6.53 1531 0.10 water vapor Upper-level moisture
13 4.58 2184 0.05 N2O Low-level temperature
14 4.53 2209 0.05 N2O Mid-level temperature
15 4.46 2241 0.05 CO2 Upper-level temperature
Short wave
16 4.13 2420 0.05 CO2 Boundary-level temp.
17 3.98 2510 0.05 window Surface temperature
18 3.76 2658 0.05 window Surface temp., moisture
Visible 19 0.695 14367 - visible Cloud
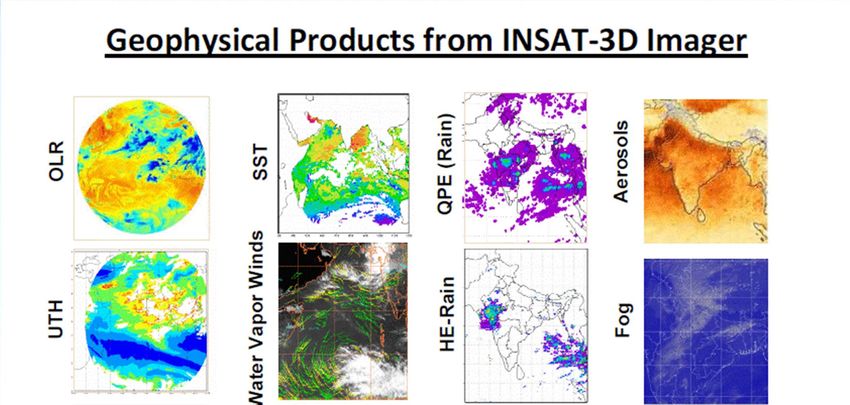
INSAT-3D Data Products (IMAGER)
Product                                  Channels         Temporal       Spatial           Region
                                                          Resolution    Resolution
Outgoing long wave radiations     TIR-1, TIR-2, WV        Half Hourly    Per Pixel     Global Coverage

Quantitative Precipitation (H-E) TIR-1, TIR-2, WV         Half Hourly    Per Pixel     Global Coverage

Quantitative Precipitation       TIR-1, TIR-2, WV         Half Hourly    0.1º X 0.1º     Asia Sector
(IMSRA)
Quantitative Precipitation (GPI) TIR-1, TIR-2, WV         Half Hourly     1º X 1º        Asia Sector

Upper Tropospheric Humidity       TIR-1, TIR-2, WV        Half Hourly    Per Pixel     Global Coverage
(UTH)
Sea Surface Temperature (SST)     SWIR, TIR-1, TIR-2, MIR Half Hourly   0.5º X 0.5º    Global Coverage

Fog                               SWIR, MIR, TIR-1, TIR-2, Half Hourly    Per Pixel       Asia Sector
Snow                              VIS, SWIR, TIR-1, TIR-2 Half Hourly     Per Pixel       Asia Sector
Cloud Mask                        MIR, TIR-1, TIR-2,       Half Hourly    Per Pixel    Global Coverage
Fire                              MIR, TIR-1               Half Hourly      Point      Global Coverage
Smoke                             VIS, MIR, TIR-1, TIR-2   Half Hourly      Point        Asia Sector
Aerosol                           VIS, TIR-1, TIR-2        Half Hourly   0.1º X 0.1º      Asia Sector
Cloud Motion Vector               VIS, TIR-1, TIR-2        Half Hourly      Point         Asia Sector
Water Vapour Winds                WV, TIR-1, TIR-2         Half Hourly      Point         Asia Sector
             All the data are disseminated to IMD website all users and research agencies,
                                         JPEG & HDF-5 format
INSAT-3D Data Products (SOUNDER)
Products Temporal Spatial Region
Resolution Resolution
Mean Surface Pressure Hourly 3 X 3 Pixel
Mean Surface Elevation Hourly 3 X 3 Pixel
Temperature Profiles (Reg Retrieval) Hourly 3 X 3 Pixel
Surface Skin Temperature (Reg Retrieval) Hourly 3 X 3 Pixel
WV Profiles (Phy Retrieval) Hourly 3 X 3 Pixel
Surface Skin Temperature (Phy Retrieval) Hourly 3 X 3 Pixel
Total Ozone Hourly 3 X 3 Pixel
Forecast Skin Temperature Hourly 3 X 3 Pixel
Forecast Surface Humidity Hourly 3 X 3 Pixel
Geo Potential Height (40 pressure level) Hourly 3 X 3 Pixel
Total Perceptible Water (1000-900 hPa) Hourly 3 X 3 Pixel
Lifted Index, Wind Index Dry, Microburst Hourly 3 X 3 Pixel
Index
Maximum Vertical Theta Hourly 3 X 3 Pixel
All the data are disseminated to IMD website all users and research agencies,
JPEG & HDF-5 formatINSAT 3D Products
Rainfall Estimation
QPE ‐ 3 hourly INSAT Multispectral Rainfall Hydro Estimator ‐ half
‐ half hourly hourly
Tropical Cyclone - NanaukINSAT MULTISPECTRAL RAINFALL ALGORITHM
• INSAT Multispectral Rainfall Algorithm (IMSRA) has been operationally
providing precipitation estimates from IMD using INSAT-3D (from 2014
onwards) measurements.
• Further refinements by merging IMD rain gauge data are proposed in the
existing scheme
• The merged rainfall estimates show noticeable improvement over the
satellite-based rainfall estimates and in-situ alone measurements over
various parts of India.
• The currently updated version of IMSRA is now is being made
operational at IMD for dissemination to the users.Flow Chart for IMSRA Algorithm
INSAT TIR, WV Data
3 Hourly
Look Up Table for
Conversion from Calibration
Grey Count to TBs
Grid Average of
IR TBs (0.10x0.10)
Collocation of IR
TBs and TRMM/
SSM/I Rainfall
IR and WV - Cloud
Classification
Estimation of
Rainfall
Rainfall Validation/ Fine
Tuning (DWR/SFRG)
Corrected Rainfall
Final Rain Rate, Daily, Pentad,
Estimation
monthly & Seasonal Rainfall3B42RT Daily Rain
Examples of IMD and SAC‐INSAT‐3D Rainfall in Indian
           Meteorological Sub‐Divisions
                                INSAT-3D– IMSRA Weekly Rainfall (mm)
                                        for 31 July to 6 Aug’14
Improved IMSRA Algorithm Scheme
Kalpana‐1/INSAT‐3D Rainfall from
                          Modified Algorithm
GB-Global Bias Correction
CG-Cloud Growth
Correction
RC-Regional Correction

                            Error is reduced by 30% after the corrections in daily rain
Examples of INSAT-3D Rainfall from Modified Algorithm
Merged Rainfall from INSAT-3D and GPM-GMI

      IMSRA Rain                                      GPM Rain

MERGED Rainfall
(IMSRA+GPM)
Grid wise correlation and RMSE of IMSRA with IMD actual rainfall
HYDRO-ESTIMATOR The HE is an operational algorithm for estimating rainfall rate from Thermal Infrared (TIR1) window (10.8 µm) brightness temperatures (Tb). It is a INSAT-3D based high resolution rain estimation method which combines NCEP model parameters with satellite observations The Hydro-Estimator developed at SAC is based on similar operational method at NOAA/STAR In IMD the H-E technique provides rain rate at each pixel with every acquisition of the satellite data (presently, 4x4 km2 and 30 minutes for INSAT-3D). The procedure and coefficients are adopted from H-E method developed by NOAA/STAR.
Input Data:
INSAT- 3D TIR-1 – image data, geolocation and calibration files
1.
Dynamic data
2. NCEP GFS Model derived U and V wind components.
3. NCEP GFS Model derived T and RH profiles
4. NCEP GFS Model derived RH
5. NCEP GFS Model derived TPW
6. Topography Data (Static data) – 2’x2’ grided (ETOPO2)
Output:
1. Rain rate at each pixel with geolocation.
2. Corresponding Image file (jpeg) generated.
H‐E Rain Product and Intense Rain Product operationally hosted on
www.imd.gov.inEquilibrium level correction:
Tb obtained is higher than expected
Equilibrium level is computed using an atmospheric theromodynamic
model
Correction is applied if Tb > 213 K
Maximum correction is 25 K
Orographic Correction:
Orographic Correction is calculated using slope in the direction of 850 mb
wind
positive slope reduce the Tb whereas negative slope enhance
(Vicente G A, 1998, IJRS, 23, pp. 221‐230)Hydro-Estimator (Simplified block diagram)
PW3 Tb 10.7 m Tb 10.7 m
RH3
Oro2 Tbeff Equilibrium level (EL)
correction to Tb 1
EL1
Tbmin, mean, SD Orographic Correction2
Z
PW correction 3
1. Through thermodynamic model
Core Rain (Rc) through function fit 4 2. Through earth elevation model and 850 mb wind
3. Through NWP model fields
Non-core rain (Rn) 5 4. Rc = a exp(-bTb1.2); by function fit with Rc=0.5
mm/h at 240 K and PW dependent Rc at 210 K
If ZHydro-Estimator rain associated with Tropical Cyclone Phailin
State average
Surface: 110.1 mm
H-E rain: 120.82 mm
12-14 Oct 2013
TRMM 3B42RT: 60 mm
CPC: 180 mmMajor Drawback
Kalpana-1 H-E could not captured the Uttarakhand Disaster
Uttarakhand Disaster: A multi day cloud burst and massive continuous rainfall centered on
the state Uttarakhand (India) caused devastating floods and landslides on 15th -18th June 2013
6,000 people were dead, 10,000 were injured, 100,000 stuck in valley
400 houses were destroyed, 265 were damaged.
It is considered to be largest
natural disaster after Tsunami
occurred in 2004 in India
Major Drawback
Orographic rain severely underestimated
Intense rain over Uttrakhand in 2013527
117 273 432
585
333 585
99
23 160
127 270
55
UTTARKASHI 527.00
CHAMOLI 460.58 Uttrakhand: IMD: 322 mm
DEHRADUN 117.25
H-E: 316 mm
TEHRI-GARHWAL 273.50
RUDRAPRAYAG 432.70
PITHORAGARH 585.40
GARHWAL 99.10 J & K Floods September 2014
BAGESHWAR 333.45
HARDWAR 23.00 Week ending on 10 Sep. 2014
ALMORA 160.41
NAINITAL 127.11
CHAMPAWAT 270.06 IMD WWR Rain: 267.7 mm
UDHAM-SINGH-NAGAR 55.44 H‐E Rain : 245.78 mm
STATE AVERAGE: 316.15 mm/h 3B42 rain : 95.33 mmComparison of daily 0.25o rain in met-subdivisions.
Validation of H-E with IMD actual rainfall
Chennai Rain on 01 December 2015
IMERG Rainfall                  3B42RT Rainfall
Conclusions
Hydro-Estimator
Hydro-Estimator is providing rain satisfactorily over Indian region.
Modifications in HE are able to provide more accurate rain over hilly terrains.
IMSRA
o IMSRA: Overall results reveal that the synergistic use of satellite and in situ
observations has potential for producing operationally more accurate rainfall over
the Indian monsoon region. The currently updated version of IMSRA now is being
made operational at both IMD and MOSDAC.
o In future we plan to also include GPM rainfall getting integrated in IMSRA
rainfall.
Future Plans
There are two rainfall products, we have to see which one is better. So,
merged rainfall will be prepared on that
Validation of the rainfall product should be automatic.RAPID
http://rapid.imd.gov.in/Future Satellites
2016 2017 2018 2019 2020 2021 2022 2023 2024
INSAT‐3D Launched in 2013 and Operational
INSAT‐3DR
INSAT‐3DS
GISAT
Adv. GISAT
SCATSAT
Oceansat‐IIITHANK YOU
HYDRO-ESTIMATOR

•   Auto-Estimator
              R = a exp(-bTb12)                                      Regression Coefficients
                                                                         a= 1.1183*1011
                                                                         b=0.036382
Convective Core rain precipitation referred as Rc
                    Rn = (250-Tb)* Rmax/5

          Non-Convective Core
                    Z= (Tmean – Tb)/σ
    The minimum and maximum allowable value of Z are 0 and 1.5.
    If Z < 0; H-E rain (R) = 0, i.e., pixel either cirrus or inactive convective
HYDRO-ESTIMATOR R = [Rc*Z2 + Rn * (1.5 - Z)2] / [Z2 + (1.5 - Z)2]
You can also read