Documentation for the Global Annual Average PM2.5 Grids from MODIS and MISR Aerosol Optical Depth (AOD), 2001-2010
←
→
Page content transcription
If your browser does not render page correctly, please read the page content below
Documentation for the Global Annual Average PM2.5 Grids from MODIS
           and MISR Aerosol Optical Depth (AOD), 2001–2010

      Data Set Disseminated by the NASA Socioeconomic Data and Applications Center (SEDAC)
           http://sedac.ciesin.columbia.edu/data/set/sdei-global-annual-avg-pm2-5-2001-2010

Data Set Motivation and Methods

This data set was inspired by work by van Donkelaar et al. (2010), who generated a global, satellite-
derived, annual average PM2.5 surface for the years 2001-2006 based on level 2 (L2), daily Moderate
Resolution Imaging Spectroradiometer (MODIS) and Multi-angle Imaging SpectroRadiometer (MISR)
satellite instrument Aerosol Optical Depth (AOD) (Figure 1). The geographic coverage of the van
Donkelaar et al. (2010) dataset is nearly global with a horizontal resolution of 0.1° x 0.1°. Coincident
aerosol vertical profiles from the GEOS-Chem chemical transport model, validated with CALIPSO space-
borne lidar vertical profiles, were used to calculate daily conversion factors that account for the
relationship between satellite column AOD and surface PM2.5 concentrations. The AOD-PM2.5
relationship varies spatially and temporally due to global and seasonal variations in aerosol size, aerosol
type, relative humidity, and boundary layer height. The conversion factors were applied by van Donkelaar
et al. (2010) to the MODIS/MISR AOD data to estimate surface-level PM2.5 concentrations, measured in
micro-grams per cubic meter (µg/m3).

Figure 1. Satellite-derived annual average surface-level PM2.5 concentrations, 2001–2006, from Method 1 (van Donkelaar
                                                       et al. 2010).

While contributing significantly to applied research on satellite-based estimates of PM2.5 worldwide, van
Donkelaar’s methodology is computationally expensive. To reduce the computational burden and
overcome the barrier of difficulty in using satellite data regular monitoring, researchers Erica Zell and
Stephanie Weber of Battelle Memorial Institute developed a method to leverage the AOD/PM2.5 surface
level conversion factors calculated by van Donkelaar et al. (2010) and apply them to gridded, monthly
AOD data from MODIS and MISR from 2001 to 2010. This method requires comparatively little
processing, based on continually updated satellite observations of AOD with higher degrees of processing
(so-called level 3 data), with the goal of better tracking temporal trends in PM2.5 concentrations.

                                                                                                               Page 1
Several processing steps were required to apply the AOD/PM2.5 surface level conversion factors to the
MODIS and MISR data. The MODIS level 3 (L3) monthly data were re-mapped from 1° x 1° to a 0.5° x
0.5° grid to match the native resolution of the MISR L3 monthly data. MODIS and MISR data were then
excluded from grid cell locations within a given surface-albedo class that had an anticipated bias greater
than the larger of ± (0.1 or 20%) for a month, based on comparison with Aerosol Robotic Network
(AERONET; Holben et al. 1998) sun photometer measurements of AOD as conducted by van Donkelaar
et al. (2010). The AOD within a grid cell was excluded only if all of the 0.1° x 0.1° bias filter grid cells
that fell within the 0.5° x 0.5° AOD cell met the exclusion criteria. This filter was generated separately for
MODIS and MISR because these instruments have independent spatial and temporal biases based on
instrument mechanisms and processing algorithms. The remaining data were averaged for each month
across three year rolling periods from 2001 to 2010 (i.e., 2001 through 2003, 2002 through 2004,
etc.). For each of these three year periods, an annual-average, estimated PM2.5 concentration, E, for each
grid cell, i, was calculated by multiplying the MODIS and MISR mean AOD for each month, , by
the monthly conversion factor, , as in Equation 1.
∑
(Equation 1)
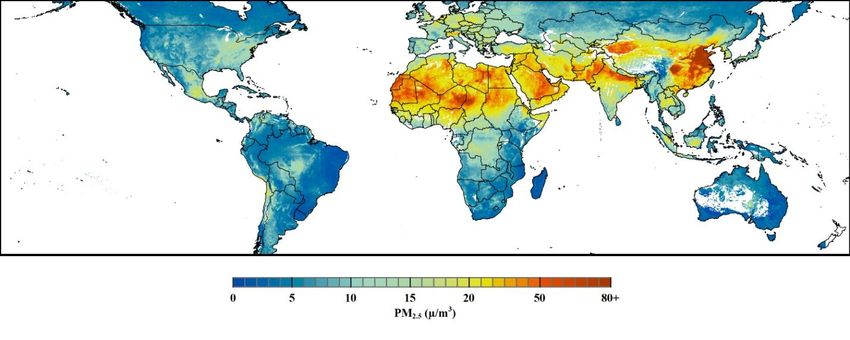
Figure 2 shows an example of the estimated PM2.5 surface for the years 2001–2003.
Figure 2. Global, satellite-derived PM2.5 based on MODIS L3 monthly means averaged over 2001–2003.
The bias filter and the conversion factors applied in this method were based on data from 2001–2006 (van
Donkelaar et al. 2010), but were treated as constants over 2001–2010 in order to reduce computational
complexity. These conversion factors could be updated as new analyses are generated, but since these
factors largely depend on land surface type and monthly-averaged meteorological parameters, it is not
anticipated that these factors would change much over short time periods. For the purposes of this study,
the conversion factors that were use were based on relative humidity of 50%. Three-year rolling averages
(within 2001 to 2010) were utilized in order to emphasize lasting changes in PM2.5 concentrations likely
reflective of emissions changes (which is of policy interest), rather than using annual averages that may
be heavily influenced by annual weather variability (e.g., a particularly strong El Nino year).
Note that comparisons of population-weighted country-level estimates of PM2.5 concentrations based on
grids produced by van Donkelaar et al. and those developed for this project (Battelle/CIESIN) suggest a
systematic bias over certain regions. For countries in the Sahel, North Africa, and the Arabian Peninsula
(largely arid and semi-arid countries with large desert areas), the population-weighted estimates of PM2.5
Page 2concentrations from van Donkelaar et al.’s data set were consistently higher than for those by
Battelle/CIESIN. For India, results from Battelle/CIESIN were higher than those for van Donkelaar et al.
The reasons for these differences are unclear. There are a number of possible explanations, including the
difficulties in MODIS AOD retrievals over sandy surfaces (which, however, should affect both
estimates), or differences between Level 2 and Level 3 data in combined AOD values, or the application
of conversion factors on a daily basis vs. monthly, which would mean that the Battelle/CIESIN data set
may be missing peaks in PM2.5 concentration.
Acknowledgments
Development of this data set was supported by NASA Research Opportunities in Space and Earth
Sciences (ROSES) grant number NNX09AR72G to the Center for International Earth Science
Information Network (CIESIN) and Battelle Memorial Institute for a project entitled “Using Satellite
Data to Develop Environmental Indicators: An application of NASA Data Products to Support High
Level Decisions for National and International Environmental Protection.” Distribution of this data set
was supported by NASA Contract NNG08HZ11C for the continued operation of the Socioeconomic Data
and Applications Center (SEDAC), which is managed by CIESIN.
References
van Donkelaar, A., R. V. Martin, M. Brauer, R. Kahn, R. Levy, C. Verduzco, and P. J. Villeneuve. 2010.
Global Estimates of Exposure to Fine Particulate Matter Concentrations from Satellite-based Aerosol
Optical Depth. Environmental Health Perspectives 118(6): 847–588. doi:10.1289/ehp.0901623.
Page 3Technical Annex
File Information
Each file contains integer values for a global, 0.5° x 0.5° grid of estimated PM2.5 concentrations.
Scale Factor: In order to avoid values to the right of the decimal place, all PM2.5 concentrations in
micrograms per cubic meter are multiplied by 1,000
ASCII Raster Header Information:
ncols 720
nrows 360
xllcorner -180
yllcorner -90
cellsize 0.5
NODATA_value -9999
Satellite Data Sources
MODIS AOD
o Product: MOD08 – Level 3 Global Monthly Mean Aerosol Optical Depth
Satellite: Terra
SDS: “Optical_Depth_Land_And_Ocean_Mean_Mean”
Version: 5.1
Resolution: 1° x 1°
Years: 2001 – 2010
Source: NASA LAADS (http://ladsweb.nascom.nasa.gov/)
MISR AOD
o Product: MIL3AE – Level 3 Global Monthly Mean Aerosol Optical Depth
Satellite: Terra
SDS: "Optical depth average"
Version: F15_0031
Resolution: 0.5° x 0.5°
Years: 2001 – 2010
Source: NASA Langley ASDC (http://eosweb.larc.nasa.gov/)
Summary Methods
Global, monthly-mean MODIS and MISR AOD data for the years 2001–2010 were acquired from the
sources listed above. The MODIS data were disaggregated from 1° resolution to 0.5° resolution to match
the resolution of the MISR AOD data. AOD for both instruments that were anticipated to have a bias of
greater than ±(0.1 or 20%) as compared to ground-based AERONET AOD due to high surface albedos or
other persistent factors were removed from the analysis (see supplemental material for van Donkelaar et
al., 2010). The filtered MODIS and MISR data were then combined by taking the mean of each grid cell
for each month of the year.
Page 4Ground-level concentrations of dry 24 h PM2.5 (in μg/m3) were estimated from the satellite observations
of total-column AOD by applying a conversion factor that accounts for the spatial and temporal
relationship between the two. This conversion factor is a function of aerosol size, aerosol type, diurnal
variation, relative humidity and the vertical structure of aerosol extinction, which were derived from a
global 3-D chemical transport model (GEOS-Chem) and assumes a relative humidity of 50% (see
supplemental material for van Donkelaar et al., 2010). The satellite AOD data were multiplied by
monthly-mean conversion factors (calculated as a climatological mean over 2001–2006) for each grid
cell.
Finally, an annual-average estimated surface PM2.5 concentration was estimated by taking the mean of
the monthly estimates over each year.
Page 5You can also read