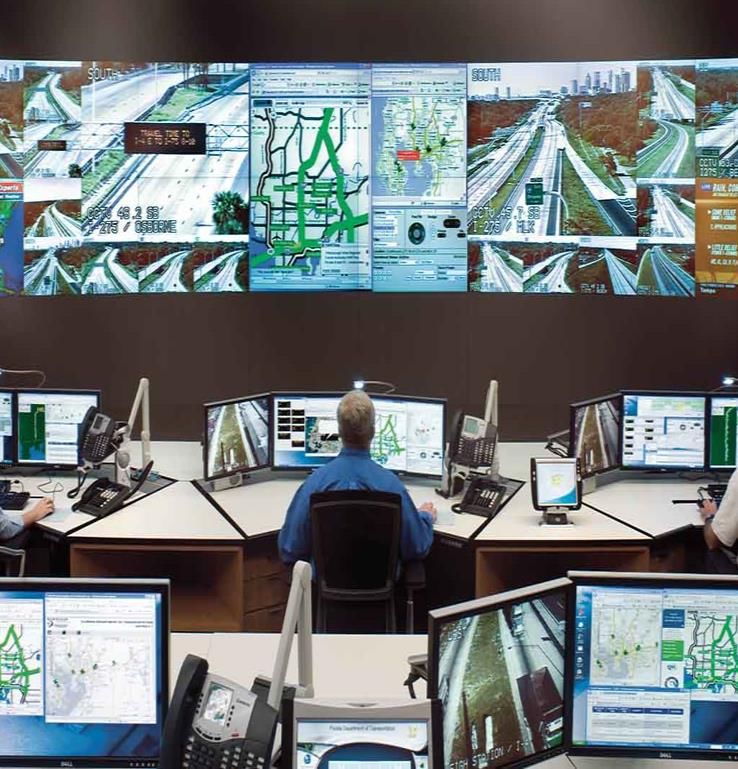
Role of TSM&O in Improving Freeway Operations - Presented by: Priyanka Alluri, Ph.D., P.E.
←
→
Page content transcription
If your browser does not render page correctly, please read the page content below
Role of TSM&O in Improving Freeway Operations

 Presented by:
 Priyanka Alluri, Ph.D., P.E.
 Associate Professor
 Florida International University

 1
 September 10, 2019
Presentation Outline
1 What is TSM&O?

2 Need for TSM&O

3 Ramp Meters

4 Dynamic Message Signs

5 Express Lanes
 2
What is TSM&O?
 Processes, procedures,
 Achieve the Safety & policies, and agreements
 Mobility Goals of the TSM&O
 Agency!
 to use the technology

 Safety
 Traffic engineering &
 principles and Mobility
 practices Technologies
 Traffic Ops ITS

 3

Conventional Improvements vs. TSM&O Strategies

 Lets add more lanes!! Lets invest in Express Lanes!

 4
Proactive TSM&O Strategies

 Lets add more lanes!!

 Lets deploy ramp meters!

 With Ramp Metering Signals

 5
Proactive TSM&O Strategies
 Drivers may detour after
 Dynamic Message Sign reading the message
 informing drivers about
 the crash downstream

 6
TSM&O Strategies are …
 Integrated Performance Based At All Stages Multimodal

 7
TSM&O Strategies are …
 Integrated Performance Based At All Stages Multimodal

 Average travel time
 Travel time reliability

Incident response & clearance time

 Total travel delays

 Crashes

 Secondary crashes

 8

TSM&O Strategies are …
 Integrated Performance Based At All Stages Multimodal

 Project Operations
 Planning
 Development

 Concept
 Potential Strategies
 Development Performance
 Monitoring
 System-wide Goals Design

 Facility-specific
 Construction
 Objectives Future TSM&O
 Programs
 Prioritizing Projects Testing

 9
TSM&O Strategies are …
 Integrated Performance Based At All Stages Multimodal

 10
TSM&O Strategies …

 Preserve Capacity

 Improve Safety

 Improve Reliability of
 Transportation System
 11
FDOT’s 2017 TSM&O Strategic Plan
Vision:
Increase the delivery rate of fatality-free
and congestion-free transportation
systems supporting the FDOT Vision and
Florida Transportation Plan Goals.

Mission:
Identify, prioritize, develop, implement,
operate, maintain, and update TSM&O
strategies and measure their effectiveness
for improved safety and mobility.
 12
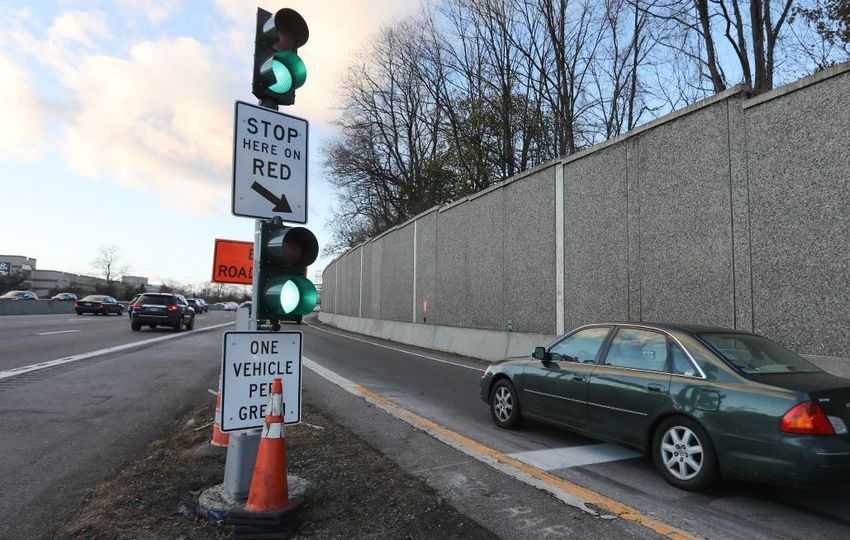
Ramp Metering
Traffic signals along freeway on-ramps to control and
regulate the frequency at which vehicles join the freeway
mainline

 13
Advantages
Help manage entrance demand on
freeway mainline thereby preventing
traffic flow breakdowns

Break up the platoons by controlling
the rate at which vehicles enter the
mainline from the ramp

 14
Deployment
 I-95 in Miami-Dade County I-95 in Broward County
Ives Diary Road to NW 62nd Street Commercial Blvd to Hallandale Beach Blvd

 Source: Zhu et al. 2007 Source: Hadi et al. 2017
 15
Data
Traffic Data RMS Operations Data
• RITIS • FDOT District 6 RTMC

Contextual Data Crash Data
• Google Maps • SunGuide® Incident Database

 16
Methodology: Safety Benefits
 Matched Crash and Non-
 crash Cases

 Crash Precursors

 Penalized Logistic
 Regression

 Bootstrap Resampling
 17
Results: Safety Benefits Ramp metering decreased Crash Precursors: RMSs ON the crash risk by 41% Coefficient of Downstream Average variation Speed Occupancy ✓ ✓ Volume ✓ Coefficient of Upstream Average variation Speed ✓ Crash Precursors: RMSs OFF Occupancy Volume Average downstream volume 18
Methodology: Mobility Benefits
RMSs turned ON versus turned OFF

RMS turned ON due to recurrent congestion

RMS turned OFF because of system malfunctioning

 19
Mobility Benefits
▪ Travel time reliability measured using Buffer Index (BI)
▪ Time cushion that most travelers add to their average travel time when
 planning trips to ensure on-time arrival

 95 ℎ −
 =

▪ RMS reduce BI by 22% during moderate congestion
▪ RMS reduce BI by 30% during severe congestion

 20
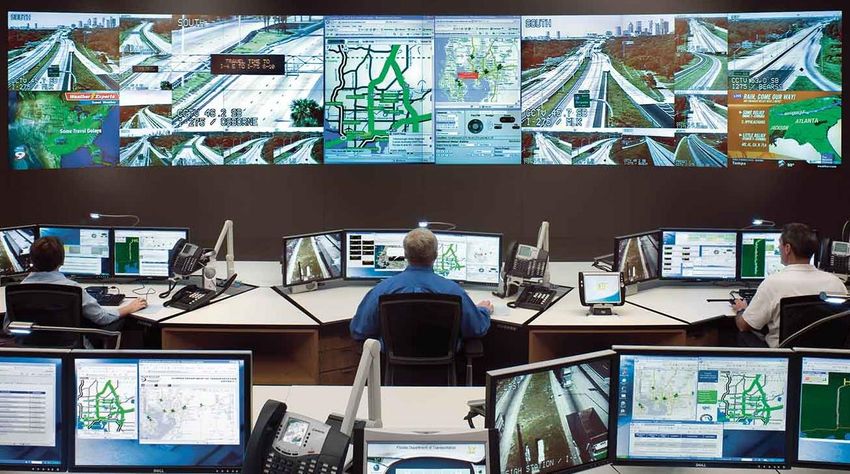
Dynamic Message Signs
Programmable electronic signs used for disseminating
real-time information to road users

 21
DMSs are …. Everywhere (Almost)!
~869 DMSs displaying
messages on major
roadways

Operational 24/7 to
convey time-sensitive
information to motorists

 22
Advantages
 Reduce secondary
 crashes

Minimize travel delays

 Enable fast and
appropriate response to
 incidents

 Assist motorists make
 informed routing
 decisions
 23
Data

 • 23 DMSs along I-75
 • Analysis Period: 2016 – 2018
 24
Quantify Benefits

 25
Quantify Benefits

 Convey information about crashes
Crash Messages downstream and suggest drivers’
 reaction
 Convey general or advisory
Clear Messages information that do not require any
 change in the traffic patterns

 26
Results - Benefits of Dynamic Message Signs
When Crash Messages are
 Average Speed
displayed on the DMSs

 Speed Variance

 Number of Crashes
 Downstream of DMSs

 27
Study Limitations
• The reduction in average speeds observed when the
 DMSs display crash messages may be attributed to
 other sources of information such as Waze, Highway
 Advisory Radio, etc.
• The analysis did not consider other potential factors
 such as incidents downstream which may result in
 speed reduction

 28
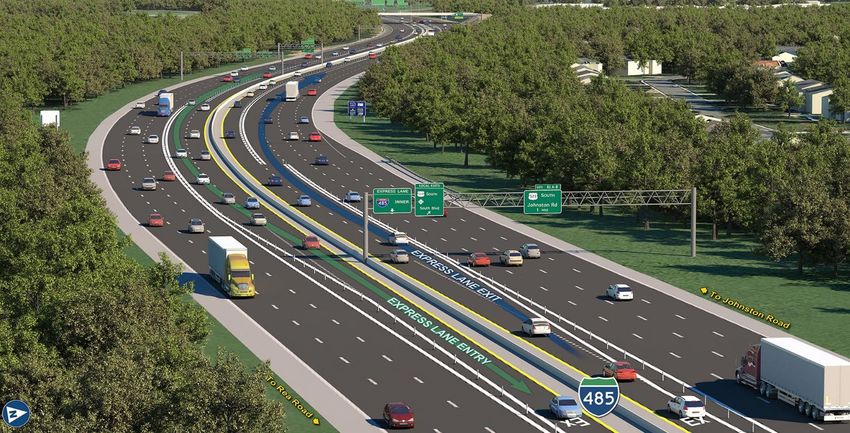
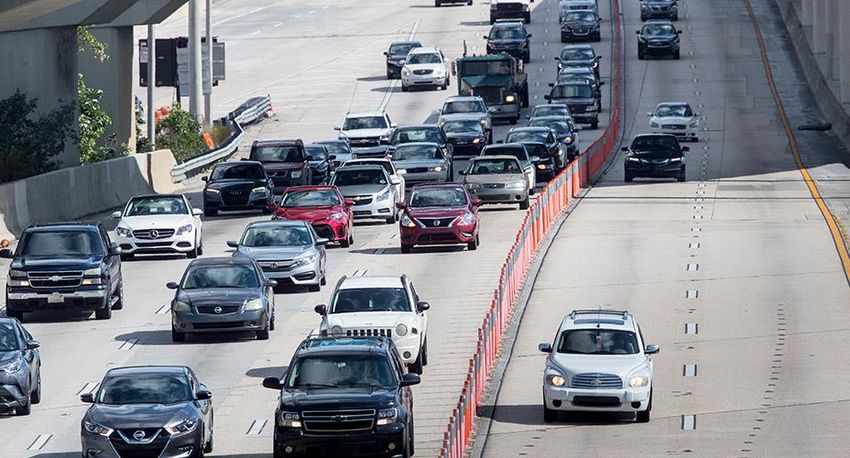
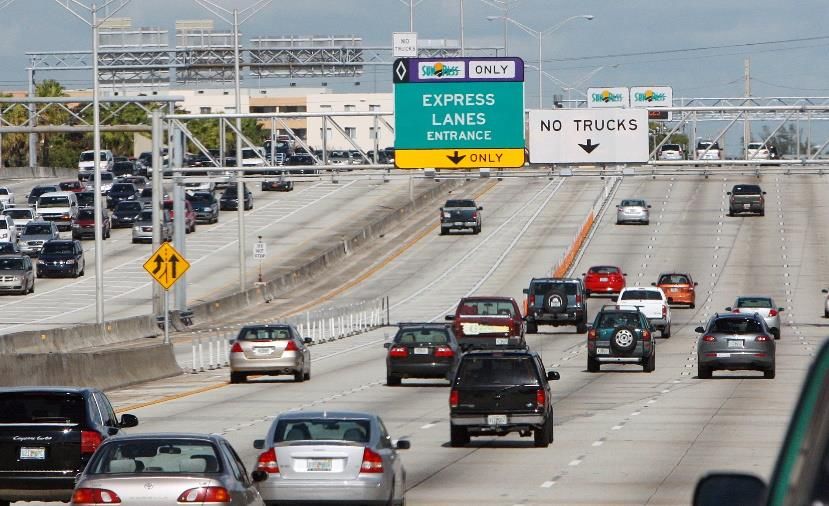
Express Lanes
Express lanes are managed toll lanes, separated from
general-purpose lanes or general toll lanes within a freeway
facility

 29
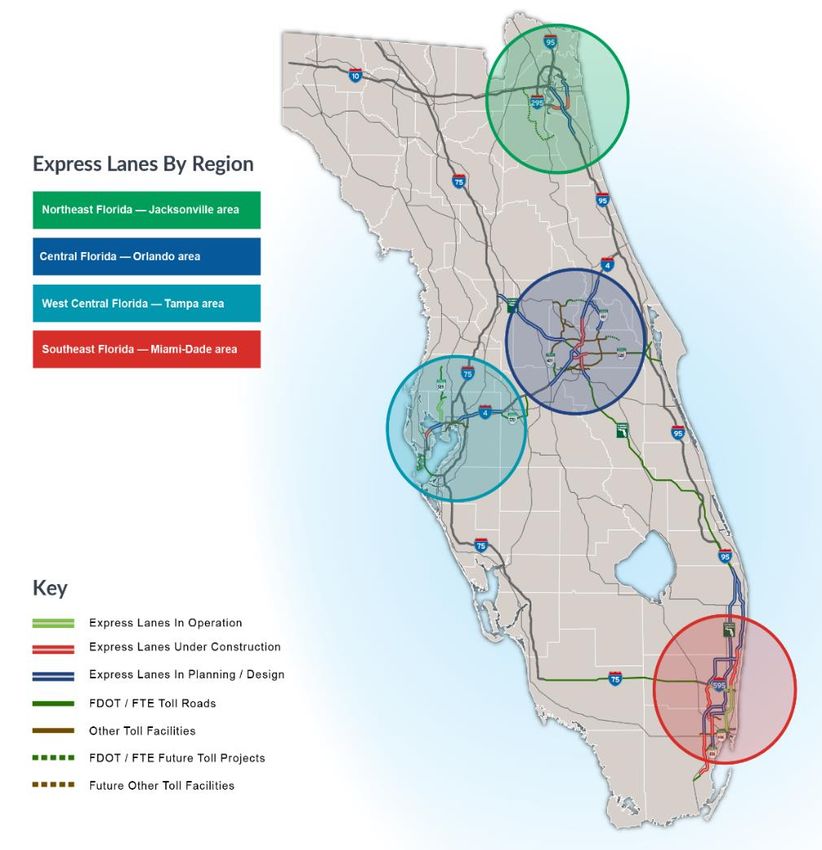
Deployment
 In Operation
 (~62 miles)
 I-95
 I-595 In Planning/Design
 I-75
 Veterans Expressway / SR 589
 (~298 miles)
 Turnpike Mainline
 I-95
 Sawgrass Expressway / SR 869
 Under Construction Palmetto Expressway / SR 826
 I-295
 (~99 miles) I-95
Turnpike Extension (HEFT)
 Turnpike Mainline
I-95
Palmetto Expressway / SR 826 I-4
I-295 Seminole Expressway / SR 417
Beachline West Expressway / SR 528
Turnpike Mainline
I-4
I-275

 30
Advantages
Reduce overall traffic
congestion

Provide a safe and
predictable trip in terms of
travel time

Increase the capacity of the
highway

 31
Mobility Benefits of Express Lanes
Quantify the mobility benefits of Express Lanes by comparing:

 The performance of ELs
 with that of their adjacent
 GPLs
 The performance of GPLs when:
 • ELs were operational versus
 • ELs were closed

 32
Data
Traffic data
• RITIS
 Express Lanes
Contextual data Operations Data
• Google maps • FDOT District 4 and 6
 RTMC

 33
Mobility Benefits of Express Lanes
 Two years of travel time data aggregated
 into 5-minute intervals

 Typical weekday travel time data aggregated
 into 5-minute intervals

 Buffer Index measures calculated

 Performance of ELs and GPLs was compared

 34
N

Both EL and GPLs are open
N

EL are Closed
Performance of GPLs

 Buffer Index for Northbound GPLs Buffer Index for Southbound GPLs

Statistical Test: Welch’s t-test (unequal variance t-test) was used to determine if there was a statistically
 significant difference in the Buffer Indices (BIs)
 37
N

Both EL and GPLs are open
Performance of EL Facilities

 Buffer Index for Northbound Buffer Index for Southbound

Statistical Test: Welch’s t-test (unequal variance t-test) was used to determine if there was a statistically
 significant difference in the Buffer Indices (BIs)
 39
Results –Mobility Benefits
 • When the ELs were operational, the performance of the
 adjacent GPLs improved
 • In general, both the ELs and the GPLs performed better when
 the ELs were operational

 40
Safety Analysis of Express Lanes… Ongoing!
 Quantify the effects of separation types on the safety
 Goal:
 performance of managed lanes facilities

 Objective #1 Objective #2 Objective #3
 Develop SPFs under Develop CMFs for different Develop SDFs to estimate
 specified base separation treatments and the expected crash
 conditions other geometric attributes frequency for different crash
 (other than the base severity levels
 conditions)

 41
Expected Project Benefits - Quantitative
 Project Requirements Other By-products

 ❑ SPFs ❑ A spreadsheet application
 ❑ CMFs ❑ A GIS inventory of managed
 ❑ SDFs lanes in Florida
 ❑ One-page summaries
 ❑ A one-hour recorded webinar
 ❑ A set of sample problems
 42
Managed Lanes Separation Treatments
 Concrete Barrier separation
 Pavement Marking Buffer Separation

 Wide Median Buffer Separation Pylons Buffer Separation

 43
Project Milestones

 44
In Summary
 • TSM&O strategies are proven to improve safety and mobility of
 the our transportation network.
 • The safety and operational benefits are unique to the strategy.
 • While some strategies provide direct quantifiable benefits, it is
 difficult to measure the impacts of some strategies.
 • TSM&O strategies provide feasible alternatives to achieve the
 safety and mobility goals of the agencies.

 45
Research Team

 46
Thank You!

 Priyanka Alluri, Ph.D., P.E.
Florida International University
305-348-3485; palluri@fiu.edu

 47
You can also read