Facebook Q4 2016 Results - investor.fb.com
←
→
Page content transcription
If your browser does not render page correctly, please read the page content below
Facebook Q4 2016 Results

        investor.fb.com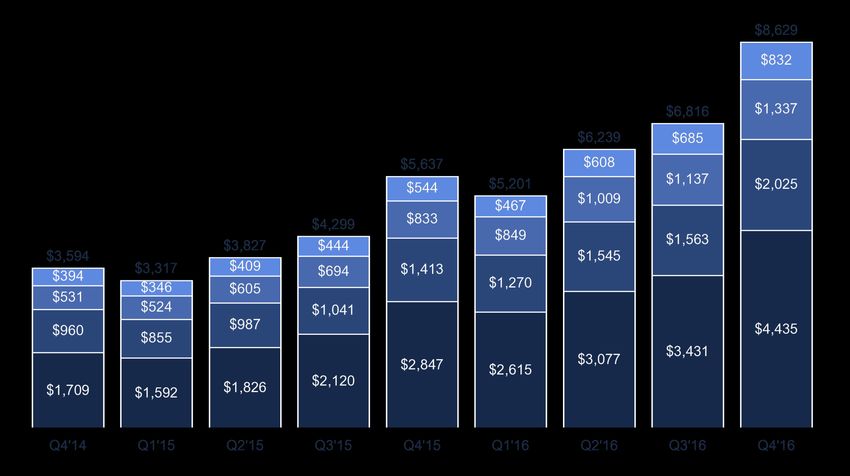
Non-GAAP Measures
In addition to U.S. GAAP financials, this presentation includes certain non-GAAP financial measures. These
non-GAAP measures are in addition to, not a substitute for or superior to, measures of financial performance
prepared in accordance with U.S. GAAP. A reconciliation of GAAP to non-GAAP results is provided in the
appendix to this presentation.

                                                     2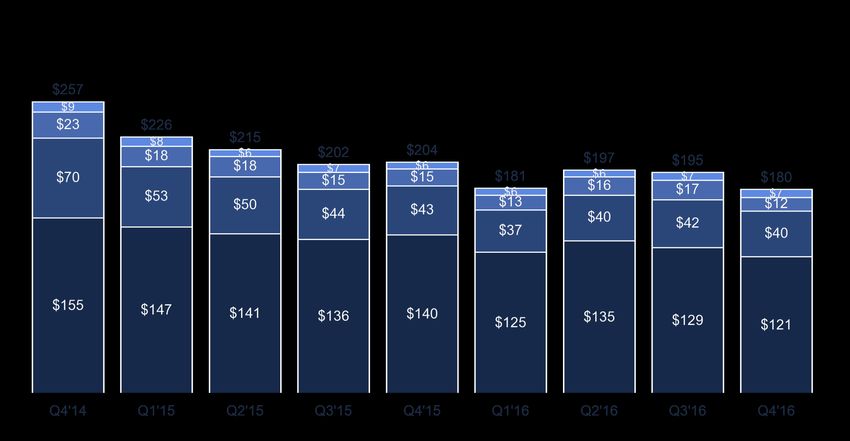
Daily Active Users (DAUs)
In Millions

       Rest of World
       Asia-Pacific
       Europe
       US & Canada

   DAUs / MAUs
       Q4'14                Q1'15                Q2'15               Q3'15                Q4'15                Q1'16               Q2'16                 Q3'16   Q4'16
        64%                  65%                 65%                  65%                  65%                 66%                  66%                  66%     66%

Please see Facebook's most recent quarterly and annual reports filed with the SEC for definitions of user activity used to determine the number of our
DAUs and MAUs. The numbers for DAUs and MAUs do not include Instagram, WhatsApp, or Oculus users unless they would otherwise qualify as such
users, respectively, based on their other activities on Facebook.

                                                                                             3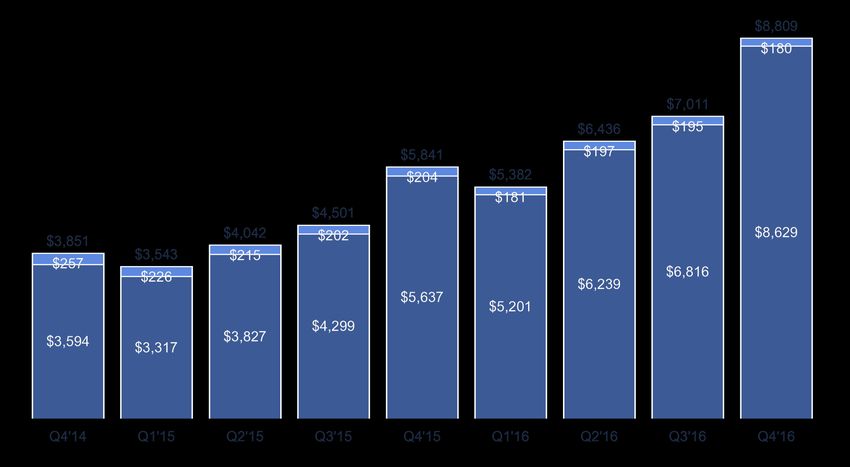
Mobile Daily Active Users (Mobile DAUs)
In Millions

We define a mobile DAU as a user who accessed Facebook via a mobile application or via mobile versions of our website such as m.facebook.com,
whether on a mobile phone or tablet, or used our Messenger mobile application (and is also a registered Facebook user) on a given day. The numbers
for mobile DAUs do not include Instagram, WhatsApp, or Oculus users unless they would otherwise qualify as such users, respectively, based on their
other activities on Facebook.
                                                                                            4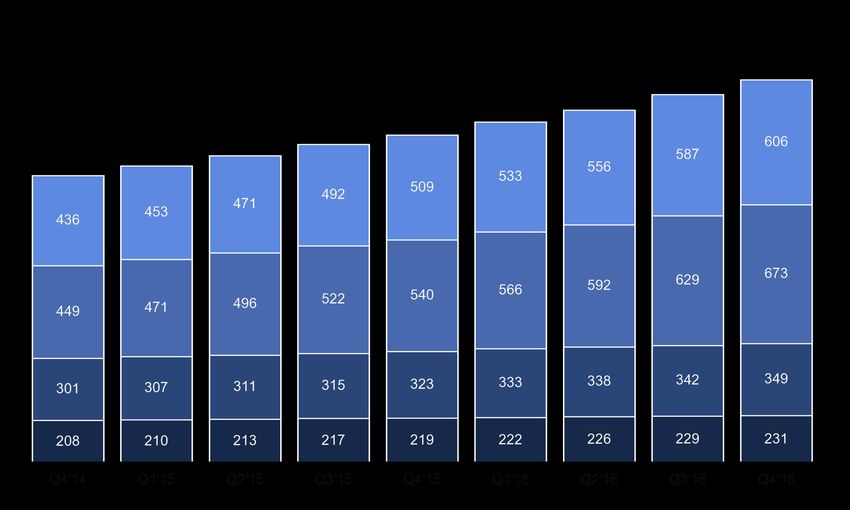
Monthly Active Users (MAUs)
In Millions

       Rest of World
       Asia-Pacific
       Europe
       US & Canada

Please see Facebook's most recent quarterly and annual reports filed with the SEC for definitions of user activity used to determine the number of our
DAUs and MAUs. The numbers for DAUs and MAUs do not include Instagram, WhatsApp, or Oculus users unless they would otherwise qualify as such
users, respectively, based on their other activities on Facebook.

                                                                                             5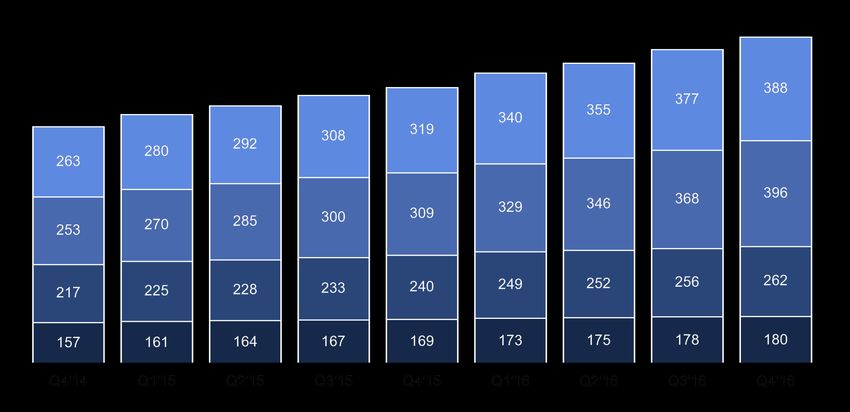
Mobile Monthly Active Users (Mobile MAUs)
In Millions

We define a mobile MAU as a user who accessed Facebook via a mobile application or via mobile versions of our website such as m.facebook.com,
whether on a mobile phone or tablet, or used our Messenger mobile application (and is also a registered Facebook user) during the period of
measurement. The numbers for mobile MAUs do not include Instagram, WhatsApp, or Oculus users unless they would otherwise qualify as such users,
respectively, based on their other activities on Facebook.

                                                                                       6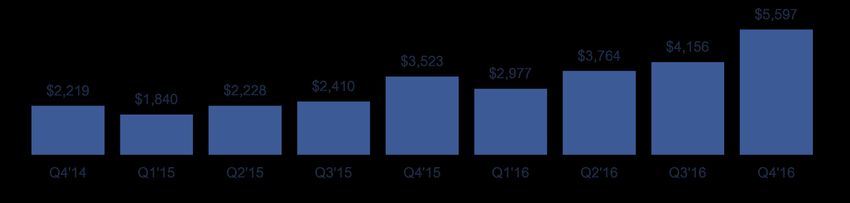
Mobile-Only Monthly Active Users (Mobile-Only MAUs)
In Millions

We define a mobile-only MAU as a user who accessed Facebook solely through mobile applications or mobile versions of our website such as
m.facebook.com, whether on a mobile phone or tablet, or used our Messenger mobile application (and is also a registered Facebook user) during the
period of measurement. The numbers for mobile-only MAUs do not include Instagram, WhatsApp, or Oculus users unless they would otherwise qualify
as such users, respectively, based on their other activities on Facebook.
                                                                                          7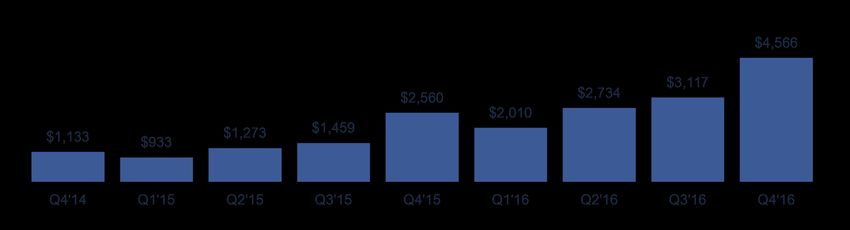
Revenue
In Millions

    Payments and Other Fees
    Advertising

                              8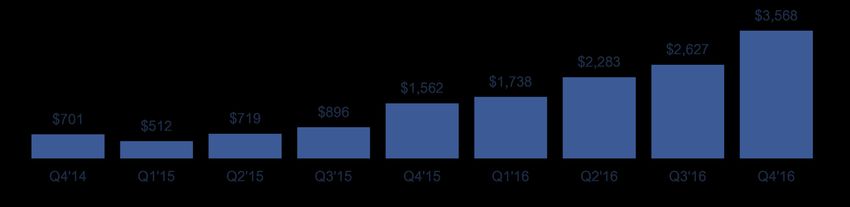
Revenue by User Geography
In Millions

        Rest of World
        Asia-Pacific
        Europe
        US & Canada

Revenue by user geography is geographically apportioned based on our estimation of the geographic location of our users when they perform a revenue-
generating activity. This allocation differs from our revenue by geography disclosure in our condensed consolidated financial statements where revenue is
geographically apportioned based on the location of the marketer or developer. We discovered an error in the algorithm we used to attribute our revenue
by user geography in late 2015. While this issue did not affect our overall worldwide revenue, it did affect our attribution of revenue to different geographic
regions. The fourth quarter of 2015 revenue by user geography and ARPU amounts for all regions were adjusted to reflect this reclassification.
                                                                                                 9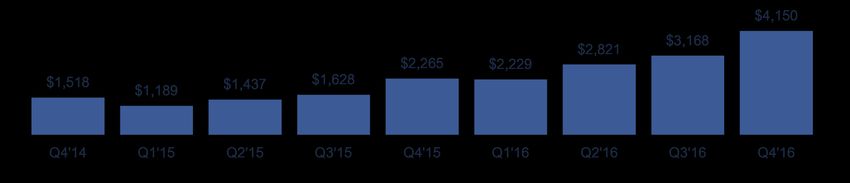
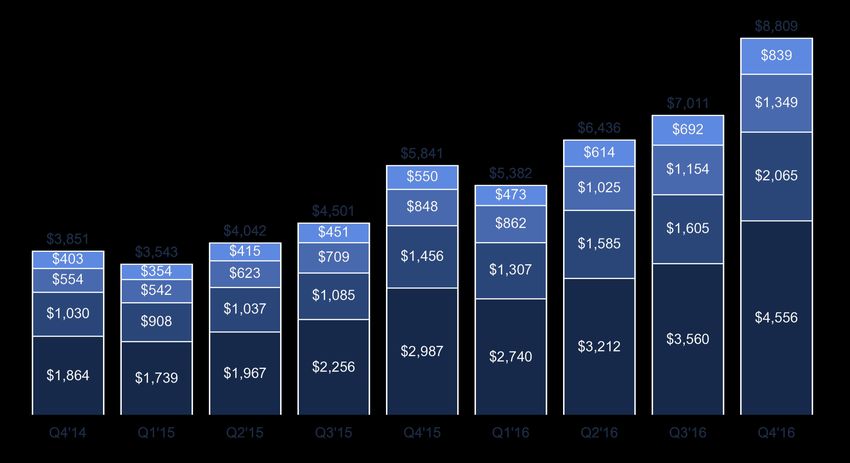
Advertising Revenue by User Geography
In Millions

        Rest of World
        Asia-Pacific
        Europe
        US & Canada

Revenue by user geography is geographically apportioned based on our estimation of the geographic location of our users when they perform a revenue-
generating activity. This allocation differs from our revenue by geography disclosure in our condensed consolidated financial statements where revenue is
geographically apportioned based on the location of the marketer or developer. We discovered an error in the algorithm we used to attribute our revenue
by user geography in late 2015. While this issue did not affect our overall worldwide revenue, it did affect our attribution of revenue to different geographic
regions. The fourth quarter of 2015 revenue by user geography and ARPU amounts for all regions were adjusted to reflect this reclassification.
                                                                                                10
Payments & Other Fees Revenue by User Geography
In Millions
Rest of World
Asia-Pacific
Europe
US & Canada
Revenue by user geography is geographically apportioned based on our estimation of the geographic location of our users when they perform a revenue-
generating activity. This allocation differs from our revenue by geography disclosure in our condensed consolidated financial statements where revenue is
geographically apportioned based on the location of the marketer or developer. We discovered an error in the algorithm we used to attribute our revenue
by user geography in late 2015. While this issue did not affect our overall worldwide revenue, it did affect our attribution of revenue to different geographic
regions. The fourth quarter of 2015 revenue by user geography and ARPU amounts for all regions were adjusted to reflect this reclassification.
11Average Revenue per User (ARPU)
Payments and Other Fees
Worldwide US & Canada
Advertising
Europe Asia-Pacific Rest of World
Revenue by user geography is geographically apportioned based on our estimation of the geographic location of our users when they perform a revenue-
generating activity. This allocation differs from our revenue by geography disclosure in our condensed consolidated financial statements where revenue is
geographically apportioned based on the location of the marketer or developer. Please see Facebook’s most recent quarterly and annual reports filed with
the SEC for the definition of ARPU. We discovered an error in the algorithm we used to attribute our revenue by user geography in late 2015. While this
issue did not affect our overall worldwide revenue, it did affect our attribution of revenue to different geographic regions. The fourth quarter of 2015
revenue by user geography and ARPU amounts for all regions were adjusted to reflect this reclassification.
12Expenses as a % of Revenue
Amortization of intangibles
Share-based compensation + payroll tax expenses related to share-based compensation
All other expenses
Cost of Revenue Research & Development
16% 14% 22% 25% 23% 22%
14% 14%
12% 18%
Marketing & Sales General & Administrative
15% 14%
13% 13% 13%
6% 7% 6% 6% 6%
In the fourth quarter of 2016, we elected to early adopt the Financial Accounting Standards Board (FASB)'s Accounting Standards Update No. 2016-
09, Compensation Stock Compensation (Topic 718): Improvement to Employee Share-based Payment Accounting (ASU 2016-09). Therefore, 2016
quarterly share-based compensation expense includes the impact of the ASU 2016-09 adoption. See ASU 2016-09 Adoption in the Appendix for
additional information related to this adoption.
13Income from Operations
In Millions
GAAP Income from Operations
Non-GAAP Income from Operations
In the fourth quarter of 2016, we elected to early adopt ASU 2016-09. As such, 2016 quarterly GAAP income from operations data includes the impact
of the ASU 2016-09 adoption. See ASU 2016-09 Adoption in the Appendix for additional information related to this adoption.
Non-GAAP income from operations excludes share-based compensation expense, payroll tax expenses related to share-based compensation, and
amortization of intangibles-see the Appendix for a reconciliation of GAAP to Non-GAAP results.
14Operating Margin
GAAP Operating Margin
Non-GAAP Operating Margin
In the fourth quarter of 2016, we elected to early adopt ASU 2016-09. As such, 2016 quarterly GAAP operating margin data includes the impact of the ASU
2016-09 adoption. See ASU 2016-09 Adoption in the Appendix for additional information related to this adoption.
Non-GAAP operating margin excludes share-based compensation expense, payroll tax expenses related to share-based compensation, and amortization
of intangibles-see the Appendix for a reconciliation of GAAP to Non-GAAP results.
15Effective Tax Rate
GAAP Effective Tax Rate
(In millions, except percentages) Q4'14 Q1'15 Q2'15 Q3'15 Q4'15 Q1'16 Q2'16 Q3'16 Q4'16
GAAP income before provision for income taxes $ 1,114 $ 932 $ 1,273 $ 1,432 $ 2,557 $ 2,066 $ 2,754 $ 3,164 $ 4,533
GAAP provision for income taxes 413 420 554 536 995 328 471 537 965
GAAP Effective Tax Rate 37% 45% 44% 37% 39% 16% 17% 17% 21%
Non-GAAP Effective Tax Rate
(In millions, except percentages) Q4'14 Q1'15 Q2'15 Q3'15 Q4'15 Q1'16 Q2'16 Q3'16 Q4'16
Non-GAAP income before provision for income taxes $ 2,200 $ 1,839 $ 2,228 $ 2,383 $ 3,520 $ 3,033 $ 3,784 $ 4,203 $ 5,564
Non-GAAP provision for income taxes 682 650 791 755 1,255 804 963 1,035 1,414
Non-GAAP Effective Tax Rate 31% 35% 36% 32% 36% 27% 25% 25% 25%
In the fourth quarter of 2016, we elected to early adopt ASU 2016-09. As such, 2016 quarterly GAAP effective tax rate includes the impact of the ASU
2016-09 adoption. See ASU 2016-09 Adoption in the Appendix for additional information related to this adoption.
Non-GAAP effective tax rate excludes share-based compensation expense, payroll tax expenses related to share-based compensation, amortization of
intangibles, and related income tax adjustments-see the Appendix for a reconciliation of GAAP to Non-GAAP results.
16Net Income
In Millions
GAAP Net Income
Non-GAAP Net Income
In the fourth quarter of 2016, we elected to early adopt ASU 2016-09. As such, 2016 quarterly GAAP net income includes the impact of the ASU 2016-09
adoption. See ASU 2016-09 Adoption in the Appendix for additional information related to this adoption.
Non-GAAP net income excludes share-based compensation expense, payroll tax expenses related to share-based compensation, amortization of
intangibles, and related income tax adjustments-see the Appendix for a reconciliation of GAAP to Non-GAAP results.
17Diluted Earnings Per Share
GAAP Diluted Earnings Per Share
Non-GAAP Diluted Earnings Per Share
In the fourth quarter of 2016, we elected to early adopt ASU 2016-09. As such, 2016 quarterly GAAP diluted earnings per share include the impact of the
ASU 2016-09 adoption. See ASU 2016-09 Adoption in the Appendix for additional information related to this adoption.
Non-GAAP diluted earnings per share excludes share-based compensation expense, payroll tax expenses related to share-based compensation,
amortization of intangibles, and related income tax adjustments-see the Appendix for a reconciliation of GAAP to Non-GAAP results.
18Capital Investments
In Millions
Quarterly Annual
Capital investments for periods presented were related to purchases of property and equipment.
19Appendix
ASU 2016-09 Adoption
In the fourth quarter of 2016, we elected to early adopt ASU 2016-09 which addresses, among other items, the accounting for income taxes and forfeitures, and cash flow presentation of
share-based compensation. We are required to reflect any adjustments as of January 1, 2016, the beginning of the annual period that includes the interim period of adoption. Upon adoption,
excess tax benefits generated when stock awards vest or settle are no longer recognized in equity but are instead recognized as a reduction to provision for income taxes. We also elected
to account for forfeitures as they occur, rather than estimate expected forfeitures. Cash flows related to excess tax benefits are required to be presented as an operating activity rather than a
financing activity. We adopted the aspects of the standard affecting the cash flow presentation retrospectively, and accordingly, cash flows for the prior periods have been reclassified to
conform to the current year presentation.

The adoption of ASU 2016-09 resulted in, among other items, (i) net cumulative-effect adjustment of $1.67 billion increase to retained earnings as of January 1, 2016, (ii) reduction to our
provision for income taxes of $214 million and $934 million, mostly related to the recognition of excess tax benefits for the fourth quarter and full year 2016, respectively, and (iii)
adjustments to our unaudited selected quarterly data previously reported for fiscal year 2016 as follows:

                                                                                    March 31, 2016                          June 30, 2016                          September 30, 2016
($ in millions)                                                              As reported         As adjusted         As reported         As adjusted        As reported          As adjusted
Consolidated Balance Sheets Data:
Other assets                                                             $           700     $           886     $           703     $          935     $           660     $                990
Total assets                                                             $        52,075     $        52,262     $        55,739     $       55,968     $        59,674     $            60,007
Other liabilities                                                        $         3,116     $         1,867     $         3,145     $        2,170     $         2,964     $              2,290
Total liabilities                                                        $         4,925     $         3,674     $         5,356     $        4,373     $         5,559     $              4,886
Common stock and additional paid-in capital                              $        36,129     $        35,673     $        37,405     $       36,494     $        38,756     $            37,391
Retained earnings                                                        $        11,297     $        13,191     $        13,352     $       15,475     $        15,731     $            18,102

                                                                                 Three months ended                      Three months ended                       Three months ended
                                                                                   March 31, 2016                           June 30, 2016                         September 30, 2016
($ in millions)                                                              As reported         As adjusted         As reported         As adjusted        As reported          As adjusted
Consolidated Statements of Income Data:
Share-based compensation included in costs and expenses                  $           747     $           746     $           805     $          817     $           819     $                824
Total costs and expenses                                                 $         3,373     $         3,372     $         3,690     $        3,702     $         3,889     $              3,894
Provision for income taxes                                               $           555     $           328     $           711     $          471     $           790     $                537
Net income                                                               $         1,510     $         1,738     $         2,055     $        2,283     $         2,379     $              2,627
Effective tax rate                                                                    27%                 16%                 26%                17%                 25%                       17%
Basic EPS                                                                $          0.53     $          0.61     $          0.72     $         0.80     $          0.83     $               0.91
Diluted EPS                                                              $          0.52     $          0.60     $          0.71     $         0.78     $          0.82     $               0.90
Diluted weighted average shares outstanding                                        2,888               2,905               2,904              2,921               2,915                    2,931

                                                                                                 21
ASU 2016-09 Adoption (continued)
Three months ended Six months ended Nine months ended
March 31, 2016 June 30, 2016 September 30, 2016
($ in millions) As reported As adjusted As reported As adjusted As reported As adjusted
Consolidated Statements of Cash Flows Data:
Net cash provided by operating activities $ 2,983 $ 3,477 $ 6,181 $ 7,142 $ 9,758 $ 11,178
Net cash provided by (used in) financing activities $ 184 $ (310) $ 655 $ (306) $ 1,106 $ (314)
22Reconciliations
Income from Operations ($ in millions) Q4'14 Q1'15 Q2'15 Q3'15 Q4'15 Q1'16(1) Q2'16(1) Q3'16(1) Q4'16(1)
GAAP income from operations $ 1,133 $ 933 $ 1,273 $ 1,459 $ 2,560 $ 2,010 $ 2,734 $ 3,117 $ 4,566
Share-based compensation expense 896 703 763 757 746 746 817 824 831
Payroll tax expenses related to share-based compensation 13 25 12 14 26 41 20 20 17
Amortization of intangible assets 177 179 180 180 191 180 193 195 183
Non-GAAP income from operations $ 2,219 $ 1,840 $ 2,228 $ 2,410 $ 3,523 $ 2,977 $ 3,764 $ 4,156 $ 5,597
Operating Margin Q4'14 Q1'15 Q2'15 Q3'15 Q4'15 Q1'16(1) Q2'16(1) Q3'16(1) Q4'16(1)
GAAP operating margin 29% 26% 31% 32% 44% 37% 42% 44% 52%
Share-based compensation expense 23% 20% 19% 17% 13% 14% 13% 12% 9%
Payroll tax expenses related to share-based compensation —% 1% —% —% —% 1% —% —% —%
Amortization of intangible assets 5% 5% 4% 4% 3% 3% 3% 3% 2%
Non-GAAP operating margin 58% 52% 55% 54% 60% 55% 58% 59% 64%
Net Income ($ in millions) Q4'14 Q1'15 Q2'15 Q3'15 Q4'15 Q1'16(1) Q2'16(1) Q3'16(1) Q4'16(1)
GAAP net income $ 701 $ 512 $ 719 $ 896 $ 1,562 $ 1,738 $ 2,283 $ 2,627 $ 3,568
Share-based compensation expense 896 703 763 757 746 746 817 824 831
Payroll tax expenses related to share-based compensation 13 25 12 14 26 41 20 20 17
Amortization of intangible assets 177 179 180 180 191 180 193 195 183
Income tax adjustments (269) (230) (237) (219) (260) (476) (492) (498) (449)
Non-GAAP net income $ 1,518 $ 1,189 $ 1,437 $ 1,628 $ 2,265 $ 2,229 $ 2,821 $ 3,168 $ 4,150
Diluted Earnings Per Share Q4'14 Q1'15 Q2'15 Q3'15 Q4'15 Q1'16(1) Q2'16(1) Q3'16(1) Q4'16(1)
GAAP diluted earnings per share $ 0.25 $ 0.18 $ 0.25 $ 0.31 $ 0.54 $ 0.60 $ 0.78 $ 0.90 $ 1.21
Non-GAAP adjustments to net income 0.29 0.24 0.25 0.26 0.25 0.17 0.19 0.18 0.20
Non-GAAP diluted earnings per share $ 0.54 $ 0.42 $ 0.50 $ 0.57 $ 0.79 $ 0.77 $ 0.97 $ 1.08 $ 1.41
(1) In the fourth quarter of 2016, we elected to early adopt ASU 2016-09. We have properly reflected the impact of the adoption in certain 2016 quarterly
results of operations data. See ASU 2016-09 Adoption in this Appendix for additional information related to this adoption.
23Reconciliations (continued)
GAAP Tax ($ in millions) Q4'14 Q1'15 Q2'15 Q3'15 Q4'15 Q1'16(1) Q2'16(1) Q3'16(1) Q4'16(1)
GAAP income before provision for income taxes $ 1,114 $ 932 $ 1,273 $ 1,432 $ 2,557 $ 2,066 $ 2,754 $ 3,164 $ 4,533
GAAP provision for income taxes 413 420 554 536 995 328 471 537 965
GAAP Effective Tax Rate 37% 45% 44% 37% 39% 16% 17% 17% 21%
Non-GAAP Tax ($ in millions) Q4'14 Q1'15 Q2'15 Q3'15 Q4'15 Q1'16(1) Q2'16(1) Q3'16(1) Q4'16(1)
GAAP income before provision for income taxes $ 1,114 $ 932 $ 1,273 $ 1,432 $ 2,557 $ 2,066 $ 2,754 $ 3,164 $ 4,533
Share-based compensation and related payroll tax expenses 909 728 775 771 772 787 837 844 848
Amortization of intangible assets 177 179 180 180 191 180 193 195 183
Non-GAAP income before provision for income taxes $ 2,200 $ 1,839 $ 2,228 $ 2,383 $ 3,520 $ 3,033 $ 3,784 $ 4,203 $ 5,564
Non-GAAP provision for income taxes 682 650 791 755 1,255 804 963 1,035 1,414
Non-GAAP Effective Tax Rate 31% 35% 36% 32% 36% 27% 25% 25% 25%
(1) In the fourth quarter of 2016, we elected to early adopt ASU 2016-09. We have properly reflected the impact of the adoption in certain 2016 quarterly
results of operations data. See ASU 2016-09 Adoption in this Appendix for additional information related to this adoption.
24Reconciliations (continued)
Free Cash Flow ($ in millions) Q4'14 Q1'15 Q2'15 Q3'15 Q4'15 Q1'16 Q2'16 Q3'16 Q4'16
Net cash provided by operating activities $ 2,087 $ 2,123 $ 2,266 $ 2,538 $ 3,393 $ 3,477 $ 3,665 $ 4,036 $ 4,930
Purchases of property and equipment 517 502 549 780 692 1,132 995 1,095 1,269
Free Cash Flow $ 1,570 $ 1,621 $ 1,717 $ 1,758 $ 2,701 $ 2,345 $ 2,670 $ 2,941 $ 3,661
In the fourth quarter of 2016, we elected to early adopt ASU 2016-09. We have properly reflected the impact of the adoption in quarterly net cash
provided by operating activities and free cash flows for all periods presented. See ASU 2016-09 Adoption in this Appendix for additional information
related to this adoption.
25Limitations of Key Metrics and Other Data
The numbers for our key metrics, which include our daily active users (DAUs), mobile DAUs, monthly active users (MAUs), mobile MAUs, and average revenue per user
(ARPU), as well as certain metrics such as mobile-only MAUs, are calculated using internal company data based on the activity of user accounts. While these numbers are
based on what we believe to be reasonable estimates of our user base for the applicable period of measurement, there are inherent challenges in measuring usage of our
products across large online and mobile populations around the world. In addition, we are continually seeking to improve our estimates of our user base, and such estimates
may change due to improvements or changes in our methodology. For example, the number of duplicate or false accounts maintained by users in violation of our terms of
service may change as our methodologies evolve. In 2016, we estimate that "duplicate" accounts (an account that a user maintains in addition to his or her principal account)
may have represented approximately 6% of our worldwide MAUs. We also seek to identify "false" accounts, which we divide into two categories: (1) user-misclassified
accounts, where users have created personal profiles for a business, organization, or non-human entity such as a pet (such entities are permitted on Facebook using a Page
rather than a personal profile under our terms of service); and (2) undesirable accounts, which represent user profiles that we determine are intended to be used for purposes
that violate our terms of service, such as spamming. In 2016, for example, we estimate user-misclassified and undesirable accounts may have represented approximately 1%
of our worldwide MAUs. We believe the percentage of accounts that are duplicate or false is meaningfully lower in developed markets such as the United States or United
Kingdom and higher in developing markets such as India and Turkey. However, these estimates are based on an internal review of a limited sample of accounts and we apply
significant judgment in making this determination, such as identifying names that appear to be fake or other behavior that appears inauthentic to the reviewers. As such, our
estimation of duplicate or false accounts may not accurately represent the actual number of such accounts.
Our data limitations may affect our understanding of certain details of our business. For example, while user-provided data indicates a decline in usage among younger users,
this age data is unreliable because a disproportionate number of our younger users register with an inaccurate age. Accordingly, our understanding of usage by age group
may not be complete.
In addition, our data regarding the geographic location of our users is estimated based on a number of factors, such as the user's IP address and self-disclosed location.
These factors may not always accurately reflect the user's actual location. For example, a user may appear to be accessing Facebook from the location of the proxy server
that the user connects to rather than from the user's actual location. The methodologies used to measure user metrics may also be susceptible to algorithm or other technical
errors. Our estimates for revenue by user location and revenue by user device are also affected by these factors. For example, we discovered an error in the algorithm we
used to attribute our revenue by user geography in late 2015. While this issue did not affect our overall worldwide revenue, it did affect our attribution of revenue to different
geographic regions. The fourth quarter of 2015 revenue by user geography and ARPU amounts were adjusted to reflect this reclassification. We regularly review our
processes for calculating these metrics, and from time to time we may discover inaccuracies in our metrics or make adjustments to improve their accuracy, including
adjustments that may result in the recalculation of our historical metrics. We believe that any such inaccuracies or adjustments are immaterial unless otherwise stated. In
addition, our DAU and MAU estimates will differ from estimates published by third parties due to differences in methodology.
The numbers of DAUs, mobile DAUs, MAUs, mobile MAUs, and mobile-only MAUs discussed in this presentation, as well as ARPU, do not include Instagram, WhatsApp, or
Oculus users unless they would otherwise qualify as such users, respectively, based on their other activities on Facebook.
26Facebook Q4 2016 Results
investor.fb.comYou can also read