State of the market: Industry trends - February 2018 - GroundTruth
←
→
Page content transcription
If your browser does not render page correctly, please read the page content below
State of the market: Industry trends
             February 2018
Table of contents

       THE DIGITAL LANDSCAPE                                  CONSUMER TRENDS
•   Smartphone usage                              •   Media consumption is shifting away from TV
•   Digital ad spend and format                   •   Consumers expect a shopping experience that's
                                                      convenient and friction-free
•   Location-targeted mobile ad spend
                                                  •   The traditional retail model is no longer enough,
                                                      consumers crave experience
                                                  •   Consumers are comfortable sharing their data… but
                                                      only if the benefit is clear

                                                                         Confidential and Proprietary | Do Not Distribute | © 2018 GroundTruth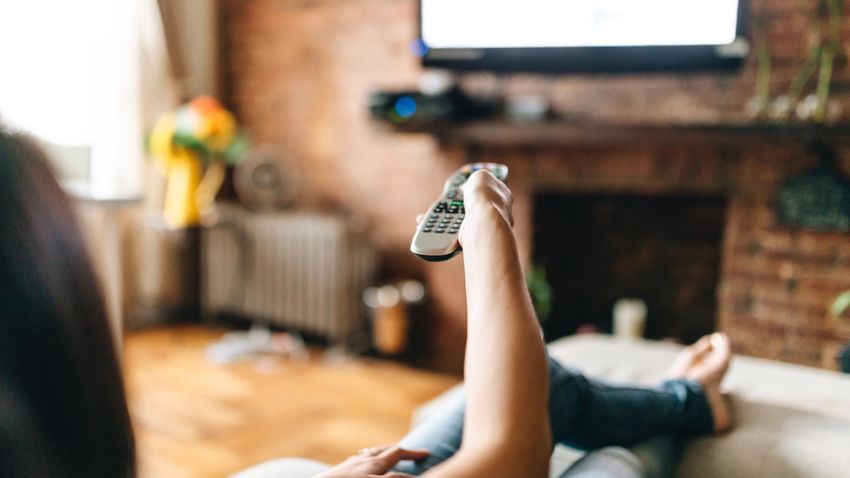
The digital landscape

Smartphone usage
                                                 220 million people in the U.S. own a smartphone,
                                                 representing 67% of the population

       U.S. smartphone users (millions)                 U.S. smartphone penetration (% of population)

                                                                                                                                               73%
                                          245                                                                    72%
                                242                                              71%
                    237
                                                             70%
       229

220                                              67%

2017   2018        2019         2020      2021   2017        2018                2019                            2020                          2021

                                                                       Confidential and Proprietary | Do Not Distribute | © 2018 GroundTruth
Digital ad spend by format Mobile is now the second highest category
for ad spend, by 2019 it will surpass TV
U.S. ad spend by media type
TV Mobile Desktop Print Other
$102.3
$93.0
$82.3
$71.7 $71.9 $70.1 $72.2 $74.0 $74.2
US$ Billions
$58.4
$26.2 $24.5 $22.4 $26.2 $27.0 $26.2
$24.6 $24.3 $26.1 $23.7 $23.1 $26.1 $23.1 $22.6 $22.3
2017 2018 2019 2020 2021
Source: eMarketer
Confidential and Proprietary | Do Not Distribute | © 2018 GroundTruthDigital ad spend by format
U.S. mobile ad spend by media type
2%
10%
16% 39% On mobile, search and
social have the largest
share, but growth is steady
across all formats
33%
Search Native/social Display Video Messaging Note: excludes tablet
Source: BIA Kelsey, 2016
Confidential and Proprietary | Do Not Distribute | © 2018 GroundTruthLocation-targeted mobile ad revenues are projected
Location-targeted mobile ad spend to grow from $12 billion in 2016 to $32 billion by
2021, representing 45% of all mobile ad spend
U.S Local vs. National Ad Spend in Mobile
Location Targeted* Non-Location Targeted $72.0
$65.2
$57.2
$48.7 $39.6
US$ Billions
$36.3
$40.2
$32.4
$32.6 $28.0
$24.2
$20.2
$32.4
$20.7 $24.8 $28.9 45%
$12.4 $16.0 38%
2016 2017 2018 2019 2020 2021
*Location-targeted mobile ads include ads with location targeting component,
Source: BIA Kelsey, 2017
location specific ad copy or location specific calls to action
Confidential and Proprietary | Do Not Distribute | © 2018 GroundTruthConsumer trends
CONSUMER TREND #1
Media consumption is shifting away
from TV
Media viewing habits are changing. Just consider TV. Consumers are opting instead
for services like Netflix, Hulu, and over-the-top (OTT) options that allow them to avoid
traditional paid TV. Because of that, TV's share of total media ad spend in the US
dropped and advertisers are rapidly revising their marketing plans. There is an
increased importance in targeting the channels and platforms where consumers are
now devoting the majority of their attention.
While consumers are still spending time watching
                                                                         TV, the average time spent is decreasing each
            Average time spent per day with major media by adults        year, as “cord cutting” becomes a trend and
                                                                         mobile usage continuously increases

           TV                                                   237.79

                                                                                                 More than
     Mobile -
                                                       197.02
     nonvoice
                                                                                        22 million
                                                                                        adults are nowconsidered
Desktop/laptop                                                                           “cord-cutters”, which is
                                         122.81
   internet

                                                                                               33%
                                                                                        more people than lastyear!
        Radio                    85.90

      Source: eMarketer

                                                                                              Confidential and Proprietary | Do Not Distribute | © 2018 GroundTruth
As a result, digital advertising (mobile & desktop) has now surpassed
TV; by 2021 mobile alone will represent over 40% of spend
Total media ad spending by media
2017 2021
13% 10%
Mobile This year, TV’s share of total
28% 9% media ad spend in the US
12% Desktop 41%
TV
dropped 34%
12% Print 29%
35%
Other*
11%
*includes Radio, OOH and Directories
Source: eMarketer
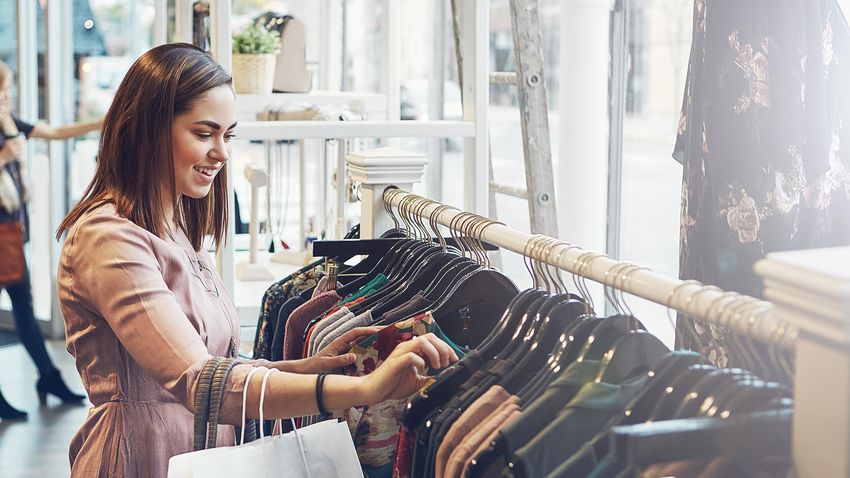
Confidential and Proprietary | Do Not Distribute | © 2018 GroundTruthCONSUMER TREND #2 Consumers expect a shopping experience that's convenient and friction-free Customers demand an easy shopping experience, regardless of whether they’re shopping online, in-store, or on mobile. Marketers are listening to these needs, offering services such as buying online to pickup in store, or the ability to browse online inventory at a brick-and- mortar location. These changes will impact the customer journey and get other brands thinking about how to stay competitive and relevant in the transitioning retail space. In order to succeed, marketers will need to use all their tools (mobile, online, and in-store) for a truly seamless experience.
Savvy consumers aren’t just relying on a single channel for
      shopping. Online, mobile, and in-store experiences are all key
      to the complete consumer journey

         50%                                                 13 min                                             91%
  of people visit the website of a                           is the average time spent                    Of consumers research on their
retailer before/after going in-store                       on a retailer’s mobile website                 mobile device before going in-
                                                                before going in-store                                 store

            Online                                                       Mobile                                   In-store

      Source: GroundTruth and ComScore Online to Offline Study on Target, Best Buy and Home Depot, 2017
Mobile is the key to bringing all the tools together. These “always-on” devices are being
utilized more each year, especially for more time consuming activities, especially shopping
Average time spent per day with mobile (U.S.)
Mobile set anew record this
207.28
Black Friday, representing
169.9
47% of visits
+22% With and
increase smartphone traffic revenue from
specifically growing smartphones saw
22% YoY 39% YoY
growth, anew
all-time high
2015 2018
Sources: eMarketer; Adobe Analytics
Confidential and Proprietary | Do Not Distribute | © 2018 GroundTruthConsumers want easy shopping experiences, and are utilizing their smartphones and convenience services
like BOPIS (buy online, pickup in-store) to quickly get themselves in-store and through the checkout line
Ways in which consumers use mobile devices to facilitate in-store
shopping
In 2017,
Locate a store 40%
54%
Check product prices 40% of internet users bought items
online and picked up in-store and
Check opening and closing times 38%
40%
of people made another purchase
Read customer reviews 33% while in-store for pickup
Source: eMarketer
Confidential and Proprietary | Do Not Distribute | © 2018 GroundTruthCONSUMER TREND #3
The traditional retail model is no longer
enough, consumers crave experience
While the in-store shopping experience is far from dead, it’s definitely evolving. This year we
learned that consumers are demanding more from their shopping experiences. Brands can
still come out ahead by investing in pop-up stores, in-store experiences, and intriguing
packaging. Consumers, and young shoppers in particular, will be attracted to exciting and
unconventional shopping adventures.
Confidential and Proprietary | Do Not Distribute | © 2017 GroundTruth 16Aided by mobile, in-store shopping is very much alive and well…
especially when it comes to last minute shopping
2016 holiday retail in-store foot traffic
The day before Christmas Eve saw
54% higher than average foot traffic!
Source: GroundTruth & ComScore, 2017
Confidential and Proprietary | Do Not Distribute | © 2018 GroundTruthThe in-store environment is just changing. As consumers embrace digital technologies, retailers must redefine
the traditional in-store shopping environment by providing intriguing experiences and personalization.
Factors that improve the in-store shopping experience
Even online focused (among internet users in North America)
brands are bringing their
products to life with pop-
Free Wi-Fi 46%
up experiences to
deliver an integrated
shopping experience In-store kiosks/digital help desks 37%
both online and offline
Personalized offers sent directly to phone 34%
Staff using tablets to take payments 27%
Improved or quicker in-store collection
24%
processes
Personalized loyalty offers sent directly to
22%
email
Source: eMarketer
Confidential and Proprietary | Do Not Distribute | © 2018 GroundTruthCONSUMER TREND #4
Consumers are comfortable sharing their
data… but only if the benefit is clear
Now more than ever, consumers want companies to be transparent about how their customer
information is being used. When it’s clear that personal data is being used as a benefit to the
consumer, such as for personalized offers and deals, they are more willing to give it up.
Confidential and Proprietary | Do Not Distribute | © 2017 GroundTruth 19Overall, consumers are more willing to share their personal data with brands they trust, but this
willingness does vary by age as well
Would share shopping preferences to
improve service
75% Millennials 67%
of people are more willing to share
various types of personal data with
brands they trust Gen X 56%
Baby Boomers 42%
Source: eMarketer; Salesforce, 2017
Confidential and Proprietary | Do Not Distribute | © 2018 GroundTruthThe biggest driver as to whether or not a consumer will share their personal information is if there is a benefit
to them—either in the form of discounts or personalization
Primary incentive for which U.S. internet users would be willing to share their
personal data with a company
Promotions, discounts or deals based on my 26%
preferences or account history
Faster resolution to an issue or concern
77% because my information is already on file
Auto-checkout because my personal/payment
information is already stored
14%
16%
of people agreed they would be Recommendations for products/services to
willing to share their data if there 4%
consider purchasing based on my history
was a clear benefit for them Targeted ads for a product/service I'm
3%
interested in
A personalized greeting from the company
3%
when I make contact
Source: eMarketer; Accenture
Confidential and Proprietary | Do Not Distribute | © 2018 GroundTruthKey takeaways and implications 1. Engage with “mobile first” consumers More so now than ever, consumers are turning to their mobile devices first over any other screen. Engaging with consumers through this channel is the best and most effective way to reach them to influence behavior. Targeting through mobile gives marketers the opportunity to reach consumers at home, on-the-go, in-store and virtually anywhere. 2. Aid in providing an easy and convenient shopping experience The most preferred shopping channel is still in-store, but consumers now expect their in-store experience to be easy and friction- free. Marketers can use location targeting to help shoppers find the nearest location to them and then provide them with the most accurate and relevant messaging for their shopping trip. 3. The in-store environment must be experiential Consumers on their mobile devices while in a physical location represent a prime opportunity for marketers to engage and activate customers in new and innovative ways. Marketers can enhance the in-store experience by promoting coupons, loyalty programs and other in-store activations through mobile. 4. Be the brand that consumers can trust Consumers expect brands to be transparent and trustworthy, especially with their data. If brands act accordingly, consumers will be more open to receiving personalized messaging based on that shared data. Building audience profiles based on lifestyle, demographic information, and even the locations they visit helps marketers provide the most relevant messaging that consumers find useful and worth giving their personal information up for.
You can also read