PROPOSED REGULATORY CHANGES FOR CONTINUOUS EMISSION MONITORING OF ALBERTA'S INDUSTRIAL POINT SOURCES - Calgary, Alberta April 23-25, 2019
←
→
Page content transcription
If your browser does not render page correctly, please read the page content below
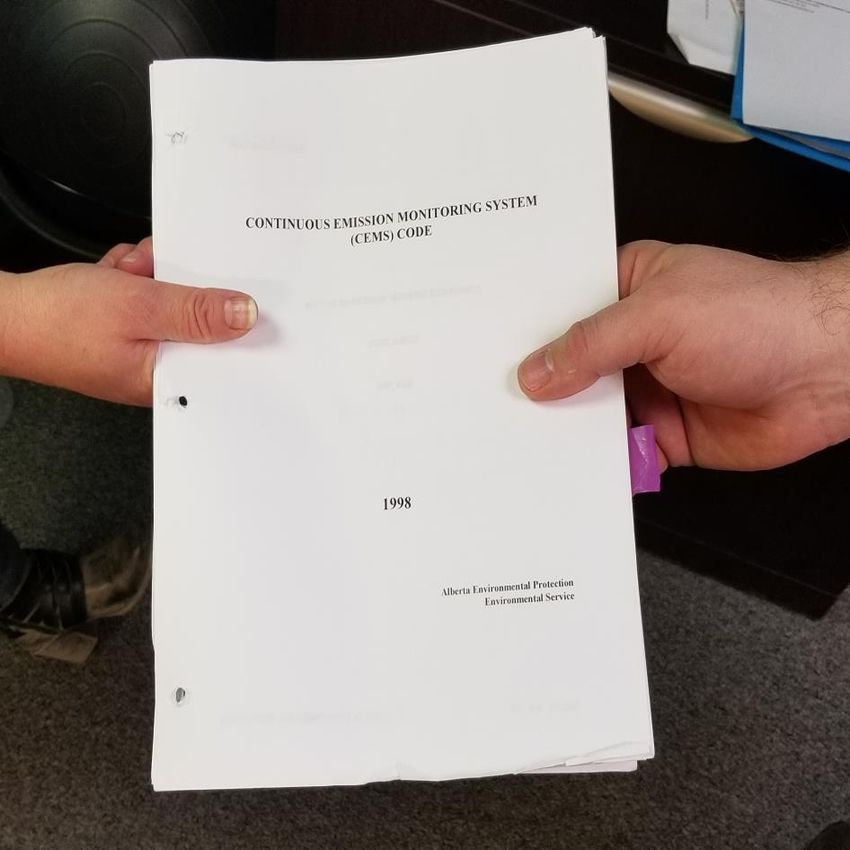
PROPOSED REGULATORY CHANGES FOR
CONTINUOUS EMISSION MONITORING OF
ALBERTA’S INDUSTRIAL POINT SOURCES

 Calgary, Alberta
 April 23-25, 2019

 1
AGENDA

 Proposed Changes

Overview
 Summary
 Q&A

Slides 3 - 10 Slides 11 - 28 Slides 29 - 32 Slide 33

 2
OVERVIEW
Brief introduction to continuous emission monitoring
in Alberta

 3

WHAT IS A CONTINUOUS EMISSION MONITOR?

Continuous Emission Monitoring System(s)
(CEMS) measure emissions levels in real-time
from stationary sources.

 4
WHERE DO WE FIND CEMS ?

Power Generation Waste Incineration EPEA Approval
NOX, NH3 slip, CO2 Multi-parameter monitoring,
quantification, process opacity, NH3 slip, CO2
 A facilities EPEA approval
monitoring quantification, process may require continuous
 monitoring
 emission monitoring

 The approval will indicated
 which sources are required to
Cement Oil & Gas
Multi-parameter monitoring, NOX, SO2 emission have CEMS and what
opacity, NH3 slip, CO2 monitoring CO2 substances/parameters will
quantification, process quantification
monitoring Process control and
 need to monitored and
 monitoring reported

 5
WHY DO WE HAVE CEMS?

 Public Regulator Industry
○ Transparency of ○ Evaluate Emissions ○ Evaluate Emissions
 environmental Compliance Compliance
 management and ○ Identify Periods of Excess ○ Identify Periods of Excess
 assessment Emissions Emissions
○ Accountability of ○ Monitor Emissions (for ○ Monitor Emissions (for
 effectiveness and efficiency management) management)
 of environmental systems ○ Tool for Emissions Trading, ○ Emissions Trading, Credit
○ Promotion of public trust, Credit Validation or Tax Validation or Tax
 goodwill and credibility ○ Public Perception ○ Public Perception
 Reporting Reporting
 6
CEMS REGULATIONS

 Alberta
 ECCC’s USEPA
 CEMS
EPS 1/PG/7 Part 60 & 75
 Code of Practice

 7
THE ALBERTA
CEMS CODE OF PRACTICE

 ○ Establishes requirements for
 installation and operation
 ○ Ensures effective measurement of
 emissions
 ○ Establish QA/QC requirements
 ○ Establishes requirements for
 alternative monitoring systems
 ○ Provides guidance for meeting CEMS
 requirements
 8
Air Air Monitoring Revised
Monitoring Alberta Directive Alberta
 Directive CEMS Code (Amended)
 CEMS Code

 1995 2003 2016

 1989 1998 2006 2019

 Stack Air Monitoring
 CEMS
 Sampling Directive
 User Manual
 Code (2016)
❑ Analyzer performance
❑ Data quality
❑ Data integrity (data loss)

 10
PROPOSED MAJOR CHANGES
Highlights of the proposed updates and changes in the
new Draft CEMS Code

 11
MONITORING SPECIFICATIONS

○Specifications for additional monitoring parameters
 □ Mercury (Hg)
 □ Hydrogen sulphide (H2S)
 □ Ammonia (NH3)
 □ Ethylene (C2H4) Performance Targets
 □ Ethylene oxide (C2H4O)

 12
CONTINUOUS OPACITY MONITORING SYSTEMS
 (COMS)

○For design, installation and operation in-stack opacity
 analyzers required to follow:
 □ ASTM D6216
 □ USEPA Performance Specification 1

○10-second minimum data resolution for opacity
○Must perform a quarterly check using attenuation filters
 (≤±3.0% span)

 13
DESIGN SPECIFICATIONS

○Effluent analyzers will require range changes under the
 proposed guidelines
 □ No longer in relation to emission limit provided in EPEA approval
 □ Instead, range must be 40-75% of average monthly concentration
 □ A dual range analyzer may be a required depending on the facility
 operation
 □ If average falls outside range for >3 months, must re-range analyzer
 □ Phase in date is proposed to be 1 year after the Code enforcement date

 14
DESIGN SPECIFICATIONS

○Use of flowing calibration gas for
 calibration drift tests and linearity
 tests will be required

○Applicable to new installations

○May impact the CEMS equipment
 available to industrial operators

 15
OUT-OF-CONTROL CONDITIONS

○Continuous emission monitors are required to undergo daily
 calibration drift checks
○Zero and span out-of-control (OOC) conditions have changed
 □ Drift limits have been adjusted (increased) to match federal
 requirements
 □ CEMS is OOC the first time the analyzer measures x2 the stated
 calibration drift tolerance, as opposed to waiting five consecutive days
 □ This is more stringent the previous x4 calibration drift tolerance

 16
OUT-OF-CONTROL CONDITIONS

 −
 % = 100

 Range change?

○New drift limits are set to take effect 1 year after CEMS Code
 enforcement date (same as range rule)

 17
DATA AVAILABILITY

○CEMS percent availability calculation has changed from using
 hours to minutes

 = x 100%

 ta = total time in minutes during the month for which the system or analyzer generated quality assured
 data; and
 t = total time in minutes that source operated during the month.

 18
DATA AVAILABILITY

○Uptime requirement remains the same at ≥ 90% for calendar
 month, except for Hg analyzers ≥ 80% calendar month
○What is considered a valid hour or interval has also changed
○Higher % availability values may be harder to achieve in some
 cases (no allowance for maintenance or QA/QC activities)

 19
DATA AVAILABILITY

○Engineering estimates are permissible for missing data periods
PERFORMANCE EVALUATIONS

 NEW NEW

Cylinder Gas Audit Relative Accuracy Alternate Quarterly Flow-to-Load
(CGA) Test Audit (RATA) Audit A data analysis (ratio)
A linearity test A test which compares An independent audit used as an
conducted using a continuous emission of the CEMS using a independent check of
flowing calibration test monitor to an portable analyzer. a flow analyzers
gas that is comprised independent reference Only required when performance.
of a certified reference method. the CEMS is unable to
material. perform CGA’s.
RELATIVE ACCURACY TEST AUDITS
 (RATA)
 dependent variable

 Mass
 Rate
Concentration Flow Temperature

 independent variables

 22
PERFORMANCE EVALUATION
 RATA

○Mass rate relative accuracy is now required and reportable,
 but there is no performance criteria (pass/fail) requirement
○‘Footnote A’ removed from previous 1998 Code and replaced
 with ‘low emitters criteria’
○To meet the low emitters criteria source must emit less than
 50 ppm of the monitored substance; only applies to SO2,
 NOX, and CO

 23
PERFORMANCE EVALUATION RATA Low Emitters Rule: σ − = 100% ≤ 10.0% σҧ σ + ഥ = or 100% ≤ 10.0% 1 ҧ = − ≤ ±4 =1 24
PERFORMANCE EVALUATION
 RATA

○Flow relative accuracy has been lowered from 15% to 10%
○Bias is also a measured during a relative accuracy test; this
 limit has been increased from ±4% to ±5% (for both flow and
 gas analyzers)
○No BAF adjustment (bias adjustment factor), unlike PG/7 and
 USEPA

 25
PERFORMANCE EVALUATION
 RATA

○There is a RATA reduction criteria from one to two RATA’s per
 year
 □ RA ≤ 7.5% for gas analyzers
 Must meet criteria for
 □ RA ≤ 10% for flow RATA four consecutive RATA’s
 to qualify
 □ RA ≤ 10˚C for temperature

○If an operator achieves this they must replace the skipped RATA
 with a CGA
○However, must have flowing test gas to do the RATA reduction!

 26
PERFORMANCE EVALUATION
 ALTERNATE QUARTERLY AUDITS

○If a gas analyzer cannot accept flowing test gas (therefore cannot
 perform a CGA), the facility must perform an alternate quarterly
 test audit
○Performed using a portable analyzer via EPS 1/RM/15
○This analogous to a simplified or modified RATA
 □ Pass/fail criteria is ≤ 15.0% RA or 12 ppm AD (0.5% AD for O2 and CO2)

 27
PERFORMANCE EVALUATION
 FLOW-TO-LOAD

○A flow-to-load analysis is required quarterly
○The is to provide a correlation of flow analyzer data with plant
 load data
○Must be within an absolute percent difference of 10.0%
○Required to report only if >10.0%

 28
SUMMARY
Review and a conjectured look at the future

 29
SUMMARY

○Greater alignment with federal guidelines (PG/7) and
 USEPA regulations
○A clear push for better CEMS performance
○Increase in data availability
○Emphasis on data quality
○Clearer identification between guidance vs. requirement

 30
SUMMARY

○Proposed implementation date is September 1, 2019
○The new CEMS Code of Practice is still in DRAFT and is likely to
 change prior to the effective date
○The review period for the public and industry has ended
○Alberta Environment & Parks is currently reviewing comments
 received during the review period
○Questions & Comments: AEP.CEMSCode@gov.ab.ca

 31
WHAT ABOUT THE FUTURE?

○Better guidance on Predictive Emission Monitoring Systems
 (PEMS) and for intermittent facilities (peaking facilities)
○Continuous emission monitoring of particulate matter (USEPA
 PS-11)
○NH3, ethylene and EtO enforcement of performance standards
○Mass rate performance criteria
○Greenhouse Gas (GHG) monitoring
○Introduction of Bias Adjustment Factors
 32
THANKS!

 Any questions?
 You can find me at:
 c.grimm@gasl.ca
www.linkedin.com/in/charlesegrimm

 33
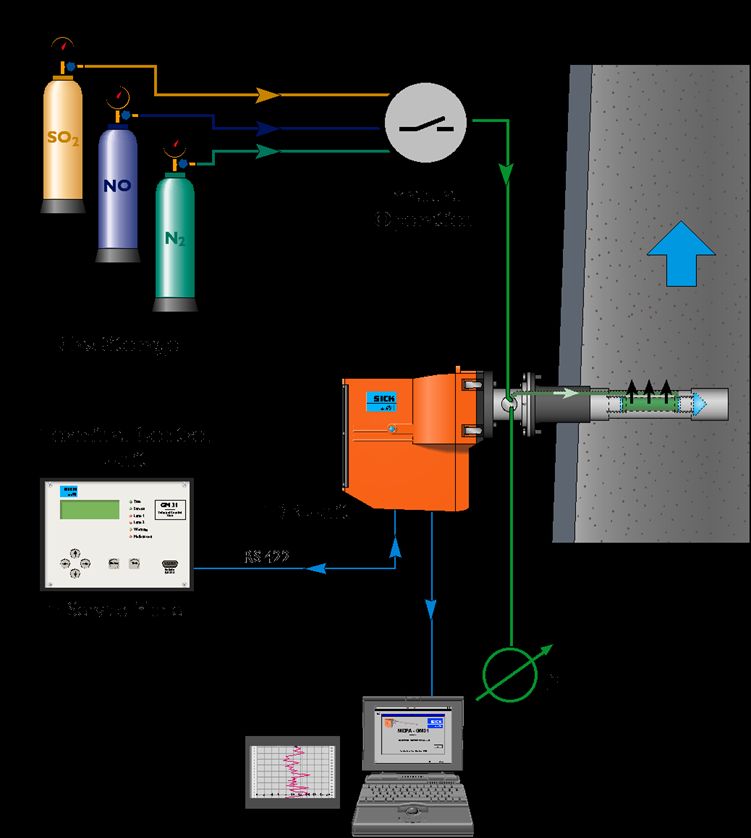
Emission monitoring methods
employed by industrial emitters
 34
“
 Alberta is facing a variety of emerging and ongoing environmental
 issues, as well as experiencing many additional internal and
external pressures requiring enhanced environmental management.

 35
Canadian Ambient Air Quality Standards
 (CAAQS)

 36
TEN LARGEST SOURCES OF NOX EMISSIONS IN ALBERTA (2014)
 NOX Emissions % of Anthropenic
 Sector Category
 (kt) Total

 Upstream Petroleum Industry (including oil sands) 343.3 50.1%
 Electric Power Generation 82.1 12.0%
 Off-road use of diesel 56.7 8.3%
 Heavy-duty diesel vehicles 51.0 7.4%
 Rail Transportation 50.9 7.4%
 Light-duty gasoline trucks 17.2 2.5%
 Chemical industry 13.5 2.0%
 Petroleum product transportation and distribution 10.2 1.5%
 Air Transportation 9.4 1.4%
 Light-duty gasoline vehicles 8.9 1.3%
Insert reference here. 37
You can also read