Research on oxygen saturation based on statistical analyses - IOPscience
←
→
Page content transcription
If your browser does not render page correctly, please read the page content below

Journal of Physics: Conference Series

PAPER • OPEN ACCESS

Research on oxygen saturation based on statistical analyses
To cite this article: Rui Tang et al 2021 J. Phys.: Conf. Ser. 1861 012003

View the article online for updates and enhancements.

                                This content was downloaded from IP address 46.4.80.155 on 06/05/2021 at 07:28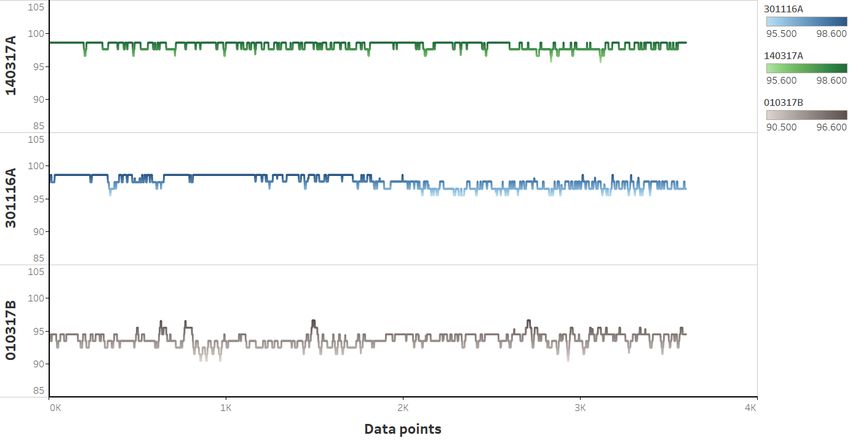
IWAACE 2021                                                                                                     IOP Publishing
Journal of Physics: Conference Series                         1861 (2021) 012003          doi:10.1088/1742-6596/1861/1/012003

Research on oxygen saturation based on statistical analyses

                     Rui Tanga, Lei Zhangb(Corresponding author), Jingjing Zengc, Lu Wangd
                     College of Mathematics and Statistics, Chongqing Jiaotong University, Nan’an,
                     Chongqing, 400074, China
                     a
                       631810040319@mails.cqjtu.edu.cn, bzhangleicqjtu@163.com,
                     c
                       631810040303@mails.cqjtu.edu.cn, d631810040321@mails.cqjtu.edu.cn

                     Abstract. We propose indicators to measure blood oxygen saturation: 1. Mean, which reflects
                     the central tendency of blood oxygen saturation; 2. Standard deviation, which reflects the
                     dispersion of SpO2; 3. Hurst exponent, which indicates whether the time series is continuous or
                     anti-continuous. Participants with nearly the same physiological characteristics except age are
                     selected from all participants, and they are divided into female and male groups for visual
                     analysis. We speculate that the SpO2 series model had a certain relationship with age.
                     Subsequently, the quantitative method is used to conduct a stepwise regression analysis by using
                     age, BMI, gender and smoking. Finally, we find that the mean of SpO2 is related to age.

1. Introduction
Since the outbreak of coronavirus COVID-19, many countries have invested a lot of resources in virus
research. As we know, infection with the new coronavirus leads to decreasing blood oxygen saturation.
    SD1 and SD2 represent the short-term variability of SpO2 and long-term variability respectively [1].
Harold Edwin Hurst, an English hydrographer, found the long-term memory of time series when
researching the water level change of the Nile in 1951. To commemorate his discovery, later generations
use the Hurst exponent to characterize the long-term memory of a time series [4]. There are some kinds
of linear regression models. Nevertheless, some of them are complicated or the results aren’t ideal.
Stepwise regression appeared in the 1960s.
    Indicators such as SD1 and SD2 are introduced to describe the variability of oxygen. Then stepwise
regression is established to analyze the physiological indexes of participants.
    This work analyzes the variability of oxygen saturation and the relationship between age and oxygen
saturation. We can provide our work to medical institutions so that patients can be treated better.

2. Materials and methods

2.1. Data
We analyze the data of 36 participants, which are about the blood oxygen saturation and some biological
information for about an hour. They can be seen in the appendix. Take 301116B as an example, his data
is shown in Fig.1.

              Content from this work may be used under the terms of the Creative Commons Attribution 3.0 licence. Any further distribution
              of this work must maintain attribution to the author(s) and the title of the work, journal citation and DOI.
Published under licence by IOP Publishing Ltd                          1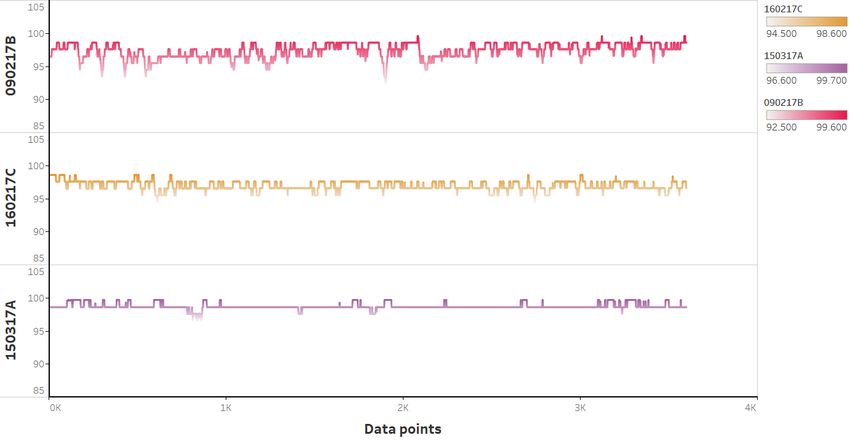
IWAACE 2021 IOP Publishing
Journal of Physics: Conference Series 1861 (2021) 012003 doi:10.1088/1742-6596/1861/1/012003
Fig.1 301116B’s oxygen saturation variability in 1 hour.
2.2. Mean and standard deviation
Mean (M) and standard deviation (SD) reflect the central tendency and the dispersion of SpO2
respectively. This work uses the arithmetic mean.
Because the change of blood oxygen saturation is complex, only using the linear method will ignore
the instantaneous change of blood oxygen saturation [2]. By referencing a large number of data, we use
the HRV nonlinear analysis method in clinical medicine to analyze the changes in blood oxygen
saturation.
The standard deviation shows the variability of the data. To be specific, it can be divided into the
standard deviation of the short-term variability (SD1) and the standard deviation of the long-term
variability (SD2) [3].
2.3. Hurst exponent
The blood oxygen saturation data of 36 individuals are regarded as non-stationary time series. It is found
that the time series of blood oxygen saturation data have a noise-like structure, and these data have a
certain trend. To better detect the self-similarity of the data, and eliminate the trend components of their
own evolution. It is necessary to find the mean of the whole series and subtract it from each series, so the
noise-like time series are converted into the random walk time series [4]. Then the detrended fluctuation
analysis is used to process the data, and the deviation series obtained is the fluctuation component [4].
When the SpO2 time series is calculated by DFA, the Hurst exponent is obtained. where H is Hurst
exponent, the range is between 0 and 1 (excluding 0 and 1). It explains the relationship between the
former trend and the latter trend of a time series, which is illustrated in Tab.1.
Tab.1 The relationship between the former trend and the latter trend.
H0.5
Negative correlation No correlation Positive correlation
2.4. Successive regression
Successive regression analysis is used to analyze age, smoking, BMI, sex, and blood oxygen saturation.
x1 and x2 can be defined as age and BMI respectively. Nevertheless, gender and smoking are not
quantitative. We define gender as x3 .
0, Male
x3 (1)
1, Female
2IWAACE 2021 IOP Publishing
Journal of Physics: Conference Series 1861 (2021) 012003 doi:10.1088/1742-6596/1861/1/012003
Because smoking has a great impact on the lungs, the more smoking, the greater the lung injury. To
express the three degrees of smoking, smoking is defined as x4 and x5 .
0, Non Smo ker
x4 (2)
1, Else
0, Ex Smo ker
x5 (3)
1, Else
Then variables are introduced one by one and be tested.
3. Results and discussions
3.1. Variability analysis
Compared with other research, multiple parameters are analyzed. The values of parameters are shown in
Tab.2.
Tab.2 301116B’s parameters.
M SD SD1 SD2 H
98.2181% 0.5001% 0.1199% 0.6971% 0.9484
The mean of SpO2 is around 98.22%, which is a healthy level. The standard deviation of SpO2 is
about 0.50%, so the variability is not strong. SD1 is less than SD2, which means the long-term
variability is stronger than the short-term variability. Hurst exponent is more than 0.5, which indicated
that the former trend and the latter trend of SpO2 are positively related. In other words, if SpO2 increased
before, it will have an increasing tendency. And if it decreased before, it will have a decreasing tendency.
Besides, we can use the same methods to analyze other participants.
In order to analyze the relationship and total variability between the mean of SpO2 and the standard
deviation of SpO2, we can get Fig.2 by taking the average SpO2 of each participant as the x-coordinate
and the standard deviation as the y-coordinate. -0.737 is the value of The Pearson correlation coefficient
between the data, which is obtained by Matlab linear fitting. Therefore, there is a negative linear
relationship between them, which shows that the overall variability is smaller at a higher SpO2 level [1].
Fig.2 The relationship between mean oxygen saturation level and total variability.
3.2. Visual analysis
By screening gender, BMI, smoking, and other information, we selected participants whose record
names are 160217C, 090217B and 150317A. They are all females who are non-smokers. As well as their
BMI is close, and the age span is large enough. They roughly match our ideal data information.
3IWAACE 2021 IOP Publishing
Journal of Physics: Conference Series 1861 (2021) 012003 doi:10.1088/1742-6596/1861/1/012003
Fig.3 Comparison of female’s oxygen saturation variability.
According to their oxygen saturation sequence diagram Fig.3, we can find that 90217B, who is the
youngest, has the highest fluctuation frequency and the largest fluctuation range, while 150317A, who is
the oldest, has the lowest fluctuation frequency and the smallest fluctuation range.
For men, we selected participants with record names as 140317A, 301116A and 010317B. They are
all male, non-smokers, BMI close, and have a large age range, which is roughly in line with our ideal
data.
Fig.4 Comparison of male’s oxygen saturation variability.
Drawing the fluctuation Fig.4 of their blood oxygen saturation data, we can find that, contrary to
women, 010317B, who is the oldest, has the highest fluctuation frequency and the largest fluctuation
range, while 140317A, who is the youngest, has the lowest fluctuation frequency and the smallest
fluctuation range. Thus, we preliminarily believe that the SpO2 has a certain relationship with age, and
maybe related to gender.
3.3. Successive regression
We perform regression analysis of age and average SpO2 and perform a t-test on it to obtain the
corresponding p-value. The p-value is found to be less than 0.05, indicating that there is a significant
4IWAACE 2021 IOP Publishing
Journal of Physics: Conference Series 1861 (2021) 012003 doi:10.1088/1742-6596/1861/1/012003
relationship. Regression analysis of smoking and SpO2 was performed, and the t-test was performed.
The p-value was found to be greater than 0.05, so this feature was screened out. Add variables
successively to perform regression analysis, and their p-values are all greater than 0.05, so they are all
screened out. The results are shown in Tab.3.
Tab.3 Coefficients of each variable.
Model t Sig.
x1 -2.648 0.012
x2 -0.410 0.685
x3 -0.967 0.340
x4 0.944 0.352
x5 0.851 0.401
According to the standard of the steps above, the stepwise regression analysis of age and SpO2
standard deviation showed that there was no significant relationship. From this, we conclude that there is
a significant relationship between age and the mean value of SpO2.
4. Conclusion
In conclusion, mean, standard deviation and Hurst exponent are used to describe SpO2. For 301116B,
the mean of SpO2 is at a healthy level. His variability of SpO2 is low, and long-term variability is higher
than short-term variability. Besides, the former trend and the latter trend of SpO2 are positively related.
Visual analysis is used to make a preliminary judgment. Then the quantitative method is used to
conduct a stepwise regression analysis by using age, BMI, gender and smoking. Finally, we find that the
mean of SpO2 is related to age.
Acknowledgments
This work was supported by the Research Project of the Fourth National Economic Census of
Chongqing (sjpktyb30).
Appendices
Participant Record
Gender Smoking Status BMI Age
No Name
1 301116B M Non-Smoker 21.7 20
2 301116A M Non-Smoker 26.5 42
3 051216A M Non-Smoker 22 20
4 081216A M Non-Smoker 23.6 20
5 101216A F Non-Smoker 24.1 45
6 101216B M Non-Smoker 26.8 49
7 101216C M Non-Smoker 23.2 22
8 121216A M Non-Smoker 20.6 20
9 121216B F Non-Smoker 23.1 21
10 230117A M Smoker 26.8 23
11 230117B F Ex-Smoker 17.9 21
12 250117A F Non-Smoker 21.3 35
13 250117B M Non-Smoker 23 20
14 250117C M Ex-Smoker 28.4 55
15 300117A F Non-Smoker 20.3 20
16 010217A F Non-Smoker 20.5 23
17 010217B F Non-Smoker 21.7 21
5IWAACE 2021 IOP Publishing
Journal of Physics: Conference Series 1861 (2021) 012003 doi:10.1088/1742-6596/1861/1/012003
18 010217C F Smoker 23.8 45
19 070217A F Non-Smoker 19.8 19
20 080217A F Non-Smoker 24.7 22
21 080217B F Non-Smoker 20.7 20
22 090217A F Non-Smoker 28.2 41
23 090217B F Non-Smoker 24.4 20
24 160217A M Ex-Smoker 24.5 60
25 160217B F Ex-Smoker 18.5 56
26 160217C F Non-Smoker 24.2 24
27 160217D M Non-Smoker 23.9 45
28 160217E F Non-Smoker 19.8 38
29 210217A M Smoker 24.6 21
30 210217B M Non-Smoker 26.7 23
31 210217C F Non-Smoker 18.9 21
32 010317A F Ex-Smoker 23.2 66
33 010317B M Non-Smoker 25.1 70
34 140317A M Non-Smoker 26.2 42
35 150317A F Non-Smoker 24.3 62
36 150317B M Non-Smoker 19.9 48
References
[1] Amar S. Bhogal and Ali R. Mani. Pattern analysis of oxygen saturation variability in healthy
individuals: Entropy of pulse oximetry signals carries information about mean oxygen
saturation[J]. Frontiers in Physiology, 2017, 8(AUG):1–9.
[2] Marek Malik, J Thomas Bigger, et al. Heart rate variability: Standards of measurement,
physiological interpretation, and clinical use[J]. European Heart Journal, 1996, 17(3):354–
381.
[3] Michael Brennan, Marimuthu Palaniswami, et al. Do existing measures of Poincare plot geometry
reflect nonlinear features of heart rate variability?[J]. IEEE Transactions on Biomedical
Engineering, 2001, 48(11):1342–1347.
[4] Bo Qian, Khaled Rasheed. Hurst exponent and financial market predictability[C]. Proceedings of
the Second IASTED International Conference on Financial Engineering and Applications,
2004:203–209.
[5] Michael D Witting, Steven M Scharf. Diagnostic room-air pulse oximetry: Effects of smoking,
race, and sex[J]. The American Journal of Emergency Medicine, 2008, 26(2):131–136.
6You can also read