THE HOMOGENEOUS CHARACTERISATION OF - HOST STARS Camilla Danielski (CEA-Saclay, IAP) - cosmos esa
←
→
Page content transcription
If your browser does not render page correctly, please read the page content below
THE HOMOGENEOUS
CHARACTERISATION OF

      HOST STARS
   Camilla Danielski (CEA-Saclay, IAP)
        camilla.danielski@cea.fr
     & the ARIEL stellar characterisation WG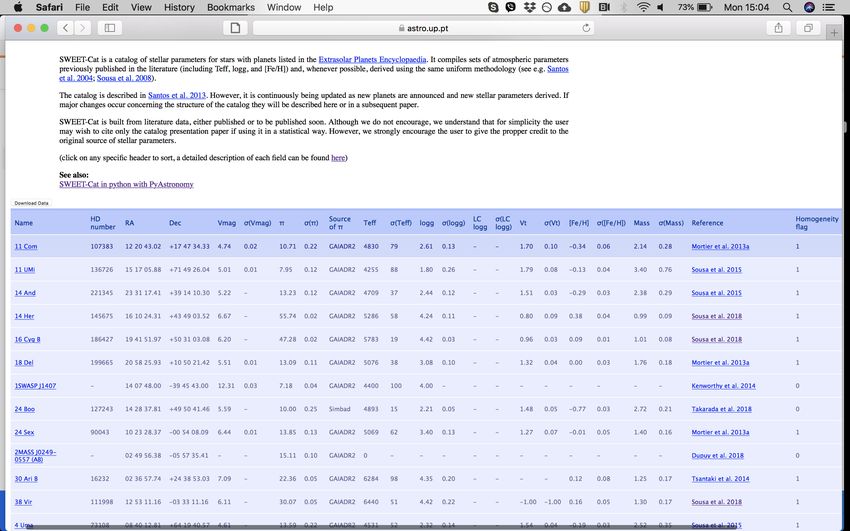
An accurate, precise and HOMOGENEOUS
determination of the fundamental properties
   of host stars is a crucial step towards a
     comprehensive characterisation of
              planetary system.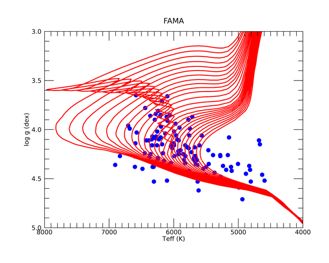
THE STELLAR CHARACTERISATION
             WG
      COORDINATOR:                                      STELLAR ABUNDANCES:
 Camilla Danielski - CEA, IAP                       Elisa Delgado Mena - IA/U. Porto

          AGE:                                           STELLAR PARAMETERS:
Tiago Campante - IA/U. Porto                            Anna Brucalassi - INAF OAA
 Germano Sacco - INAF OAA

   ACTIVITY INDICATORS:
                                                      Study on parameters precision
 Serena Benatti - INAF OAPA
                                                             through ExoSim
                                                         Giuseppe Morello - CEA
SPECTRAL DATA REDUCTION:                                 Subi Sarkar - U. Cardiff                       .40
  Monica Rainer - INAF OAA                                                                    o s t er N
                                                                                       EL LO p yS”
                                                                                    OR       TH
                                                                                G. M “ExoTE

              ARIEL: Science, Mission & Community 2020 Conference, Jan 2020, ESA/ESTEC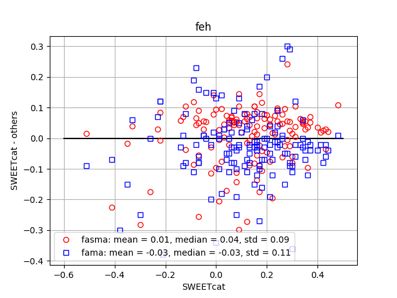
REFERENCE SAMPLE OF STARS
                                   ARIEL TIER 1
                              (Edwards et al., 2019)
                                 X
                         SWEET-CAT CATALOGUE
                          (Santos et al., 2013)
  An (incremental) catalog of stellar parameters for stars with planets.

          When == 1: parameters are derived with the same technique
          155 stars in the ARIEL target list are already homogeneously estimated
           ARIEL: Science, Mission & Community 2020 Conference, Jan 2020, ESA/ESTEC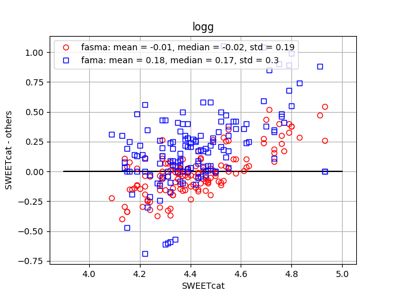
STELLAR PARAMETERS
Comparison between three different methods
1. SWEET-Cat: Santos et al. 2013
2. Fast Automatic MOOG Analysis (FAMA): Magrini et al., 2013
3. Fast Analysis of Spectra Made Automatically (FASMA): Tsantaki et al., 2018

                  Teff                                                             FeH
    < Δ > ≂ 72K                                                < Δ > ≂ 28K

                  ARIEL: Science, Mission & Community 2020 Conference, Jan 2020, ESA/ESTEC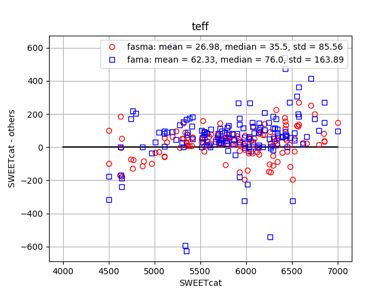
STELLAR PARAMETERS
Good agreement: Teff=5000-6500 K, log g=4.2-4.6 dex

              log(g)
                                                       External comparison will be used to
                                                       evaluate the results of the different
                                                       methods e.g. Gaia, isochrones.

    < Δ > ≂ 72K                                                < Δ > ≂ 28K

                                                                           PADOVA isochrones

                  ARIEL: Science, Mission & Community 2020 Conference, Jan 2020, ESA/ESTEC
STELLAR ABUNDANCES
The abundances of the elements Na, Al, Mg and Si was determined by both:
1. ARES —> equivalent widths (EWs): Adibekyan et al., 2012.
MOOG 2014 radiative transfer code + Kurucz stellar model atmospheres.
2. Fast Automatic MOOG Analysis (FAMA): Magrini et al., 2013
Abundances were
normalised to a Vesta solar
spectrum (HARPS, high S/N)
we provide the [X/H] ratios,
[X/H] = A(X) − A(X)⊙
absolute logarithmic abundances
ARIEL: Science, Mission & Community 2020 Conference, Jan 2020, ESA/ESTECSTELLAR ABUNDANCES
RESULTS:
Sample of homogeneous stellar abundances
for which the difference between the
methods < 2 MAD
Homogeneous catalogue of
Stars with reliable abundances: This work
Na: 91 In general
FGK stars HARPS GTO sample
Al: 86 the stars
Mg: 92 follow the
Si : 51. expected
Average errors for [X/H] is for Galactic
Na and Si: 0.06 dex chemical
Mg and Al: 0.07 dex evolution.
Figure 4: Final [X/Fe] ratios as a function of [Fe/H] (red
SYNERGY with PLANETARY FORMATION
the HARPS WG GTO 1111 FGK stars sample taken from
ARIEL: Science, Mission & Community 2020 Conference, Jan 4.
2020, ESA/ESTEC
Plans for the futureSTELLAR AGE
STATE OF THE ART: ages found in the literature are a case-by-case analysis performed by
different teams. These results in an inhomogeneous census of stars with planets.
ISOCHRONE FITTING METHOD
Bayesian code PARAM (da Silva et al., 2006; Rodrigues et al., 2014, 2017)
to determine stellar fundamental properties following a grid-based approach, whereby
observed quantities are matched to a well-sampled grid of stellar evolutionary tracks.
Observational constraints:
1. spectroscopy from SWEET-Cat (Teff and [Fe/H]),
2. astrometry from Gaia (GDR2 parallax)
3. photometry in a number of different bandpass: 2MASS (J, H, Ks),
AllWISE (W1, W2), SDSS (g,r, and i), and Tycho-2 (BT and VT).
Final list of 281/327 stars with age determination (Bossini et al., in prep.)
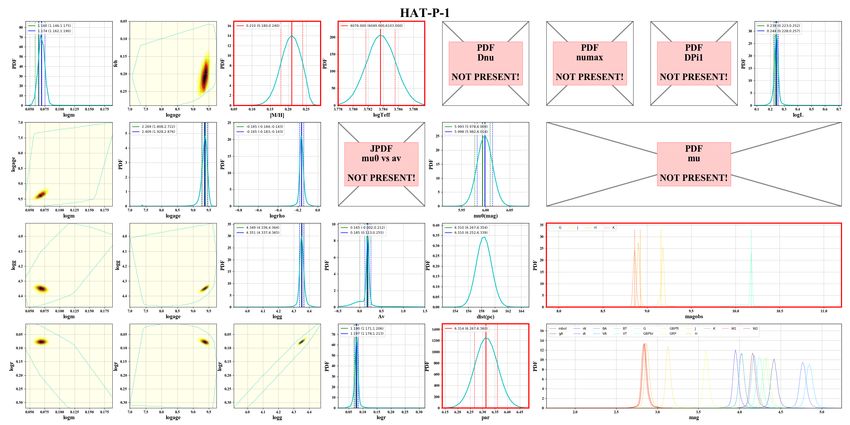
ARIEL: Science, Mission & Community 2020 Conference, Jan 2020, ESA/ESTECSTELLAR AGE (Bossini et al., in prep.)
Posterior PDFs and associated Bayesian credible regions of a number of
stellar properties (e.g., age, mass, and radius), as well as their joint distributions.
Framed in red are the posterior PDFs of those parameters used as observational constraints.
ARIEL: Science, Mission & Community 2020 Conference, Jan 2020, ESA/ESTECSTELLAR AGE AND MASS
AGE MASS
(Bossini et al., in prep.)
Av error = 26 % Av error = 3.1 %
2
FRACTIONAL DIFFERENCE %
Figure 11: Histograms of the estimated ages (left panel) and masses (right panel) of stars in the target sample having
valid estimated ages (i.e., ⌧ < 13.8 Gyr). The median of the posterior PDF for each star and property has been adopted
as single-point estimate.
Comparison with the literature
latest version of the ARIEL target list (Edwards et al., 2019b) mostly relies on TESS simulated (or predicted) hosts for
covering the M-type cohort.
The median relative error on the estimated stellar ages and masses is of 26 % and 3.1 %, respectively (where we
Percentage fractional difference in age as
have considered the 68.3 % credible regions of the individual PDFs or 1 equivalent). There is no apparent correlation
between the magnitude of the relative error and absolute value in both cases.
gyrochronology a function of the age reported in the
The overall precision quoted above is merely statistical in nature and does not account for internal systematics
arising from the different input physics used to construct stellar models. To assess the impact of adopting different
isochrone fitting literature for a subsample of 65 stars.
input physics in the models, we conducted a preliminary test in which PARAM was rerun twice for each target6,
using two grids of stellar evolutionary tracks, one computed with PARSEC and the other with MESA7 (Paxton et al.,
µ = 8 %, σ = 45 %.
2011). The two grids consider different solar compositions, which means slightly different Z and Y , and a different
AGE LITERATURE
mixing-length parameter, with[Gyr]
a resulting impact on the age. Furthermore, we adopted a fixed overshooting parameter
(with in
Figure 12: Percentage fractional difference a value
age asof 0.2) in the
a function MESA
of the models in
age reported regardless of the
the literature forstellar mass, while the overshooting parameter increases
a subsample
of 65 stars. Red and blue dots represent ages derived by means of isochrone fitting and gyrochronology, respectively. This has an impact on the lifetime in the
from 0 to the maximum in a defined mass range in the PARSEC models.
The solid horizontal line indicates the main
bias (µsequence for many
= 8 %), while stars is
the scatter in represented
the sample.byThis preliminary
the dashed lines ( test led%).
= 45 to internal systematics on the estimated stellar
SYNERGY with UPPER ATMOSPHERE/STAR-PLANET INTERACTION WG
ages and masses of 16 % and 1.9 %, respectively (described as the scatter between the PARSEC and MESA estimates).
These systematics are commensurate with the quoted statistical precision and cannot therefore be neglected.
4.4.4 Mass: Comparison with the SWEET-Cat
ARIEL: Science, Mission & Community 2020 Conference, Jan 2020, ESA/ESTEC
As a sanity check, we further compared the stellar
4.4.3 Age:masses estimatedwith
Comparison in this
thework with those listed in the SWEET-Cat.
literatureSTELLAR ACTIVITY INDICATORS
1. Activity level from CaII H&K lines t er N.6
O pos
UN
(3933.664 and 3968.470 Å) : through G . BR
the Mt Wilson S index and converted
to the log R′HK when colour
information was available.
2. CCF Asymmetry indices
(Lanza et al. 2018)
can be used to define the effects of the
activity on the stellar spectral lines due
to processes occurring in the
photosphere Figure 14: Effective temperature vs. V magnitude of our sample. The average log RHK
0 target is indicated by the marker
size. Triangles and crosses correspond to targets with average SNR< 5 spectra and to > 2 observed variations in the
S-index, respectively. Colours indicate derived stellar ages.
3. Rotation periods From the average S index, we derived the average log RHK0 whenever a colour index within the range of validity for
the conversion was available. From such index, we estimated the stellar age using Mamajek & Hillenbrand (2008)’s
SuperWASP survey and HATNet database. Good agreement between the
empirical relation.
In Figure 14, our sample is presented in an effective temperature vs. V magnitude plot (only targets with an
available V magnitude are included). The average activity level (obtained by averaging the activity indices measured
Periodograms & ACF rotation period obtained
on individual spectra) is shown by the marker size: log RHK ⇠ 5 corresponds to a negligible activity level, and
0
log RHK
0 ⇠ 4 indicates a very active star. Circles indicate targets whose average SNR is larger than 5, while triangles
indicate an average SNR< 5 (and therefore a less reliable measure). Red crosses indicate targets with > 2 S index
variations (which can however be explained with low SNR and small statistics). Finally, colours represent the stellar
from the 3 methods
age in Gyr derived from the average activity index.
ARIEL: Science, Mission & Community 2020 Conference, Jan 2020, ESA/ESTEC
23OBSERVATIONAL CAMPAIGN
1. NORTHERN HEMISPHERE —> TNG/HARPS-N (3.6 m)
2. SOUTHERN HEMISPHERE —> UVES (8 m):
Programme accepted P105, Program ID 105.20P2
20 V>12 - stars with no high precision characterisation yet
Abundances precision errors: < 0.05 dex for S/N > 150
> 0.1 dex for S/N < 100
3. Monitoring with Telescope Live: Global network of robotic telescopes
for stellar rotational periods
4. Testing simultaneous photometric and spectroscopic observation of one/
two targets.
ARIEL: Science, Mission & Community 2020 Conference, Jan 2020, ESA/ESTECSUMMARY
1. Benchmarking the stellar parameters determination methods
to find an optimal method analysis depending by the stellar
sample
2. Homogenous list of abundances for ARIEL stars.
3. Homogenous list of ages for ARIEL stars and validating results
with empirical methods
4. Determination of activity indicators with various methods
5. Telescope campaigns north and south
Global and homogeneous approach to planet-hosts is
extremely useful for the whole exoplanet community
ARIEL: Science, Mission & Community 2020 Conference, Jan 2020, ESA/ESTECYou can also read