The relation between total column ozone with UV radiation and CO 2 concentration on the island of Kalimantan during the Covid-19 Pandemic
←
→
Page content transcription
If your browser does not render page correctly, please read the page content below

Journal of Physics: Conference Series

PAPER • OPEN ACCESS

The relation between total column ozone with UV radiation and CO2
concentration on the island of Kalimantan during the Covid-19 Pandemic
To cite this article: R Adriat et al 2021 J. Phys.: Conf. Ser. 1816 012079

View the article online for updates and enhancements.

                                This content was downloaded from IP address 46.4.80.155 on 01/04/2021 at 10:53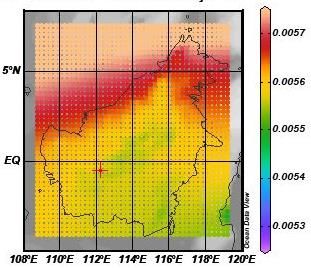
The 10th International Conference on Theoretical and Applied Physics (ICTAP2020)           IOP Publishing
Journal of Physics: Conference Series             1816 (2021) 012079 doi:10.1088/1742-6596/1816/1/012079

The relation between total column ozone with UV radiation
and CO2 concentration on the island of Kalimantan during
the Covid-19 Pandemic

                     R Adriat1, Nurhasanah2 and R Perdhana1

                     1
                       Geophysics Department, Mathematics and Science Faculty, Tanjungpura University,
                     Pontianak, West Borneo, Indonesia
                     2
                       Physics Department, Mathematics and Science Faculty, Tanjungpura University,
                     Pontianak, West Borneo, Indonesia

                     E-mail: rizaadriat@physics.untan.ac.id.

                     Abstract. The concentration of ozone in the ozone layer is minimal, but it means a lot to live.
                     The total amount of column ozone varies, mainly influenced by solar radiation and
                     anthropogenic activity. In this study, the total column ozone during the Covid-19 pandemic,
                     and the effect of UV radiation and CO2 concentration on Kalimantan's island was reviewed.
                     Based on the research results, it can be seen that on Borneo's island in September and October
                     2019, the total column ozone reached 0.0056 J/m2. From November 2019 to March 2020, the
                     total amount of column ozone decreased to 0.005 J/m2. The total amount of column ozone
                     increased in April 2020 but declined in May 2020, and from June to September 2020, it
                     increased to reach 0.006 J/m2. The numbers are related but not significant with UV radiation
                     (correlation 0.25) and CO2 concentration (correlation -0.40). It can be concluded that UV
                     radiation and anthropogenic activity affect the total column ozone.

1. Introduction
In December 2019, a new coronavirus disease, Covid-19, was reported in Wuhan, China [1]. Covid-19
was confirmed to be transmissible from human to human, so it received significant attention from the
WHO (World Health Organization). The previous outbreak, SARS (Severe Acute Respiratory
Syndrome), is gradually disappearing due to the summer that appears in July. Several previous studies
also reported that Covid-19 is also related to meteorological factors [2]. This research is of concern,
the results show a relationship between Covid-19 and air temperature, humidity, and latitude.
However, more empirical evidence is needed concerning this in terms of preparations and strategies
that can be taken in the future [3].
    Several studies have also explained the possible link between latitude and vitamin D deficiency and
death from Covid-19 [4]. Vitamin D is greatly influenced by ozone variability because ozone filters
UV-B radiation from the sun, an essential vitamin D synthesis [5]. Therefore, it is necessary to know
and map the ozone concentration during the range of Covid-19 incidence in Indonesia. The
relationship between the total column ozone (TCO), carbon dioxide, and UV radiation is a major
challenge associated with global warming. Many human activities result in the release of carbon
dioxide into the atmosphere, causing the total ozone column to decrease. This then causes the increase
in UV radiation that can enter the Earth's surface. Kalimantan Island is one of the islands located on
              Content from this work may be used under the terms of the Creative Commons Attribution 3.0 licence. Any further distribution
              of this work must maintain attribution to the author(s) and the title of the work, journal citation and DOI.
Published under licence by IOP Publishing Ltd                          1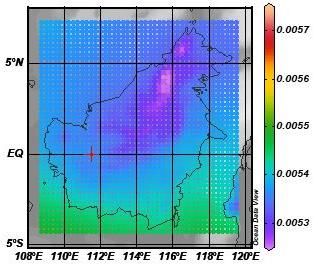
The 10th International Conference on Theoretical and Applied Physics (ICTAP2020) IOP Publishing
Journal of Physics: Conference Series 1816 (2021) 012079 doi:10.1088/1742-6596/1816/1/012079
the equator, so that it will receive a very high intensity of solar radiation. Of course, high solar
radiation will also cause high incoming UV radiation. Kalimantan Island itself is an island that is quite
active in producing carbon dioxide. Carbon dioxide is produced from coal mining activities and land
and forest fires. Based on the research that has been done, this study identifies the relationship
between the total ozone column to solar radiation and carbon dioxide concentrations in the Kalimantan
region during the Covid-19 pandemic.
2. Method
The data used in this study is the total data of the ozone column, ozone concentration, UV radiation,
and in the Kalimantan region from September 2019 to September 2020, downloaded on ECMWF
(European Center for Medium-Range Weather). The method used is the descriptive analysis method to
determine the relationship between parameters using the correlation coefficient value (eq. 1). Mapping
is done using the Kriging interpolation method.
n xy x y
r (1)
n x x n y y
2 2 2 2
3. Result and Discussion
3.1 Total Column Ozon and UV Radiation
After averaging the total ozone column and UV radiation in the Kalimantan area, it can be seen in
Figure 1 that there is no clear pattern of the relationship between the total ozone column and UV
radiation. The TCO variability is influenced by 1-2% of solar radiation activity, where the energy
emitted by solar radiation also affects the TCO variability. UV radiation itself has a maximum value of
2 times a year, namely in March and September. The sun's position causes the UV radiation pattern, of
course, at the equinox, causing the incoming radiation to be greater than other months. Likewise, for
the effect of UV radiation on TCO, UV radiation only has a small effect on the TCO value. UV rays
more influence the TCO value when entering the summer (dry) [6]. The greater the radiation energy
emitted, the higher the effect on the TCO value [6]. The total ozone column increased when the
Indonesian territory began to apply PSBB (Pembatasan Sosial Berskala Besar) from March 2020 to
July 2020. The increase in the total ozone column had increased previously from March 2018 to
August 2018. This is possible because of aerosols' greater influence in the atmosphere, direct solar
radiation or UV rays.
3.2 Total Column Ozon and CO2 Concentration
The carbon dioxide concentration itself appears to have a clear annual pattern. It can be seen that the
concentration always decreases starting in May before increasing again in August. However, every
year's average value must always increase, meaning that carbon dioxide has increased every year. The
concentration of CO2 released into the air is strongly influenced by anthropogenic activities, namely
the combustion of biomass, coal, and petroleum. Also, the decay rate of CO2 gas is prolonged, causing
CO2 to increase its concentration level [7]. Figure 2. shows that when there is a decrease in carbon
dioxide concentration, it will be followed by an increase in the total ozone column. This occurred from
May to August 2018 and May to August 2019, followed by the rise in the total ozone column.
Likewise, for the current pandemic conditions, carbon dioxide concentrations have decreased from
April to June 2019, followed by an increase in the total ozone column. The association between total
ozone column and carbon dioxide concentration was more transparent, although it did not significantly
affect. The decrease in carbon dioxide concentration is, of course, caused by reduced anthropogenic
activity [8]. Previous studies that have been conducted have shown that concentration has an inversely
proportional relationship with TCO. The more CO2 gas, the more O3 gas is released to retain less UV
radiation in the ozone layer [7].
2
The 10th International Conference on Theoretical and Applied Physics (ICTAP2020) IOP Publishing
Journal of Physics: Conference Series 1816 (2021) 012079 doi:10.1088/1742-6596/1816/1/012079
0.0062 300
x 10000000
0.006
250
Total Column Ozone (J/m2)
0.0058
UV Radiation (J/m2)
0.0056 200
0.0054
150
0.0052
0.005 100
0.0048
50
0.0046
0.0044 0
Jul-18
Jul-19
Jul-20
Nov-17
Jan-18
Mar-18
May-18
Nov-18
Jan-19
Mar-19
May-19
Nov-19
Jan-20
Mar-20
May-20
Sep-17
Sep-18
Sep-19
UV TCO
Figure 1. Graph of the relationship between Total Ozone Column and UV Radiation
0.0062 416
0.006 414
412
Total Column Ozon (J/m2)
0.0058
410
0.0056
408
CO2 (ppm)
0.0054
406
0.0052
404
0.005
402
0.0048 400
0.0046 398
0.0044 396
Jul-18
Jul-19
Jul-20
Nov-17
May-18
Nov-18
May-19
Nov-19
May-20
Sep-17
Jan-18
Mar-18
Sep-18
Jan-19
Mar-19
Sep-19
Jan-20
Mar-20
CO2 TCO
Figure 2. Graph of the relationship between Total Ozone Column and CO2 Concentration
Based on the correlation value from September 2017 to August 2020, the total ozone column has a
correlation value of 0.36 to UV radiation and -0.27 to carbon dioxide concentration. If it was
correlated during the pandemic conditions, from December 2019 to July 2020, the total ozone column
against UV radiation and carbon dioxide concentration was 0.25 and -0.4, respectively. This means
that the ozone concentration has a relationship with the total ozone column even though the effect is
not significant enough.
3The 10th International Conference on Theoretical and Applied Physics (ICTAP2020) IOP Publishing
Journal of Physics: Conference Series 1816 (2021) 012079 doi:10.1088/1742-6596/1816/1/012079
Total Ozone Column Mapping
(a) (b)
Figure 3. Total ozone column in Kalimantan region in February 2020 (a) and July 2020 (b)
Based on Figure 3 obtained with the software and using kriging method, the difference in the ozone
column’s total value in the Kalimantan region can be seen. Before implementing the PSBB, namely in
February 2020, the ozone column's average total value in the Kalimantan region was 0.0054 J/m2.
Meanwhile, after implementing the PSBB, namely in July 2020, there was an increase in the total
ozone column to reach 0.0056 J/m2. It also shows that the distribution of TCO values is influenced by
the orbit of the sun. In April - August (Summer Solstice), the sun tends to be in the northern part of the
earth, while in October - February (Winter Solstice) the sun tends to be in the southern part. This
shows the influence of PSBB, in this case, anthropogenic activity on the total ozone column.
4. Conclusion
The total ozone column was related to carbon dioxide concentration, although it was not significant
enough based on the correlation value obtained. The total ozone column has a correlation value with
carbon dioxide concentrations of -0.27 (September 2017-July 2020) and -0.4 during the pandemic
(December 2019-July 2020). Meanwhile, the total ozone column has no apparent correlation with UV
radiation with a correlation value of 0.36.
References
[1] Wu F, Zhao S, Yu B, Chen Y, Wang W, Song Z, Hu Y, Tao Z, Tian J, Pei Y, Yuan M, Zhang
Y, Dai F, Liu Y, Wang Q, Zheng J, Xu L, Holmes E C and Zhang Y 2020 New Coronavirus
Associated with Human Respiratory Disease in China Nature 579 (7798), 265–269
[2] Ma Y, Yadong Z, Jingtao L, Xiaotao H, Bo W, Shihua Fu, Jun Y, Jingping N, Ji, Zhou and Bin
L 2020 Temperature Range and Mortality in East Asia Science of the Total Environment,
539 313–321
[3] Fallah G G and Mayvaneh F 2016 Effect of Air Temperature and Universal Thermal Climate
Index on Respiratory Diseases Mortality in Mashhad, Iran Arch. Iran. Med. 19 (9), 618–624
[4] Olds W J, Moore M R and Kimlin M G 2006 Vitamin D Synthesis by UV Radiation: the
Importance of Ozone Monitoring AGU Fall Meeting Abstracts.
[5] Alipio M 2020 Vitamin D Supplementation Could Possibly Improve Clinical Outcomes of
Patients Infected with Corona virus-2019 (COVID-2019), Available at
SSRN:https://ssrn.com/abstract=3571484
[6] Zerefos C S, et al 1997 Solar activity-total column ozone relationship: Observation and model
studies with heterogeneous chemistry Journal of Geophysical Research 102, 1561-1569.
4The 10th International Conference on Theoretical and Applied Physics (ICTAP2020) IOP Publishing
Journal of Physics: Conference Series 1816 (2021) 012079 doi:10.1088/1742-6596/1816/1/012079
[7] Mawg S R, et al 2019 Investigate the Effect of Global Carbon Dioxide on the Total Column
Ozone and Temperature in the Stratosphere above Baghdad Indian Journal of Natural
Science 9
[8] Cubasch U, Yihui D, Cecilie M, Abdalah, Mokssit, Thomas P and Michael P 1998 Historical
Overview of Climate Change Science Intergovernmental Panel Climate Change.
5You can also read