Our Future World Trends, Risks and Scenarios - Stefan Hajkowicz and James Moody
←
→
Page content transcription
If your browser does not render page correctly, please read the page content below
Our Future World
   Trends, Risks and Scenarios

Stefan Hajkowicz and James Moody
With input from over 50 CSIRO scientists and business analysts
Thinking about the future in the past…

A CSIR Council Meeting in 1935      How would their world change?

                                    Darwin, 19 February 1942

                                    Australian War Memorial www.awm.gov.au

                                                        Suburbia

National Museum of Australia
Everyone wants to know
               Study published –
           Background               rapid
                               in the           growth
                                      Harvard Business Review in in
                                                                 2007 planning
                          Survey of 8,500 global executives and 25 futuristic planning tools.
                          Finds rapid growth in demand for these tools post September 11 as corporations need to handle
                          an increasingly volatile world.

 Rigby, Bilodeau, 2007. Harvard Business Review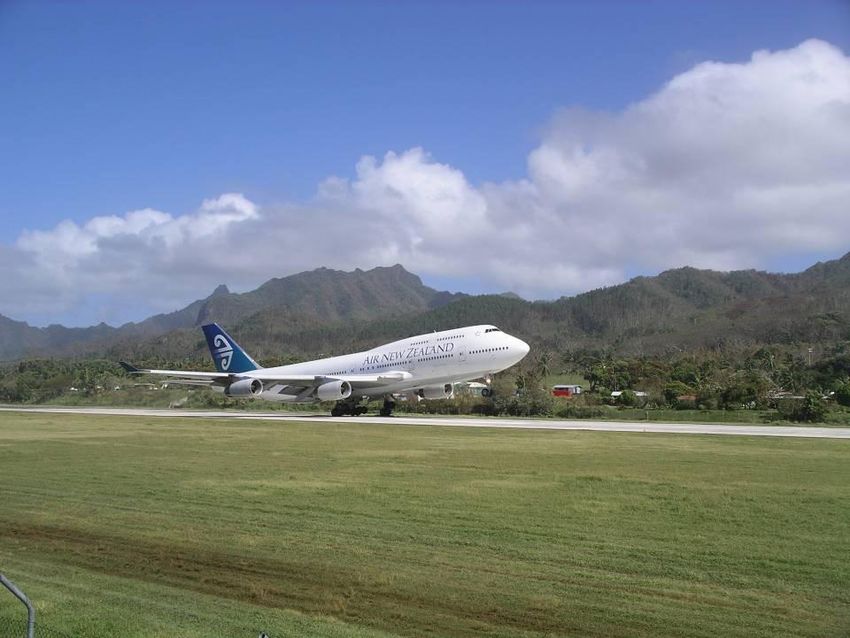
Different futures
      Different Types of Futures

  Voros (2003) adapted this diagram from Hancock and Bezold (1994) in the Healthcare Forum Journal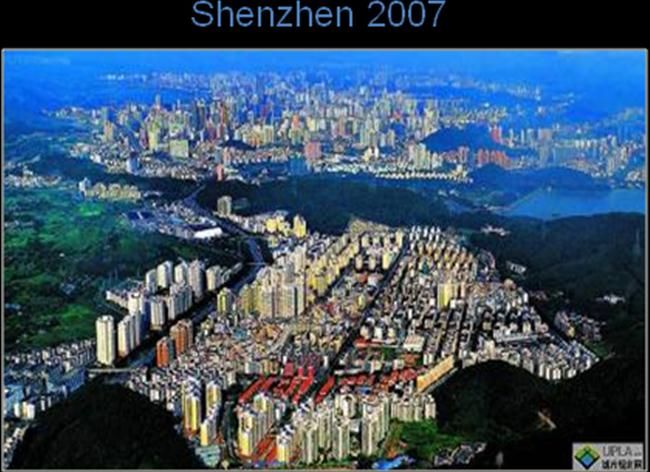
More than forecasting…
    It’s More than Forecasting

 Lynch, 2002. The Quarterly Review of Economics
 and Finance.
                                                  Actual oil price (other lines show predictions)
The Megatrends
                                 More from less
                                  a world of limited
                                     resources

         i World                                       A personal touch
         Digital and                                   Personalisation of
           natural                                     products and services
        convergence

               On the move                               Divergent
                Urbanising and                         demographics
                  increased                             Older, hungry and
                   mobility                             more demanding
More from less
 a world of limited
    resources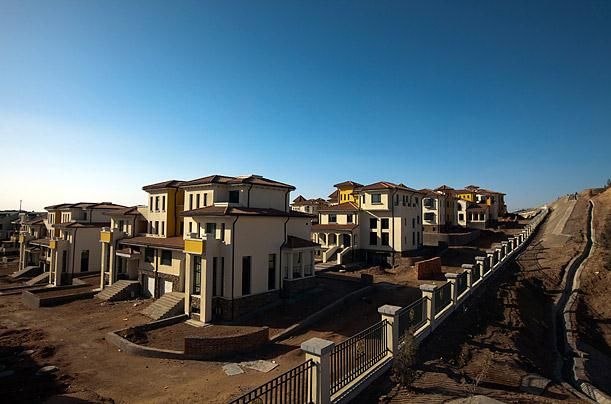
More from less
     Declining ore grades
Production of ore

                                                   Grade of ore

Source: Mudd GM, 2009. The Sustainability of
Mining in Australia: Key Production Trends and
Their Environmental Implications for the Future.
Department of Civil Engineering, Monash
University and Mineral Policy Institute.
More From Less
Mining above the ground?
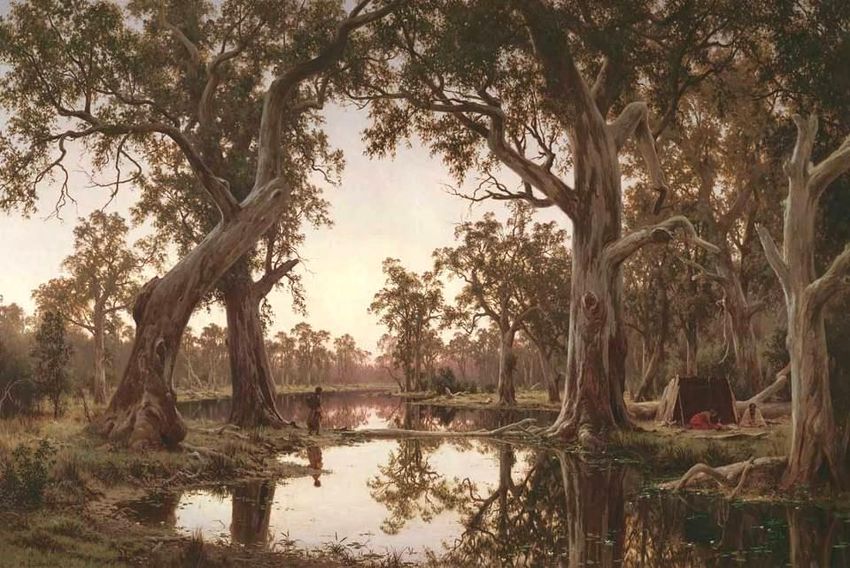
Evening shadows, backwater of the Murray, South Australia
H J Johnstone, Britain/Australia, 1835-1907, 1880, London
Source: The Art Gallery of South Australia
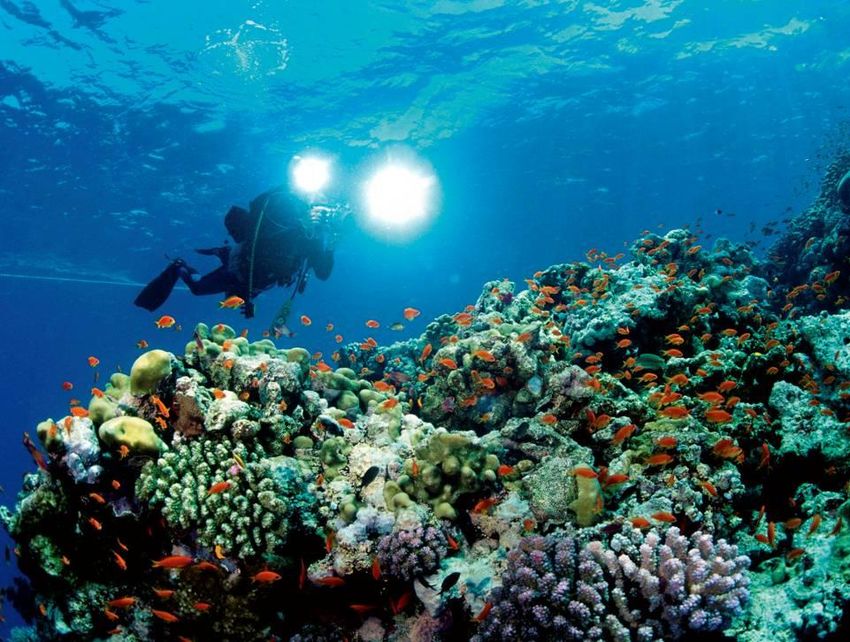
Some of the world’s leading coral reef scientists estimate that by
             2030 60% of existing coral reefs will be destroyed.

                            Data source: Hughes et al. (2003) Science. Vol 301
                                              Image source: Microsoft Clipart
Countries which share rivers have a statistically higher
probability of military disputes. If the river basin is under
drought stress the chances of war are higher again.
Source: Gleditsch et al. (2006) Political Geography Vol 25.
Image source: Microsoft ClipartThree lines that matter …
500 More Volatile
Global Price Indices
450
Energy
400 Agriculture
Metals & Minerals
350
300
Index
250
200 Less Volatile
What
150 Next?
100
50
0
1990
1992
1994
1996
1998
1999
2000
2001
2002
2003
2005
2007
2009
2011
1991
1993
1995
1997
2004
2006
2008
2010
Year
Data source: World Bank, 2011A personal touch Personalisation of products and services
A personal touch
Share of Services in Whole Economy    Personalisation of products and services

                                                                                                          Australia

                                                                                    Source: The Australian, IT News, 7 October 2009

                                     Source: PMSEIC Report on Services Innovation
It is estimated that 30% of a typical workday is lost processing irrelevant information. And 42% of people admit to using the wrong information at least once a week. Source: Basex survey, published by Xerox Image source: Microsoft Clipart
The debt to asset ratio rose from 9% to 19% from 1990 to 2008. Australians now
hold A$1.1 trillion worth of debt.

Source: Australian Bureau of Statistics (2009; Cat No 4102.0)
Image source: Microsoft Clipart
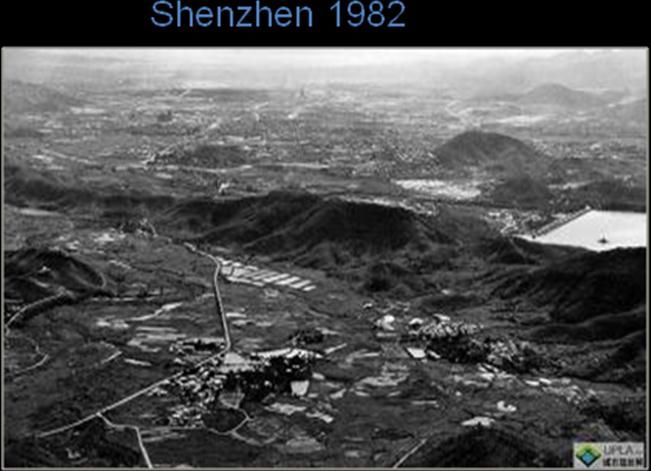
On the move
Urbanising and
  increased
   mobility
China needs to build 3 cities larger than Sydney every year until 2030 to
     accommodate rural to urban migration.

Image source: The Chinese UPLA urban planning network, http://www.upla.cn
Statistic derived from analysis of the United Nations, World Urbanization Prospects, The 2007 Revision Population Database
Don’t wait up. I’m stuck in traffic and I’ll be 2 weeks late getting home.
Source: The Economist, Aug 26, 2010Ordos, China. A Modern day Ghost Town
Source: Time MagazineJet aircraft passengers worldwide travelled 4,621 billion kilometres in 2008 and this is forecast to rise to 12,090 billion by 2028. This represents growth of 5% per year compared to global GDP of 3% per year. Data source: Boeing Current Market Outlook 2009-2028 Image source: Stefan Hajkowicz
Divergent
demographics
Older, hungry and
more demanding
In 2005 5% of Indian citizens were middle class.

It is forecast to be 20% by the year 2015 and 40% by the year 2025.

                                     Data source: The Economist, 12 Feb 2009
                                               Image source: Microsoft Clipart
The world must produce more food in the next 50 years than in the
previous 500 years if it is to feed itself.
Data source: Dr Brian Keating, CSIRO Sustainable Agriculture Flagship
Image source: Microsoft ClipartDown
Up
World food prices (Source: World Bank Agricultural Price Index 2000=100, US$ year 2000)In 2002 13% of Australians were over 65 years old. It will be 27% by 2051. Data source: Australian Bureau of Statistics (Cat. No. 3222.0)
Divergent demographics
     Shift towards chronic illness

Worldwide cause of death is shifting towards non-communicable diseases and accidents and away from infectious
disease (Source: WHO, 2008; p8)
i World Digital and natural convergence
Every device connected to the internet needs a unique IP address. After 40 years we consumed 90% of 4 billion IP addresses. A new system is planned which can accommodate 3.4×1038 unique addresses. Data source: ICANN (2007) Factsheet Ipv6 – The Internet’s vital expansion
i World
 Digital and
   natural
convergence
Last year’s mobile data traffic
was three times the size of the
 entire global Internet in 2000
By 2015…

There will be 788 million mobile only
internet users

And 138 million people will have mobile
internet access but no electricity
connection at home.
Mobile Data Traffic
Disruptive Technologies
1. Automated mining
Fields                  Fences
         2. Electric travel

         3. Energy efficient desalination

         4. Smarter Smartphones

         5. Augmented reality
6. Systemic risk analysis 7. Telomerase (biological cell immortality) 8. Deep brain stimulation 9. Artificial Intelligence 10. Natural language processing
Thank you
                                      Contact Us
         Phone: 1300 363 400 or +61 3 9545 2176
      Email: enquiries@csiro.au Web: www.csiro.au
You can also read