OHSU COVID FORECAST EDITION: 9/9/2021 - PETER GRAVEN, PHD; OFFICE OF ADVANCED ANALYTICS, BIAA, ITG
←
→
Page content transcription
If your browser does not render page correctly, please read the page content below

OHSU COVID Forecast
Edition: 9/9/2021

Peter Graven, PhD; Office of Advanced Analytics, BIAA, ITG
Key Outcomes

2
Hospitalized Patients
As of 9/8/2021, the statewide census
was 1,138.

 3    Source: https://public.tableau.com/profile/oregon.health.authority.covid.19#!/vizhome/OregonCOVID-
      19HospitalCapacitySummaryTables_15965754787060/HospitalizationbySeveritySummaryTable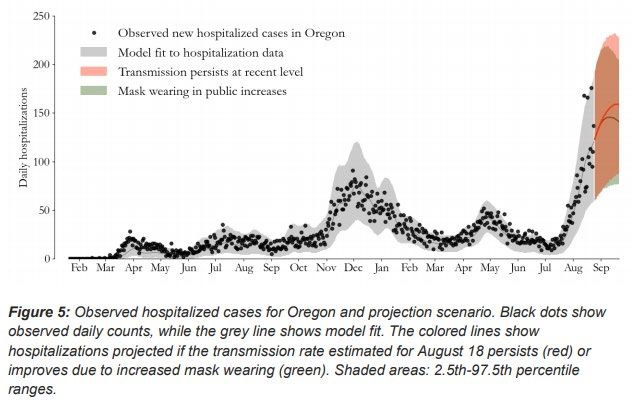
Regional Hospital Census
Regions 5 and 3 are showing
decreases.

Regions 6, 7, and 9 are flat

Regions 1 and 2 are showing slight
increases.

  4
       Source: https://public.tableau.com/profile/oregon.health.authority.covid.19#!/vizhome/OregonCOVID-19HospitalCapacity/BedAvailabilitybyRegion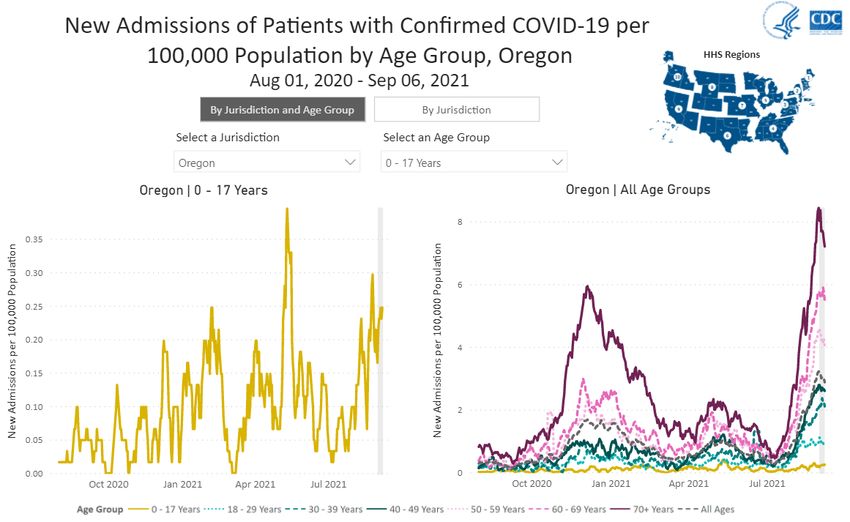
Hospital Census by US Region
The South and West are showing
accelerating increase.

The Midwest is showing minor
increases in hospital census.

The Northeast is showing slight
increase at very low levels.

  5
      Source: https://carlsonschool.umn.edu/mili-misrc-covid19-tracking-project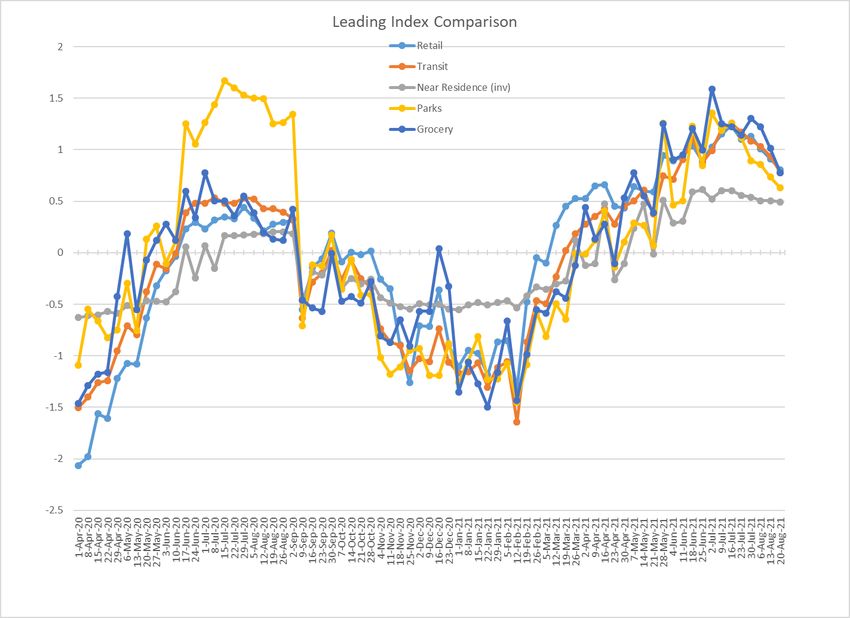
Oregon Hospital Capacity
As of 9/8, 50% of occupied ICU beds                                                                                                                                           Share of Occupied w/COVID
                                                                                                                                                             Region            ICU     Non-ICU Total
are filled with COVID patients.
                                                                                                                                                                1                36%       17%      20%
                                                                                                                                                                2                39%       22%      24%
Note: Percentages over 100% occur if                                                                                                                            3               166%       25%      33%
the COVID counts are more than total                                                                                                                            5               109%       32%      42%
beds minus available beds                                                                                                                                       6                13%       15%      15%
                                                                                                                                                                7                34%       26%      27%
                                                                                                                                                                9                44%       16%      22%
                                                                                                                                                              Total              50%       21%      25%

 6
              Source: https://public.tableau.com/profile/oregon.health.authority.covid.19#!/vizhome/OregonCOVID-19HospitalCapacitySummaryTables_15965754787060/HospitalizationbySeveritySummaryTable
Oregon Hospital Capacity
This chart shows that while, there are
some beds listed as “available”, they
are likely not truly available since
COVID patients are crowding out
Other patients in the last month.

These data are based on HOSCAP
reports.

 7
              Source: https://public.tableau.com/profile/oregon.health.authority.covid.19#!/vizhome/OregonCOVID-19HospitalCapacitySummaryTables_15965754787060/HospitalizationbySeveritySummaryTable
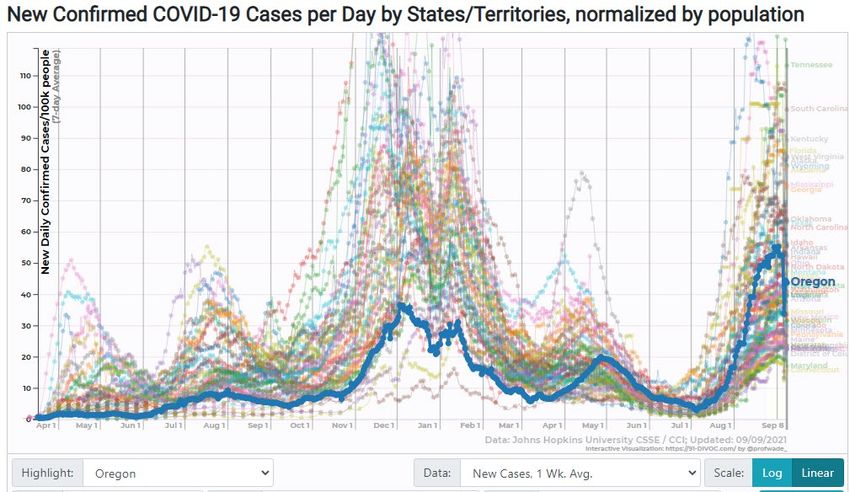
New Cases per Capita
Case rates are showing continued
signs of leveling in the last week.

Oregon dropped to 24th in the
number of new cases per day.

 8      Source: http://91-divoc.com/pages/covid-visualization/
Cases by Vaccination Status
As of 9/2, the ratio of cases for
unvaccinated to vaccinated is
approximately 7:1.

 9
        Source: https://www.oregon.gov/oha/covid19/Documents/DataReports/Breakthrough-Case-Report.pdf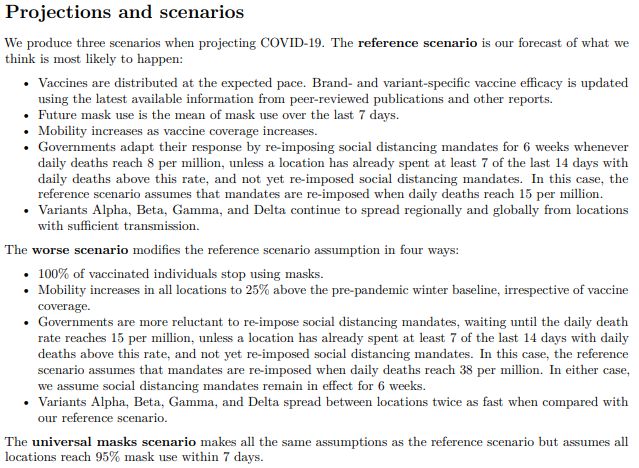
Admits by Vaccination Status
As of 9/2, breakthrough
hospitalizations and deaths
remain very rare among
breakthrough cases.

 10
       Source: https://www.oregon.gov/oha/covid19/Documents/DataReports/Breakthrough-Case-Report.pdf
Hospitalization Rate
For the most recent week (8/15-8/21)
of complete data, the hospitalization
rate is 4.4%.
This represents a return to previous
rates of hospitalization.
11 Source: https://public.tableau.com/profile/oregon.health.authority.covid.19#!/vizhome/OregonHealthAuthorityCOVID-
19SummaryTable_15889676399110/OregonsEpiCurveSummaryTableTest Positivity
Test positivity dipped slightly this
week.
The most recent complete week
(8/29/21-9/4/2021) had a test
positivity of 11.1%.
12 Source: https://public.tableau.com/profile/oregon.health.authority.covid.19#!/vizhome/OregonHealthAuthorityCOVID-
19DataDashboard/OregonsCOVID-19ELRsOverTimeTotal Tests
Testing has peaked at levels similar to
fall/winter surge.
13 Source: https://public.tableau.com/profile/oregon.health.authority.covid.19#!/vizhome/OregonHealthAuthorityCOVID-
19DataDashboard/OregonsCOVID-19ELRsOverTimeReview of Leading Indicators 14
Leading Indicators Comparison
Several metrics of activity
are decreasing or are flat in
Oregon.

While still above previous
pandemic levels, the change
may represent changes in
behavior to avoid COVID.

15
     Source: SDI from: https://data.covid.umd.edu/
      DEX from https://github.com/COVIDExposureIndices/, Google mobility reports from https://www.google.com/covid19/mobility/
Higher Risk Behaviors
In Oregon, there are continued
moderate declines in time w/others,
restaurant and large events indoors
since 8/13.
Note:
• Estimated percentage of respondents who
went to an “indoor market, grocery store,
or pharmacy” in the past 24 hours.
• Estimated percentage of respondents who
went to an indoor “bar, restaurant, or cafe”
in the past 24 hours.
• Estimated percentage of respondents who
“spent time indoors with someone who isn’t
currently staying with you” in the past 24
hours.
• Estimated percentage of respondents who
“attended an indoor event with more than
10 people” in the past 24 hours
16
Source: https://covidcast.cmu.edu/Mask Wearing
As of 9/7, mask wearing has
increased to 84% in Oregon.
Note:
Estimated percentage of people who wore
a mask for most or all of the time while in
public in the past 7 days; those not in
public in the past 7 days are not counted.
17
Source: https://covidcast.cmu.edu/Symptoms
Symptoms appear to have
flattened in last week in Oregon.
The level is slightly above
previous peak and is consistent
with widespread transmission.
“Symptoms” refer to community
reports of COVID-like symptoms
through Facebook surveys.
18
Source: https://covidcast.cmu.edu/Statewide Forecast 19
Model Assumption-Vaccine Volume
“Fast” scenario assumes some
increased vaccine rates due to
attention from current surge. It
also assume 5-11 become
eligible in late fall.

“Slow” scenario show previous
pattern of declining vaccine
providing little boost to
immunity levels.

 20    Source: https://public.tableau.com/profile/oregon.health.authority.covid.19#!/vizhome/OregonCOVID-
       19VaccinationTrends/OregonStatewideVaccinationTrends, Projections by OHSU using Weekly Dose Projections from OHA.
Model Assumption-Virus Spread Rate
The fast uptick in delta variant is
shown by a kink in the overall R0 of
the circulating virus.
The “Fast” scenario assumes delta
variant has an R0 of 8.0.
The “Slow” scenario assume R0=6.5
Source: Actuals from https://outbreak.info/location-reports?loc=USA_US-OR, Projections by Simulation by OHSU
21Model Assumption- Policy/Behavior “Recent” Scenario represents maintaining our current performance. “Moderated” shows what happens with a lower amount of intervention effectiveness. 22 Note: The fear and fatigue cycle is shifted upwards to account for the increased transmissibility of the virus.
Census Forecast-Primary Scenario
The forecast shows a general
decrease in census levels over 2-
3 months.
The primary scenario is
•        “Moderated” intervention
         effect
•        Slow Variant (Delta R0=6.5)
•        High hospitalization rate
         for Delta (2X original)
•        Vaccine efficacy=95%

    23    Source: OHSU COVID Forecast Model
Census Forecast-Alternative Scenarios
Scenarios:
1) Moderated behavior/policy,
Slow Variant, High Delta Hosp
Rate, Fast Vaccine
2) Fear/Fatigue behavior/policy,
Slow Variant, High Delta Hosp
Rate, Fast Vaccine
3) Fall Shift behavior/policy, Slow
Variant, High Delta Hosp Rate,
Fast Vaccine
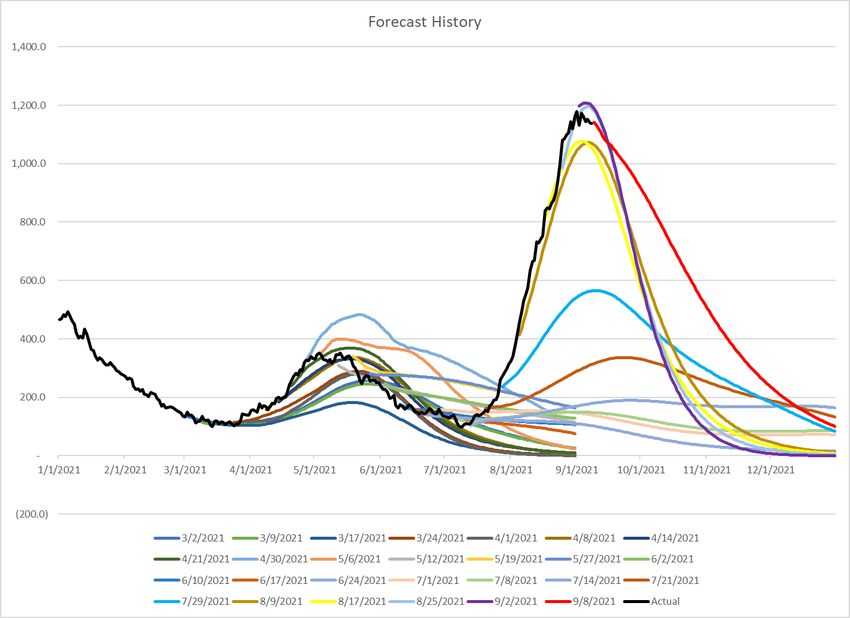
24Previous Forecasts Previous forecasts can help assess accuracy of the model. 25 Source: Primary scenario for each week is used
Model-Herd Chart
As of 9/8, the estimated
population proportions are:
Susceptible: 27%
Vaccinated: 44%
Infected: 20%
Vaccinated & Infected: 9%

Projection uses primary
scenario.

26    Source: OHSU COVID Forecast Model
Policy Issues

27
Vaccination Rates
Oregon has given a first dose to
64.9% of population (not just
eligible).

This rate ranks 19th in the US.

 28   Source: https://covid.cdc.gov/covid-
      data-tracker/#vaccinations
Pediatric Hospitalizations
Pediatric hospitalization rate
remains elevated but steady.
Other states, have had rates up 7
times higher than Oregon which
has approximately 0.2 new
admissions per 100k kids per
day.
29
Source: https://covid.cdc.gov/covid-data-tracker/#new-hospital-admissionsPediatric Hospitalizations
Shown are the pediatric
hospitalization rates for selected
states.
Currently, Oregon is
experiencing about 0.2
hospitalizations per 100k.
Note: The scales are different in
each chart.
30
Source: https://covid.cdc.gov/covid-data-tracker/#new-hospital-admissionsPediatric Hospitalizations
Per NYTimes analysis, the states
with lower vaccination rates are
driving the surge in pediatric
hospitalizations.
Notably, however, Florida has a
higher vaccination rate than
Oregon and high pediatric
hospitalization rates.
31
Source: https://www.nytimes.com/interactive/2021/09/09/us/covid-children-cases-icu.htmlAppendix 32
IDM/OHA Projection
The most recent forecast was issued
on 9/2.

This model shows the potential for
reduction to mask wearing.

 33   Source: https://www.oregon.gov/oha/covid19/Documents/DataReports/Epidemic-Trends-and-Projections.pdf
CDC Forecast-Ensemble
CDC forecasts show an upcoming
peak.

34    Source: https://covid.cdc.gov/covid-data-tracker/#forecasting_weeklycases
IHME Forecast
As of 9/2, the IHME model shows a
recent peak in infections.

 35   Source: http://www.healthdata.org/sites/default/files/covid_briefs/560_briefing_Oregon.pdf
Death Projections
The data show the number of deaths
per day from the model.

The estimates are based on looking at
expected hospital admissions (that
would generate the census
forecasted) and then assuming a
relationship between all COVID
deaths (not just of hospitalized) and
COVID hospital admissions.

Based on recent data the ratio of
hospitalizations to deaths is 5.5. A 21-
day lag is applied from presumed
infection date until death.

Actual data is based on weekly counts
of death from OHA.
 36    Source: OHSU COVID Forecasting Model, https://public.tableau.com/app/profile/oregon.health.authority.covid.19/viz/OregonCOVID-
       19CaseDemographicsandDiseaseSeverityStatewide/DiseaseDeathData
Acknowledgements Each week this model requires updates, input and expertise from many people. I would like to thank Alexandra Nielsen for developing a multi-strain simulation model, Brian O’Roak and Xuan Qin, at OHSU, for their expertise to understand genetic sequencing information, and the hospital forecasting workgroup for their feedback on weekly forecasts, including collaboration with Julie Maher and Erik Everson at Multnomah County PDES. I would also like to give a special thank you to Michael Johnson from St. Charles Health who helped develop an early version of the model that has proven to be a good structure to handle the many twists and turns the problem has required. Thank you! 37
You can also read