Available data and estimates of the impact of the COVID-19 pandemic on global poverty
←
→
Page content transcription
If your browser does not render page correctly, please read the page content below
Available data and estimates of the impact of the
            COVID-19 pandemic on global poverty
                                        Nishant Yonzan
                                       Christoph Lakner
                                     Daniel Gerszon Mahler
                                  R. Andres Castaneda Aguilar
                                           Haoyu Wu

                       This paper uses material previously published at
  https://blogs.worldbank.org/opendata/updated-estimates-impact-covid-19-global-poverty-
                            looking-back-2020-and-outlook-2021,
   https://blogs.worldbank.org/opendata/impact-covid-19-global-poverty-under-worsening-
                                 growth-and-inequality, and
 https://blogs.worldbank.org/opendata/impact-covid-19-coronavirus-global-poverty-why-sub-
                           saharan-africa-might-be-region-hardest

COVID-19 is taking its toll on the world, causing deaths, illnesses and economic despair. But how
is the deadly virus impacting global poverty? Nowcasting global poverty is not an easy task. It
requires assumptions about how to forecast growth and how such growth will impact the poor,
along with other complications such as how to calculate poverty for countries with outdated data
or without data altogether. All of this goes to say that estimating how much global poverty will
increase because of COVID-19 is challenging and comes with a lot of uncertainty. Others have
tried to answer the question using general equilibrium models or by exploring what will happen
if all countries’ growth rates decline a fixed amount. Here we’ll try to answer the question using
household survey data and growth projections for 167 countries.
In particular, we take the welfare distributions for the 167 countries in PovcalNet (an online tool
provided by the World Bank for estimating global poverty) for 2019 – the latest year currently
published -- and extrapolate forward to 2020 and beyond using the growth projections from the
World Bank’s Global Economic Prospects (GEP), the World Bank’s Macro and Poverty Outlook
(MPO), or IMF’s World Economic Outlook (WEO). Our approach assumes that countries’ growth
accrues equally to everyone, or in other words that COVID-19 does not change inequality within
countries (more on that below). Comparing these COVID-19-impacted poverty estimates with
estimates that use editions of the aforementioned sources of growth data launched before the
pandemic spread globally, allows for an assessment of the impact of the pandemic on global
poverty. Of course, other factors may have also worsened (or improved) countries’ growth
outlooks but it’s safe to say that most of the changes in the forecasts will be due to COVID-19.
The number of COVID-19-induced new poor is calculated as the difference between poverty
projected with the pandemic and poverty projected without the pandemic.
In our most recent edition, to predict poverty in 2020 that account for COVID, we use the GEP
growth forecasts from January 2021, and for the pandemic free world, we use GEP growth
forecasts made in January 2020. The January 2021 growth forecasts contain two scenarios—
baseline and downside—allowing us to explore two different scenarios for how the pandemic may impact poverty. The downside scenario assumes that outbreaks persist longer than expected, forcing lockdown measures to be maintained or reintroduced, while the baseline scenario is more optimistic. Figure 1 shows the annual change in the number of global extreme poor from 1992 to 2020. Each bar represents the net number of people who have either moved out of extreme poverty if they were poor in the last year or moved into extreme poverty if they were not poor in the previous year. Before COVID-19, the only other crisis-induced increase in the global number of poor in the past three decades was the Asian financial crisis, which increased extreme poverty by 18 million in 1997 and by another 47 million in 1998. In the two-decades since 1999, the number of people living in extreme poverty worldwide has fallen by more than 1 billion people. Part of this success in reducing poverty is set to be reversed due to the COVID-19 pandemic. For the first time in 20 years, poverty is likely to significantly increase. The COVID-19 pandemic is estimated to increase extreme poverty by between 88 million (baseline estimate) and 93 million (downside estimate) in 2020. Considering those who would have otherwise escaped extreme poverty but will not due to the pandemic (i.e. 31 million in 2020), the total COVID-19-induced new poor in 2020 is estimated to be between 119 and 124 million. Figure 1: Annual change in the number of extreme poor (in million), 1992-2020
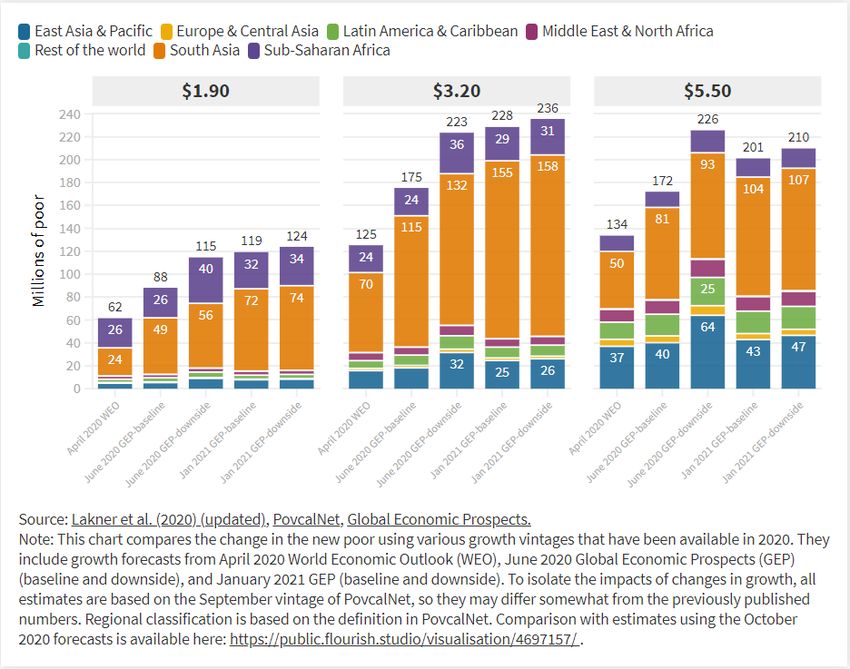
Utilizing various growth forecasts that have been available in 2020, Figure 2 shows both the
change in the estimated number of COVID-19-induced new poor in 2020 and the contributions
of various regions. The worsening impact of the pandemic has drastically changed our projections
over the course of this year, especially when comparing with growth rates launched in April 2020.
This has been driven primarily by a worsening forecast for South Asia, which has also changed
the regional profile of the COVID-19-induced new poor. It is important to note that the poverty
estimate in South Asia in recent years, even before the pandemic, is subject to considerable
uncertainty due to the absence of new household survey data for India since 2011/12.
Using the growth forecast from April 2020 under the $1.90-a-day poverty line, we estimated that
62 million would fall into extreme poverty globally in 2020, with South Asia and Sub-Saharan
Africa each contributing roughly two-fifths. We revised the global estimate to between 88 and
115 million using the June-2020 growth forecast, with about half of the new poor residing in
South Asia. Using the January 2021 forecast, we now estimate between 119 and 124 additional
poor globally with around 60% living in South Asia.

         Figure 2: COVID-19-induced new poor in 2020, using various growth vintages

The increase in the number of poor is also visible at the $3.20 poverty line. At the $3.20 line, the
global new poor using the GEP-baseline scenarios has increased from 175 million to 228 million
(from June 2020 to January 2021) , again driven by South Asia. At the $5.50 line, we do not find
a worsening of the global estimate, as our new estimates actually lie within the range we
estimated using the June GEP. This is largely explained by a better than expected outlook for East
Asia and Pacific, counteracting the upward revision in South Asia.
There is little doubt that 2020 has been an exceptionally difficult year in recent history. While
there has been progress in the development of vaccines, it doesn't appear that the increase in
poverty of this past year will be reversed in 2021. Figure 3 presents the nowcast of poverty up
to 2021 using the pre-COVID-19 and the COVID-19 baseline and downside scenarios using the
GEP January 2021 forecast. As reported above, the pandemic-induced global new poor is
estimated to be between 119 and 124 million in 2020. In 2021, the estimated COVID-19-induced
poor is set to rise to between 143 and 163 million. While the estimates for 2021 are very
preliminary, it goes to show that for millions of people around the globe this crisis will not be
short-lived.
Figure 3: Nowcast of extreme poverty, 2015-2021
The various estimates we reported above reveal the truly uncertain environment we currently
live in. Additional variation in the estimated new poor can arise if we relax an assumption implicit
in all estimates above; that everyone within a country is losing income or consumption at the
same rate from COVID-19, implying no change in inequality. In Figure 4, we present estimates of
the new poor with different growth rates and with different assumptions about how COVID
impacts inequality. The growth forecasts we use are derived from the various growth vintagesthat have been available from the GEP, MPO, and WEO (safe for the latest vintage of GEP). For
inequality changes, we increase/decrease the Gini index by either 1% or 2% in 2020 for each
country. Each cell of the figure presents an estimate that combines a growth vintage with a
scenario that changes inequality. We expect the number of poor to increase as we increase
inequality holding growth fixed (i.e. moving from left-to-right in the same row). Likewise, as the
growth outlook has worsened, moving up from the bottom of the chart progressively increases
the number of new poor in most cases.
Figure 4: Estimates of the COVID-19-induced new poor in 2020, different scenarios for growth
and inequality
Using the October growth forecasts with no change in inequality results in between 125 and 131
million new poor (these estimates are reported in rows 1 and 2 of the 3rd column). But the
distribution-neutral assumption might be too strong. A 1% increase in the Gini index in each
country in 2020 would increase the additional poor by around 15% in 2020 (144 million using
MPOs and 152 million for WEO). A 2% increase in the Gini would result in an almost 30% increase
(161 million for MPO and 170 million for WEO). In Sub-Saharan Africa, a 2% increase in the Gini
index would increase the additional poor in Sub-Saharan Africa by a third, from 32 million with
constant inequality to 42 million, using the October MPO in 2020.This unprecedented global shock could very well have a larger negative impact on inequality. If that were the case, we should expect an even larger increase in the number of new poor. At the same time, it is important to stress that appropriate government policy can dampen this impact. However, even our most optimistic scenario with a 2% reduction in the Gini index in each country would still imply an increase in extreme poverty by between 90 and 99 million using the most recent growth forecasts. The changes in inequality that we simulate are not atypical of year-to-year changes observed over the medium and long-term. The worst historic increases in the Gini index would be larger for most regions, ranging from just under 2% per year in Latin America and the Caribbean to around 4% in South Asia. At the same time, it is obviously a strong assumption that all countries’ inequality changes at the same rate, and it is not clear what these historic changes can tell us about such an unprecedented shock that is COVID-19. The emerging evidence on the impact of COVID-19 on inequality suggests that our inequality increasing scenario might be conservative, though little is known about the impact on the poorest countries. Exploiting variation in telework ability with income, the October 2020 World Economic Outlook estimates that COVID-19 increases the average Gini index for emerging market and developing economies by more than 6%, with a an even larger impact for low-income countries. The average increase in the Gini index for EU countries has been estimated at 3.5% with a 2-month lockdown, rising to 13.5% with an additional 6-month partial lockdown. For four Latin American countries, a recent paper suggests that COVID-19 would increase the Gini index between 3.5% and 7.4%, which could be considerably lower with social assistance (increases between 0.6% and 4%). These estimates are all considerably larger than the increase in inequality during past pandemics (estimated to be around 1.25% five years after the pandemic), which underscores the fact that a pandemic of such a global scale as COVID-19 is truly unprecedented in modern times. We hope that when we take stock of 2021, the year will have fared much better for poverty reduction than what we expected at the start of the year. However, the continued worsening of growth outlooks that we observed in the past year could suggest otherwise.
You can also read