UK House Price Index +4.7% - Zoopla Advantage
←
→
Page content transcription
If your browser does not render page correctly, please read the page content below
Research and Insight
                                                                                       May 2021 index
                                                                             (published 29th June 2021)

   UK House Price
   Index

        +4.7%
          Current UK house
                                      +26%
                                      Demand for homes,
                                                                               -2%
                                                                           Flow of new supply,
            price growth                 YTD v 2020                            YTD v 2020

                             Executive summary
                             •   Buyer demand has moderated as stamp duty holiday ends but
                                 remains elevated compared to ‘normal’ market conditions

                             •   ‘Search for space’ among homebuyers, as well as increased
                                 numbers of first-time buyers and those making lifestyle changes,
                                 will continue to support activity through H2

                             •   Total stock of homes for sale remains constrained, down 24% in
                                 the year to mid-June compared to the average in 2020

                             •   Annual house price growth is at 4.7%, up from 2.2% a year ago

                             •   Price growth hits 10-year high in Wales (+7.1%), Yorkshire & the
                                 Humber (+6.2%) and the North East (+5%)

                             •   Price growth over the last year lifts 1.8 million homes into a higher
                                 stamp duty bracket

“Prices are rising
fastest in the most
affordable markets
as activity continues
at elevated levels
among first-time
buyers and movers
looking for more
space or a lifestyle
change.”
Gráinne Gilmore
Head of Research, Zoopla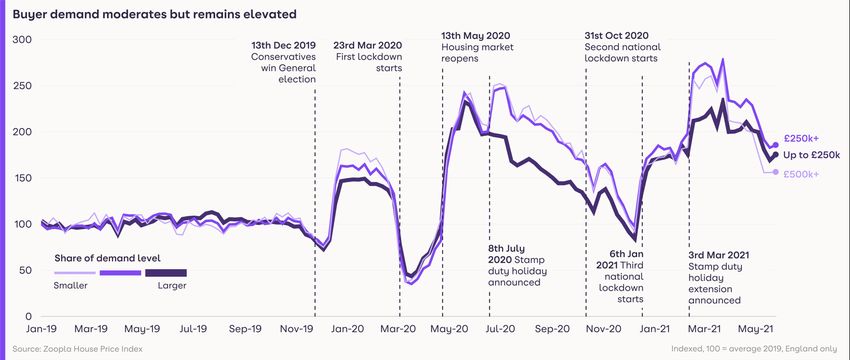
May 2021 | UK House Price Index | Page 2
Annual UK house price inflation at +4.7%
+4.7%
Average house prices rose by 1.1% in the three months to May, taking
the annual rate of growth to 4.7%, matching that in February – which
was the highest level of growth since the beginning of 2017.
Annual UK house
Prices are being supported by elevated levels of demand – despite
price growth
a recent moderation approaching the end of the initial stamp duty
holiday on June 30th.
Average house prices in the UK have risen by more than £10,000
over the last year, taking the average price to £229,300.
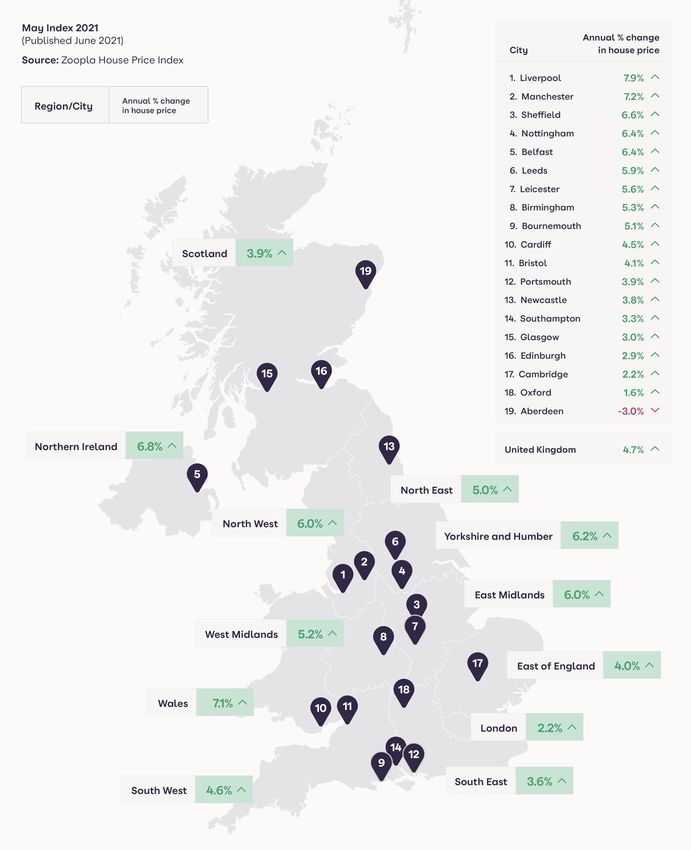
The spread of house price growth across the country continues to
widen however, with annual price rises reaching a 10-year high in
Wales, Yorkshire & the Humber and the North East. Meanwhile
London is lagging at 2.2% growth, the seventh month that this region
has registered the lowest level of growth across the country.
Liverpool (+7.9%) and Manchester (+7.2%) continue to record the
highest levels of price growth among the largest UK cities, while
Rochdale (+9.9%), Bolton (+8.7%) and Hastings (+8.2%) top the charts
in the 65 cities and towns monitored in this index.
These cities are united in having some of the most accessible
housing markets in terms of affordability, with the household income
needed to buy a property – assuming a 15% deposit and a mortgage
at 4.5 x income – at between £25,100 and £35,500, below the UK
average of £43,300.
The exception is Hastings, where household income needed to buy is
£47,100, although this is at a significant discount to the £71,000
needed to buy down the coast in Brighton.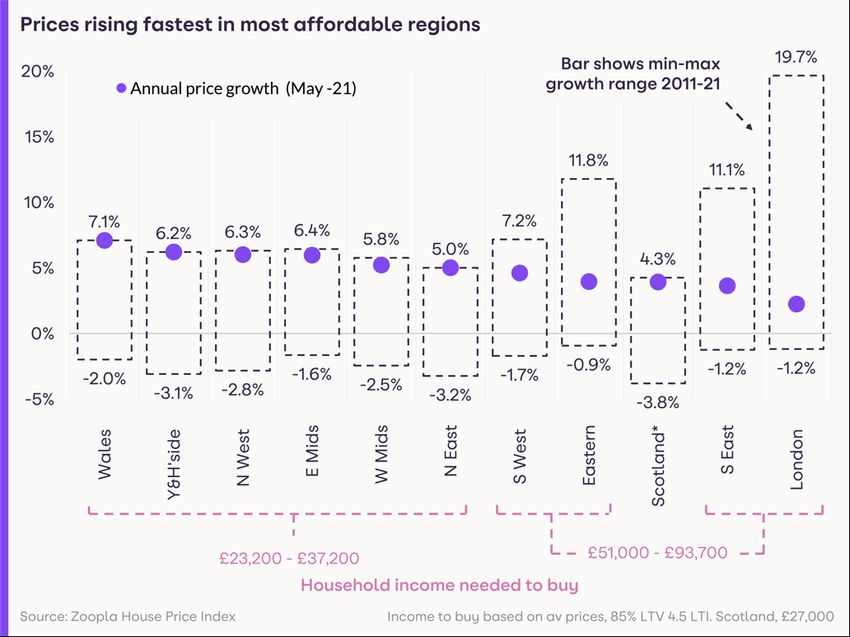
May 2021 | UK House Price Index | Page 3

                       Homes move up stamp duty bands

+940,000               Price growth over the last year mean that some 1.8 million properties
                       in England have moved into a higher stamp duty bracket, as shown
                       below. Some 940,000 additional homes will be subject a level of
Number of properties
that have moved into   stamp duty at 5% should they be purchased by a homemover, while
5% stamp duty band     an extra 130,000 properties will attract some stamp duty at 10%.

                       The number of homes in the lower stamp duty bands in England is
                       falling, while the price growth means it is rising for the top bands.

                       The average additional stamp duty payable on homes that have
                       moved up into the 10% stamp duty band will be around £6,100 after
                       the end of the tapered stamp duty holiday in September, while the
                       additional cost for the average homes that has moved up into the
                       5% band will be around £725.

                       Continued..
May 2021 | UK House Price Index | Page 4
Demand levels moderate but remain elevated
+86%
Buyer demand for
Buyer demand levels have been elevated compared to more
‘normal’ market conditions (2017-2019) since the housing market
reopened during the first lockdown last year.
homes worth
£250,000+ vs 2019 As the chart below shows, this demand was boosted by the
average, England introduction of the stamp duty holiday in July last year, and its
subsequent extension.
Demand has moderated from the unsustainable highs of April, but
remains elevated. This demand is being fuelled by several factors,
not least the stamp duty savings still on offer for buyers of homes
worth up to £250,000.
In addition, there is more activity among first-time buyers who have
a wider range of mortgages to choose from, and who will still
benefit from stamp duty savings up to £300,000 beyond June or
September. The ‘search for space’ among buyers is still evident, and
some homeowners, typically with higher levels of equity, have been
prompted by the pandemic and subsequent lockdowns to change
to their lifestyle – and their home.
As the full re-opening of the economy approaches, many office-
based workers are also receiving guidance on how companies will
operate when offices fully reopen. Where companies are shifting to
more flexible working, some workers will now have the certainty to
make a move for additional space or to a different location if daily
commuting is less of a consideration.
The supply of homes for sale remains constrained, and may limit
potential activity in some areas, yet we expect activity will remain
buoyant in H2, in line with our forecast for 1.5 million sales this year.May 2021 | UK House Price Index | Page 5
Fastest moving market in five years
22days
Average time to sell
Time to sell, which measures how quickly homes are sold subject to
contract after being listed, fell to 22 days in May, down from 42 days
in May 2019. The seasonal nature of the market means it moves more
quickly during April/May in most years, but this still marks the fastest
(listing to SSTC) UK,
May 2021 moving market in at least five years.
This signals that the market continued to move apace in May, even
when the prospect of the larger stamp duty savings for homemovers
(which would require that the sale be completed by June 30th) was off
the table – underlining that the ‘reassessment of home’ which is
fuelling buyer activity, has further to run.
Market Outlook
The stamp duty holiday boosted demand in the housing market, yet
buyer demand remains elevated despite the initial holiday ending –
signalling that the once-in-a-generation ‘reassessment of home’ has
further to run this year.
Demand may ease further as the re-opening of the economy allows
people to do more and travel more widely, but at the same time, the
confirmation of working practices for office-based workers will lead to
more homebuyers being able to push ahead with a move.
The total stock of homes for sale continues to run well below historical
norms, and this will underpin pricing. At the same time, it may also
constrain potential activity, especially for buyers looking for family
houses. Even so, we forecast that this year will be one of the busiest for
the housing market since the global financial crisis - with 1.5 million
residential transactions.May 2021 | UK House Price Index | Page 6 House Price Index – Country, region and city summary Note: The Zoopla house price index is repeat sales-based price index using sold prices, mortgage valuations and data for agreed sales. The index uses more input data than any other and is designed to accurately track the change in pricing for UK housing.
May 2021 | UK House Price Index | Page 7

Zoopla UK House                                      Average             %yoy              %yoy             Monthly               Annual
Price Index, city                                       price           May-21            May-20              trend                trend

summary May               UK                        £229,300                4.7%               2.2%
2021                      20 city index             £266,100                3.9%              2.6%
Source: Zoopla House
                          Liverpool                 £132,600                7.9%               3.3%
Price Index. Sparklines
                          Manchester                £187,800                7.2%               4.2%
show last 12 months
trend in annual and       Sheffield                 £148,400               6.6%               2.5%

monthly growth rates      Belfast                   £145,500                6.4%              2.5%
– red bars are a          Nottingham                 £171,000               6.4%              4.5%
negative value – each
                          Leeds                     £180,700               5.9%               4.0%
series has its own axis
                          Leicester                 £196,500               5.6%               4.0%
settings providing a
                          Birmingham                £178,400                5.3%               2.7%
more granular view on
price development.        Bournemouth              £298,500                 5.1%              0.9%

                          Cardiff                   £222,300                4.5%              3.0%

                          Bristol                   £293,800                4.1%               3.3%

                          Portsmouth                £249,300                3.9%              2.0%

                          Newcastle                  £133,100               3.8%               2.2%

                          Southampton               £232,200                3.3%              0.7%

                          Glasgow                   £128,000                3.0%               3.3%

                          Edinburgh                 £243,200                2.9%               3.3%

                          Cambridge                 £429,900                2.2%               1.9%

                          London                    £487,300                2.1%               2.1%

                          Oxford                    £412,600                1.6%              0.8%

                          Aberdeen                   £144,200              -3.0%              -1.4%

                          Source: Zoopla House Price Index. Sparklines show last 12 months trend in annual and monthly
                          growth rates – red bars are a negative value – each series has its own axis settings providing a
                          more granular view on price development.

   Contacts                           If you have any questions about our research please do get in touch

                                      Richard Donnell                                     Gráinne Gilmore
                                      Director of Research & Insight                      Head of Research
                                      richard.donnell@zoopla.co.uk                        grainne.gilmore@zoopla.co.uk

   Recent publications                Sign up for all the latest research from Zoopla at
                                      advantage.zpg.co.uk
   UK
   Rental
                                      The information and data in this report was correct at the time of publishing and high standards
   Market
   Report                             are employed to ensure its accuracy. However, no reliance should be placed on the information
   2021 Q1                            contained in this report and Zoopla Ltd and its group companies make no representation or
                                      warranty of any kind regarding the content of this article and accept no responsibility or liability
                                      for any decisions made by the reader based on the information and/or data shown here.
You can also read