Q2 and H1 2020 Webstep ASA Oslo | 26 August 2020 Arne Norheim (CEO) Liv Annike Kverneland (CFO) - Cision
←
→
Page content transcription
If your browser does not render page correctly, please read the page content below

Q2 and H1 2020 Webstep ASA Oslo | 26 August 2020 Arne Norheim (CEO) Liv Annike Kverneland (CFO)

Agenda
1. Q2 and H1 highlights

2. Business review

3. Financial review

4. Outlook

5. Q&A

                          2
Q2 and H1 highlights
● Revenue growth of 6.4% in Q2 and
  2.6% in H1
● Solid EBIT
● Continued strong market for IT
  expert services
● Reduced recruitment activity in Q2,
  back to normal in Q3
● Strong growth in project deliveries
  (Solutions)
● Webstep Sweden with increased
  profitability
● The Board maintains its intention
  to distribute dividend in 2020

                                        3
Business review

BUSINESS REVIEW

Steady operations and continued demand

Expert Services                                  Solutions
●   Continued operations through the lock-down   ●   New contracts signed in Q2 - deliveries start
●   Webstep experts critical resources for           in Q4
    customers                                    ●   Further development made in municipality
●   Steady demand for IT consultants                 offering - set to launch in October
●   High activity in all regions                 ●   High recruitment activity to meet demand

                                                                                         NOKm
                                                                                                5
BUSINESS REVIEW

Webstep as lead IT partner
   Enova selected Webstep as lead IT partner for next 4
   years.

    ●   Agreement focused on digitizing the company
        and make Enova a data driven organization

    ●   Webstep will act as a trusted advisor and ensure
        development of a cloud based platform

    ●   New solution (named plattform 42) will ensure
        seamless and agile digital processes and
        automated tools supporting development of
        new technology

   Enova SF contributes to reduced greenhouse gas
   emissions, development of energy and climate
   technology and a strengthened security of supply.

                                                           6
BUSINESS REVIEW

Webstep supports the global
COVID-19 response
   ●   A new digital app for peer-to-peer training related
       to COVID-19 protection equipment was delivered
       in April 2020 by Webstep senior consultants

   ●   Webstep has been a trusted provider of services
       related to design, development and project
       management for various digital projects and
       deliveries

  Laerdal Medical is a global provider of products and
  services to the healthcare industry. The company’s
  vision is Helping save lives.

                                                             7
BUSINESS REVIEW
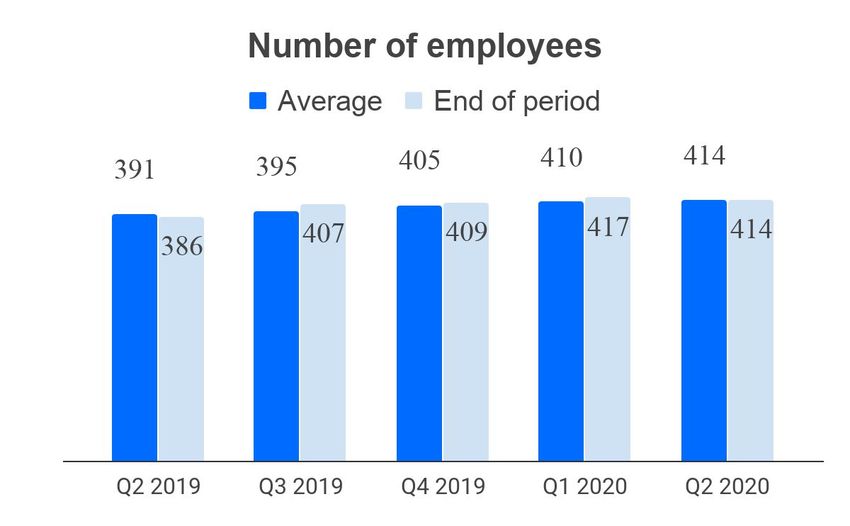
Organization and operations
54 Trondheim
● 414 employees at the end of Q2 2020
(+8)
○ Up 5 from year-end 2019
○ Up 28 last 12 months
● Average number of employees in the quarter up
70 Bergen
5.9% from Q2 2019
● COVID-19: (-3) Oslo
145
○ Most of the employees worked from home Uppsala 8
offices in Q2 (+6)
○ Closed kindergartens and schools in Norway 3 Haugalandet (+1)
affected work situation for employees with (-)
children
○ Recruitment activities slowed down Stockholm 41
○ COVID-19 salary programme to provide 61 Stavanger (-3)
security for consultants
(+8)
○ Utilization lower than normal
● Sundsvall served from Stockholm going forward
Sørlandet Malmö 14
18
(+4)
(+7)
Note: Numbers in parentheses refer to year-over-year growth in number of employees.
8
Financial review
FINANCIAL REVIEW

               Key figures - Group
                                            Q2      Q2 Y/Y %        H1      H1      Y/Y %    Q2 and H1 highlights
NOK million                               2020    2019 growth     2020    2019     growth
                                                                                              ●   Revenue growth driven by headcount and hourly
Sales revenues                            172.4   162.0    6.4%   355.4   346.5      2.6%         rates
EBITDA                                     26.7    22.0   21.4%    43.2    44.3     (2.4%)    ●   Estimated negative effect of COVID-19 on
EBITDA margin                             15.5%   13.5%   2.0pp 12.2%     12.8%    (0.6pp)        revenues:
EBIT                                       23.2    19.6   18.4%    36.3    39.8     (8.7%)
                                                                                                    ○ Ca. NOK 10 million in Q2
EBIT margin                               13.5%   12.1%   1.4pp 10.2%     11.5%    (1.3pp)
                                                                                                    ○ Ca. NOK 13 million in H1
Net profit                                  17.7    14.8   19.3%    27.3    30.2     (9.8%)
                                                                                                    ○ Canceled projects and family care leave
Net cash flow                               11.6   (19.9) 158.4%    25.3   (27.8)   191.1%
                                                                                              ●   Solid financial results
Earnings per share (NOK)                   0.66    0.56   18.4%    1.02    1.14    (10.5%)          ○ COVID-19 salary program for consultants
Earnings per share. fully diluted (NOK)    0.66    0.56   18.8%    1.02    1.14    (10.2%)              funded by cost savings and and reduced
Equity ratio                              68.7%   64.1%   4.5pp 68.7%     64.1%     4.5pp               social security contribution tax
Cash and cash equivalents                  50.8     5.7            50.8     5.7                     ○ Estimated negative effect on EBIT from
                                                                                                        COVID-19: NOK 1 million in Q2 and NOK 3
Number of employees, average (FTE)         414     391     5.9%    412      395      4.4%
                                                                                                        million in H1
Number of employees, end of period         414     386     7.1%    414      386      7.1%
                                                                                              ●   Net cash flow positively affected by extended
EBITDA per FTE (NOK thousand)              64.6    56.1   15.1%   105.0   112.1     (6.4%)
                                                                                                  payment terms for taxes
EBIT per FTE (NOK thousand)                56.2    50.2   11.9%    88.2   100.8    (12.5%)

                                                                                                                                      10
FINANCIAL REVIEW
Key figures - Norway
Q2 Q2 Y/Y % H1 H1 Y/Y % Q2 and H1 highlights
NOK million 2020 2019 growth 2020 2019 growth
● Revenue growth driven by headcount and hourly
Sales revenues 145.7 138.4 5.3% 301.1 300.0 0.3% rates
EBIT 20.5 18.6 10.0% 31.1 38.2 (18.5%) ● Estimated negative effect of COVID-19 on
EBIT margin 14.0% 13.4% 0.6pp 10.3% 12.7% (2.4pp) revenues:
Number of employees, average (FTE) 351 329 6.7% 348 334 4.2% ○ Ca. NOK 10 million in Q2
Number of employees, end of period 351 325 8.0% 351 325 8.0% ○ Ca. NOK 13 million in H1
Number of work days, excl. vacation 59 58 123 121 ○ Canceled projects and family care leave
EBIT per FTE (NOK thousand) 58.3 56.5 3.1% 89.4 114.3 (21.8%) ● Solid financial results
○ COVID-19 salary program for consultants
Revenue breakdown funded by cost savings and reduced social
Q2 Q2 Y/Y % H1 H1 Y/Y % security contribution tax
NOK million 2020 2019 growth 2020 2019 growth ● Government grants of NOK 4.3 million in Q2 and
Oslo 66.1 71.2 (7.2%) 136.2 161.3 (15.6%) H1
Regional offices 76.7 67.2 14.1% 161.5 138.7 16.4%
Solutions 2.9 0 - 3.4 0 -
Total 145.7 138.4 5.3% 301.1 300.0 0.3%
11FINANCIAL REVIEW
Key figures - Sweden
Q2 Q2 Y/Y % H1 H1 Y/Y % Q2 and H1 highlights
NOK million 2020 2019 growth 2020 2019 growth
● Constant currency revenue growth Y/Y:
Sales revenues 26.7 23.6 13.1% 54.3 46.4 17.1% ○ Decrease 0.5% in Q2
EBIT 2.8 1.0 176.2% 5.2 1.6 223.3% ○ Increase 6.5% in H1
EBIT margin 10.4% 4.2% 6.2pp 9.6% 3.5% 6.1pp ● Increased revenue from own consultants:
Number of employees, average (FTE) 63 62 1.6% 63 61 3.8% ○ + 11.9% (constant currency) in Q2
Number of employees, end of period 63 61 3.3% 63 61 3.3% ○ + 15.2% (constant currency) in H1
Number of work days, excl. vacation 60 59 123 122 ● Improved EBIT margins from cost savings and
EBIT per FTE (NOK thousand) 43.8 16.1 171.9% 82.9 26.6 211.3% increased revenues from consultants
12FINANCIAL REVIEW
Cash flow and net debt
Q2 highlights
● Operating cash flow increase from negative NOK 6.4
( ) ( ) million in Q2 2019 to positive NOK 14.1 million in 2020
○ Temporary positive effect of NOK 8.7 million in
payment terms of taxes
● Capex relates to office equipment
● Total lease liabilities of NOK 33.3 million, comprise of
office rentals and company cars in Sweden (not included
in NIBD)
● Undrawn credit line of NOK 110 million in Norway and
SEK 5 million in Sweden per end of quarter
30 Jun
NOK million 2020
Cash and cash equivalents* (50.8)
Restricted cash 2.4
Debt to credit institutions 0.0
Net interest bearing debt (NIBD) (48.4)
NIBD/EBITDA (rolling 12 months) (0.82)
*Negative indicates positive amount
13Outlook
Outlook
●   Carefully optimistic market outlook
     ○ Signed order flow from Q2 builds a solid
        foundation for H2

●   Continued focus on retainment and recruitment:
     ○ Recruitment drive ongoing in all locations
     ○ Q3 headcount expected to be higher than Q2,
        but paused recruitment activities in Q2 will
        have a lagging effect in Q4
     ○ COVID-19 salary programme for consultants
        continues through October
     ○ Continued home office

●   Organic growth in existing locations through
    recruitment and utilization is the main focus in
    the coming quarters                                15
Q&A
Appendix
Top 20 shareholders at 8 August 2020
Shareholder name                        Shares        %       Type           Country
EMBRO EIENDOM AS                      7,608,735   28.2%    Ordinary           Norway
Virtus KAR International Small-Cap    3,119,279   11.6%    Ordinary     United States
VERDIPAPIRFONDET ALFRED BERG GAMBA    1,556,645    5.8%    Ordinary           Norway
JAKOB HATTELAND HOLDING AS            1,000,000    3.7%    Ordinary           Norway
PARK LANE FAMILY OFFICE AS              905,581    3.4%    Ordinary           Norway
Goldman Sachs International             783,058    2.9%    Nominee    United Kingdom
VERDIPAPIRFONDET NORDEA NORGE VERD      685,000    2.5%    Ordinary           Norway
SALT VALUE AS                           566,637    2.1%    Ordinary           Norway
Danske Invest Norge Vekst               542,000    2.0%    Ordinary           Norway
Citibank, N.A.                          488,491    1.8%    Nominee             Ireland
AMG RENAISSANCE INTL EQ FD              415,000    1.5%    Ordinary     United States
NWT MEDIA AS                            390,000    1.4%    Ordinary           Norway
INTERTRADE SHIPPING AS                  371,000    1.4%    Ordinary           Norway
J.P. Morgan Bank Luxembourg S.A.        334,292    1.2%    Nominee            Finland
VIOLA AS                                330,000    1.2%    Ordinary           Norway
Taaleri Nordic Value Equity Fund        320,000    1.2%    Ordinary           Finland
WEBSTEP ASA                             293,633    1.1%    Ordinary           Norway
VIRTUS TACTICAL ALLOCATION FUND         282,917    1.0%    Ordinary     United States
EMPLOYEES RETIR SYSTEM OF TEXAS         225,741    0.8%    Ordinary     United States
VERDIPAPIRFONDET NORDEA AVKASTNING      225,383    0.8%    Ordinary           Norway
Top 20 shareholders                  20,443,392   75.8%
Other                                 6,523,625   24.2%
Total share outstanding              26,967,017   100.0%                                 18
BUSINESS REVIEW

A diversified customer base

        Top 10 customers represent 32.1% of total revenues – up from 26.2% in Q2 2019

                                                                                        19
Disclaimer
This Presentation includes and is based, inter alia, on forward-looking information and statements that are subject to risks and uncertainties that could cause
actual results to differ. These statements and this Presentation are based on current expectations, estimates and projections about global economic conditions,
the economic conditions of the regions and industries that are major markets for Webstep ASA and Webstep ASA’s (including subsidiaries and affiliates) lines
of business. These expectations, estimates and projections are generally identifiable by statements containing words such as “expects”, “believes”, “estimates”
or similar expressions. Important factors that could cause actual results to differ materially from those expectations include, among others, economic and
market conditions in the geographic areas and industries that are or will be major markets for Webstep ASA. Although Webstep ASA believes that its
expectations and the Presentation are based upon reasonable assumptions, it can give no assurance that those expectations will be achieved or that the actual
results will be as set out in the Presentation. Webstep ASA is making no representation or warranty, expressed or implied, as to the accuracy, reliability or
completeness of the Presentation, and neither Webstep ASA nor any of its directors, officers or employees will have any liability to you or any other persons
resulting from your use.
20You can also read