First quarter 2019
Oslo, 26 April 2019
←
→
Page content transcription
If your browser does not render page correctly, please read the page content below
First quarter 2019 Oslo, 26 April 2019
Disclaimer
The following presentation is being made only to, and is only directed at, persons to whom such presentation may
lawfully be communicated (’relevant persons’). Any person who is not a relevant person should not rely, act or make
assessment on the basis of this presentation or anything included therein.

The following presentation may include information related to investments made and key commercial terms thereof,
including future returns. Such information cannot be relied upon as a guide to the future performance of such
investments. The release, publication or distribution of this presentation in certain jurisdictions may be restricted by
law, and therefore persons in such jurisdictions into which this presentation is released, published or distributed should
inform themselves about, and observe, such restrictions. This presentation does not constitute an offering of securities
or otherwise constitute an invitation or inducement to any person to underwrite, subscribe for or otherwise acquire
securities in Scatec Solar ASA or any company within the Scatec Solar Group. This presentation contains statements
regarding the future in connection with the Scatec Solar Group’s growth initiatives, profit figures, outlook, strategies
and objectives as well as forward looking statements and any such information or forward-looking statements
regarding the future and/or the Scatec Solar Group’s expectations are subject to inherent risks and uncertainties, and
many factors can lead to actual profits and developments deviating substantially from what has been expressed or
implied in such statements.

                                                                                                                             2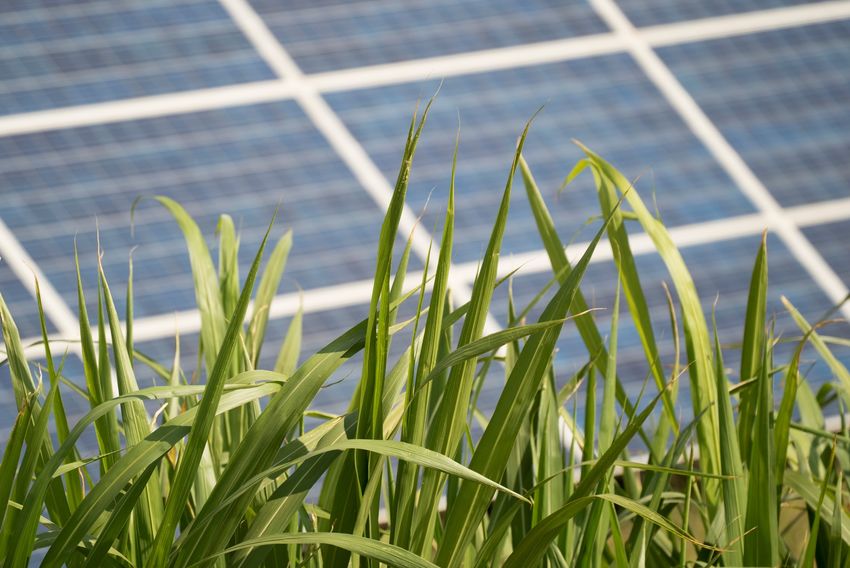
Agenda

• Highlights and project update
    Raymond Carlsen, CEO

• Financial review
    Mikkel Tørud, CFO

• Summary and outlook
    Raymond Carlsen, CEO

                                  3
Q1’19:
Continued strong growth and solid financial results

• Proportionate revenues of NOK 1,528 million and
  EBITDA of NOK 315 million
• Continued high construction activity with D&C revenues
  of NOK 1,297 million and EBITDA of NOK 159 million
• Power production reached its highest level ever with
  133 GWh – revenues up 52% year on year
• A new 152 MW project in Ukraine added to backlog
• Secured the first combined solar and battery project
  in Africa
• 65 MW of the 400 MW project in Egypt reached
  commercial operation in April

                                                           4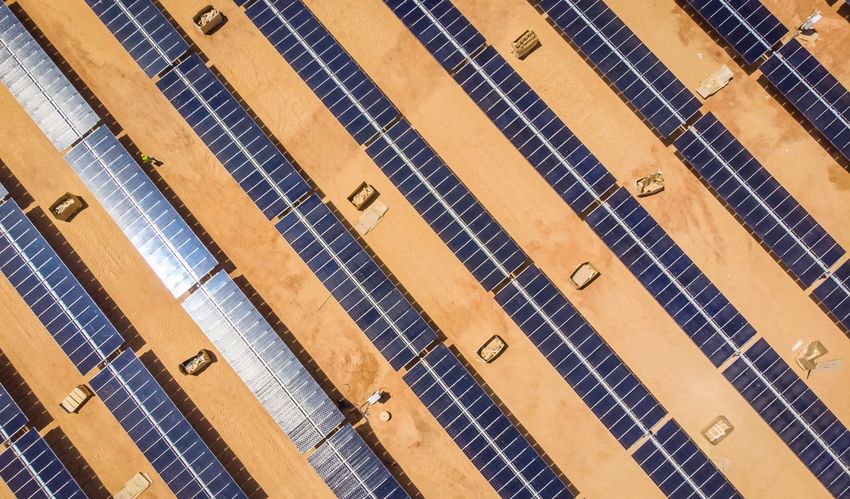
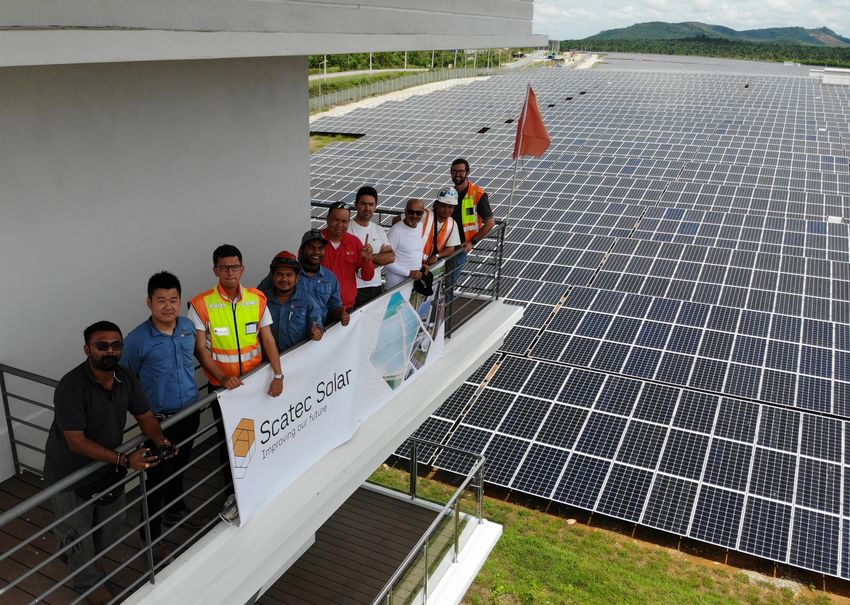
First 65 of 400 MW in Egypt reached commercial operation

Scatec Solar’s Egypt solar power plants:
  • Bi-facial solar panels:  1 million
  • Peak manning:            4,500
  • Lost Time Incidents:     1 on 4 million hours
  • Households powered:      420,000
  • Annual production:       870 GWh
  • Avoided CO2 annually: 350,000 tonnes

Expected commercial operation dates
 January                                                                December
 2019                             1                 2   3   4   5   6   2019
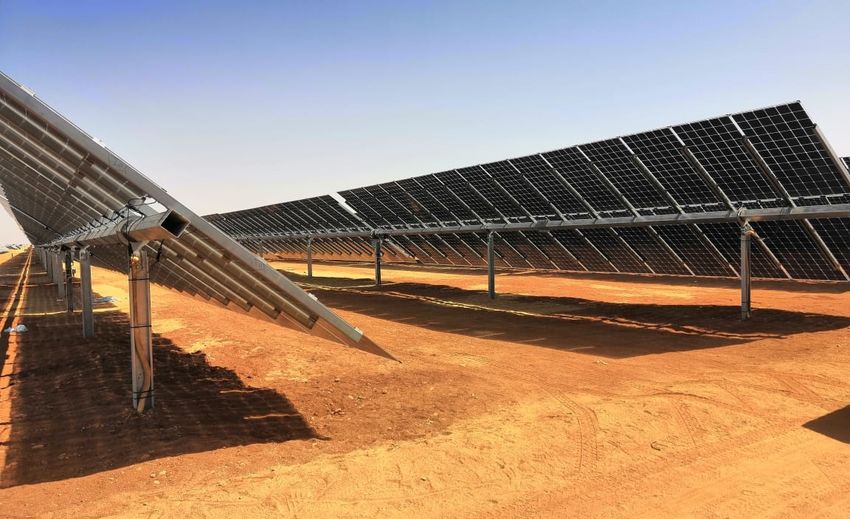
Ukraine: 152 MW added to project backlog

• Progressovka, 152 MW:
 • 10 year feed in tariff
 • Annual production: 184 GWh
 • Capex: EUR 156 million

• Scatec Solar’s 500 MW portfolio in Ukraine:
 • Under construction: Rengy & Kamianka 77 MW
 • Project backlog: 326 MW
 • Project pipeline: 100 MW

                                                The Rengy project currently under construction.

                                                                                                  6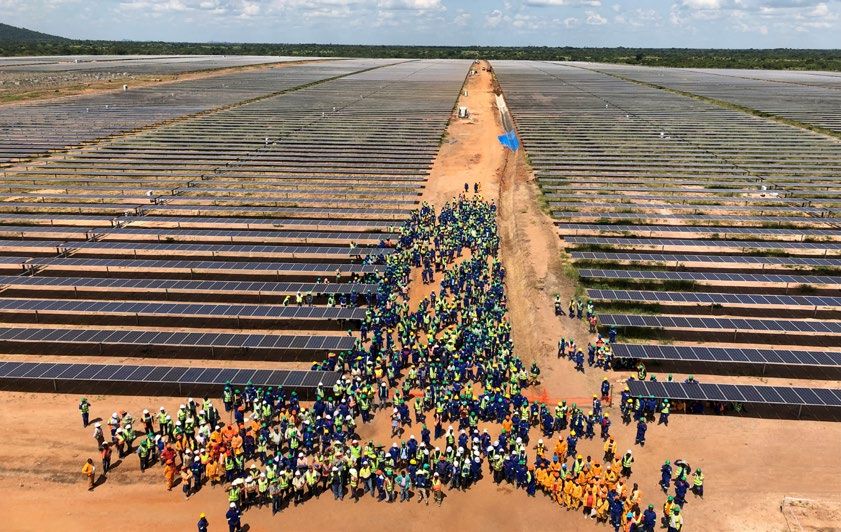
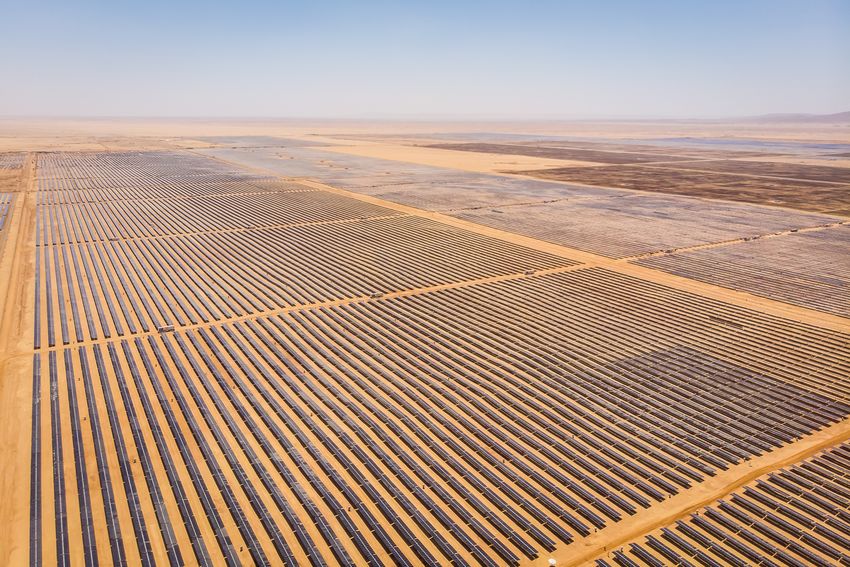
Broad portfolio of 1,006 MW under construction in six countries
Egypt, 335 MW                    South Africa, 258 MW              Jasin & Merchang, Malaysia, 130 MW   Argentina, 117 MW

                Ukraine, 77 MW                     Redsol, Malaysia, 47 MW             Mozambique, 40 MW

                                                                                                                            7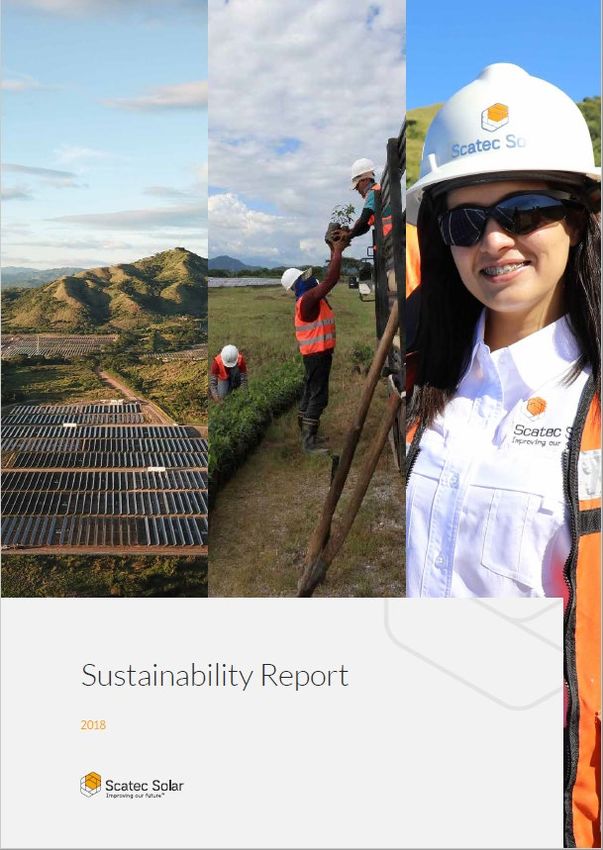
Sustainability is an integrated part of our business

Sustainability is;
• Project risk mitigation and value creation
• Local engagement and strong community relations
• Facilitating strong partnerships (project and group level)
• A competitive advantage if done well

                                                               8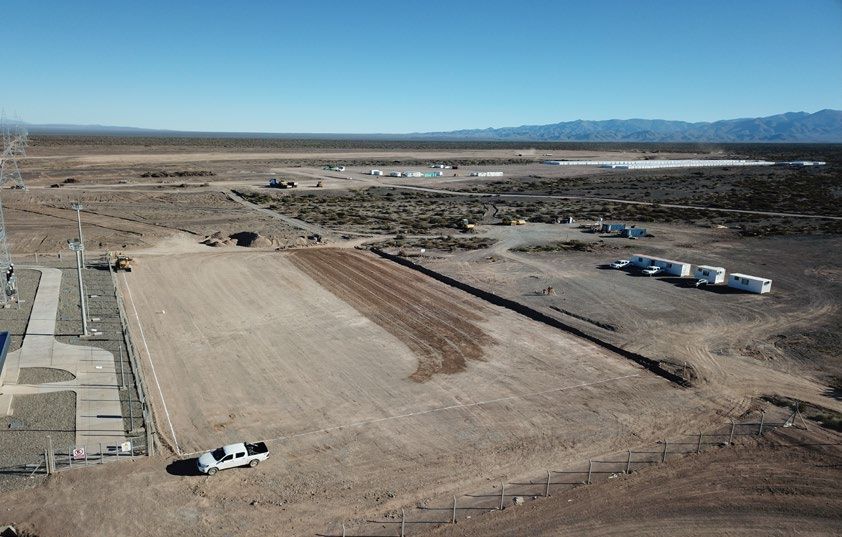
Sustainability
Local development programmes - focus on education

                 Contributing to local value creation
                 • Education - key focus for local development
                   programmes – one of our four selected
                   UN Sustainability Development Goals
                 • Target at least one long-term education
                   programme related to all our solar projects

                 Examples:
                 • Jordan: English language lab set up to offer free
                   training courses and workshops
                 • Honduras: 80 women from the local community
                   received HSSE training in the Los Prados project
                 • South Africa: 60 Entrepreneurs received business
                   administration training                             Read more: Sustainability Report 2018

                                                                                                               9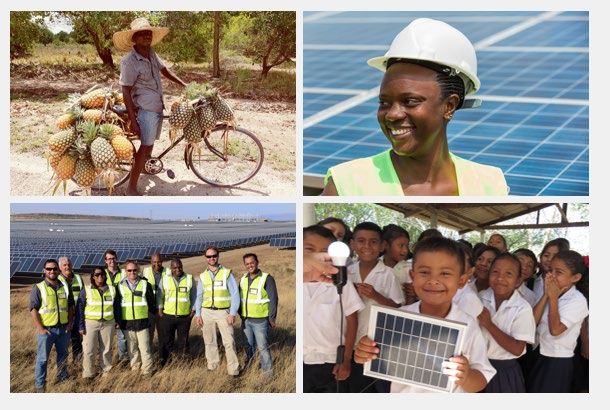
Financial review
Mikkel Tørud, CFO
Continued strong growth and solid financial results

                                                                                 Proportionate financials - last 12 months (NOK million)
 Key drivers:                                                                         Revenues                                    EBITDA                               Cash flow to Equity*
 • Consistent conversion of an attractive
   project pipeline in emerging markets                                                                         5,682

 • Solid delivery on construction across four
   continents                                                                                                                                           1,168

 • A broad asset portfolio with long term                                                                                                   815
   cash flows secured
                                                                                                   2,108
  • 17 years of remaining tenor of current                                                                                                                                                    639
    power purchase agreements                                                                                                   388
                                                                                        943                                                                                      279
 • Strong focus on operations & asset                                                                                                                                  90
   management
                                                                                       Q1 17       Q1 18       Q1 19           Q1 17       Q1 18       Q1 19         Q1 17      Q1 18         Q1 19

                (*) Cash flow to equity is defined as EBITDA less normalised (i.e. average o over each calendar year) loan and net interest repayments less normalised income tax payments.
                                                                                                                                                                                                      11
                    The definition implies changes in net working capital and investing activities are excluded from the figure.
Q1’19:
Revenues and EBITDA are up three fold from the same quarter last year
Proportionate revenues by segment (NOK million) Proportionate EBITDA by segment (NOK million)
1,666
Corporate Power Production
180 1,528
Development & Construction Operations & Maintenance
208
1,229 1,259
150 155 329 315
266 257
139
1,466 168
572 1,297 121 127
1,045 1,077
137 109
202
106 140 130 159
417
15
Q1 18 Q2 18 Q3 18 Q4 18 Q1 19 Q1 18 Q2 18 Q3 18 Q4 18 Q1 19
12Power Production
Power production reached highest level ever
Quarterly (NOK million) Last 12 months (NOK million)
693
Revenues EBITDA
208
180 554 555
168
150 155
452
137 139
121 127
106
Q1 18 Q2 18 Q3 18 Q4 18 Q1 19
Q1 18 Q1 19
EBITDA 77% 81% 82% 77% 81% 82% 80%
• Production in Brazil and Malaysia below normal levels due to extraordinary weather conditions
13Operation & Maintenance
Steady operations – revenues set to grow with new plants grid connected
Quarterly (NOK million) Last 12 months (NOK million)
Revenues EBITDA 84
30
68
22
19
17
14 15 35
11 25
2 3
2
Q1 18 Q2 18 Q3 18 Q4 18 Q1 19 Q1 18 Q1 19
14% 63% 50% 12% 15% 36% 42%
EBITDA
• Q1 Revenues are normally seasonal low in South Africa
Note: Q2’18 was positively affected by catch up of NOK 8 million
related to previously unrecorded revenues of the plants in Jordan. 14Development & Construction
Continued high development and construction activities
Quarterly (NOK million) Last 12 months (NOK million)
4,885
Revenues EBITDA
1 466
1 297
1 045 1 077
1,472
417
202 632
140 130 159 391
15
Q1 18 Q2 18 Q3 18 Q4 18 Q1 19 Q1 18 Q1 19
EBITDA 4% 13% 12% 14% 12% 27% 13%
Gross margin 10% 16% 15% 16% 14% 38% 14%
• The project development team continued to mature a wide range of projects
• Jasin, Merchang, Mocuba and next sites in Egypt are expected to reach commercial operation in the second quarter
15A solid financial position
Consolidated financial position (NOK million)
• Group free cash of NOK 825 million
As of 31.12.2018 As of 31.03.2019
• Revolving Credit Facility increased by NOK 275 million to
14,857 14,857 15,876 15,876
NOK 775 million – undrawn at the end of Q1’19
• Group* book equity strengthened to NOK 3,318 million – 2 364
equity ratio of 82% 2 475 4 190
4 442 2 100
10,647 10,647
1 800
SSO prop.
NOK million Consolidated Share Group level*
Cash 2,806 2,082 785 10 415 10 583
11 686 11 412
Interest bearing
liabilities* -10,441 -7,124 -744
Net debt -7,635 -5,042 41
Assets Equity & Liabilities Assets Equity & Liabilities
Current assets Non-current assets Equity Current liabilities Non-current liabilities
* Defined as ‘recourse group’ in the corporate bond and loan agreements 16Q1’19 movement of free cash at group level
Malaysia &
NOK million Ukraine
Net working capital
2 -20 construction projects
73 128 -114 -12
Development of -312
project backlog
and pipeline
1,039
785
End Q4 Distributions Cash flow to Cash flow to Cash flow to Project equity Project Working End Q1
from operating equity D&C equity O&M equity Corporate Development Capital/other
power plants capex
Movement of cash in ‘recourse group’ as defined in the corporate bond and loan agreements 17Short term guidance
• 2019 O&M revenues of NOK 110-120 million with
an EBITDA margin of around 30%
• D&C value for 1 GW under construction: NOK 7 billion
• Remaining NOK 3.3 billion value to be recognised
• Power production from plants in operation end Q1:
GWh Q1’19 Q2’19e 2019e
Proportionate 133 150-170 620-660
100% basis 254 290-310 1,100-1,300
The 65 MW Gurun solar plant in Malaysia.
18Outlook and summary Raymond Carlsen, CEO
Partnering with UN to reduce carbon emissions and the cost of power

• 0.7 MW project for United Nations entity secured in South Sudan
  • Combined battery and solar project for IOM – covering about
    90% of off-takers energy demand 24/7
• The solar systems can easily be increased to supply power to
  local communities or to other off-takers at a later stage
• UN spends about USD 600* million annually on fuel for power
• A large potential to reduce cost and carbon emissions for the
  UN entities
• In addition, two hybrid plants with total capacity of 2.25 MW
  for an international agency in South Sudan

             *Source: The Moving Energy Initiative (MEI), December 2018.   20
             IOM: International Organisation for Migration.
Scatec Solar – a global solar power company
HQ
Oslo
Amsterdam
Kiev
Paris
Prague
Amman
Cairo
Scatec Solar offices
Plants in operation
Tegucigalpa
4,173 MW Kuala Lumpur
Plants under Construction Recife
1,006 MW
Maputo
Backlog & Pipeline Cape Town
4,550 MW
All figures are as per reporting date for first quarter 2019. Pipeline list not exhaustive 21Strong growth towards 2021 and beyond
MW
• The solar market is expected to grow strongly
in the coming decade
• A track record and market position to realise
increased growth beyond 2021 3,500
• A well-proven business model with a present Growth beyond
execution capacity of 800-1,200 MW per year 2021
1,700
2019 End 2021
In operation & under In operation & under
construction construction
(2018 CMU target)
22Thank you!
You can also read