Energy and Mass Transfer through the Chromosphere - Bart De Pontieu Lockheed Martin Solar & Astrophysics Lab Palo Alto, CA, USA
←
→
Page content transcription
If your browser does not render page correctly, please read the page content below
Energy and Mass Transfer
                            through the Chromosphere

                                  Bart De Pontieu
                       Lockheed Martin Solar & Astrophysics Lab
                                 Palo Alto, CA, USA

Wednesday, March 10, 2010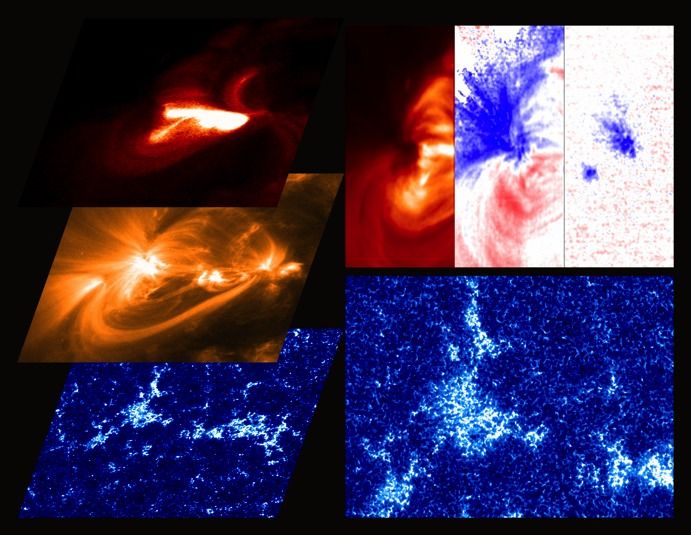
Why do we care about the chromosphere?
                             The chromosphere is where most of the non-
                             thermal energy that creates the corona and
                             solar wind is released or transformed.
                             Chromosphere requires 50 times heating rate
                             of corona, and provides all mass to
                             heliosphere
                             A. What types of non-thermal energy
                                 dominate in the chromosphere and
                                 beyond?
                             B. How does the chromosphere regulate
                                the mass and energy supplied to the
                                corona and heliosphere?
                             C. How does magnetic flux and matter
                                rise through the lower atmosphere,
                                and what role does flux emergence
                                play in powering flares and mass
                                ejections?
                                                      movies courtesy of Alan Title
Wednesday, March 10, 2010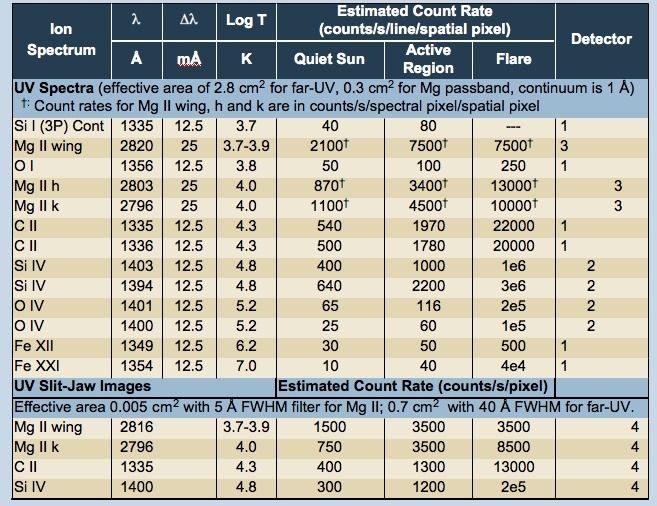
Why do we care about the chromosphere?
                               The  chromosphere   is where  most of the non-
 • Compatible high spatial and thermal energy that creates the corona and
   temporal resolution from    solar wind is released or transformed.
    photosphere to corona
                                   Chromosphere requires 50 times heating rate
                                   of corona, and provides all mass to
 • Wide spectral coverage          heliosphere
                                   A. What types of non-thermal energy
 • Magnetic Field in                   dominate in the chromosphere and
    Chromosphere                       beyond?
                                   B. How does the chromosphere regulate
 • Context/Complementarity            the mass and energy supplied to the
    (Great Observatory)               corona and heliosphere?

 • Numerical Simulations           C. How does magnetic flux and matter
                                      rise through the lower atmosphere,
           Tremendous                 and what role does flux emergence
         discovery space              play in powering flares and mass
                                      ejections?
Wednesday, March 10, 2010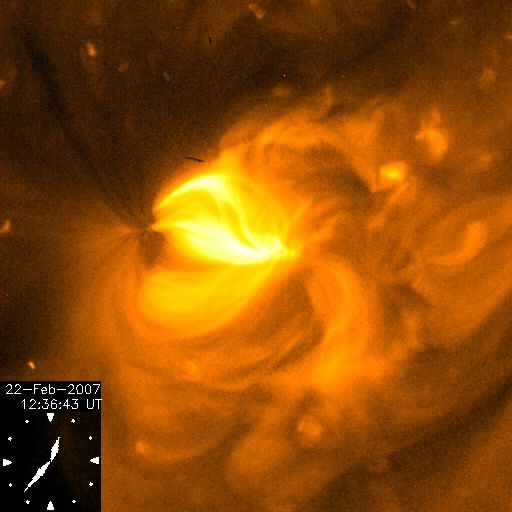
Solar C plan B will provide major breakthrough science

                 1.Source, propagation and dissipation of Alfven waves
                   that help drive solar wind,

                 2.Connection between chromosphere and corona:
                   mass cycle, constrain coronal heating models,

                 3.Magnetic field extrapolations from chromospheric
                   vector-magnetic data into heliosphere will allow
                   detailed accounting of helicity and magnetic free
                   energy that drive solar activity,

                 4.Heating of quiescent and active chromosphere.

                 5....

Wednesday, March 10, 2010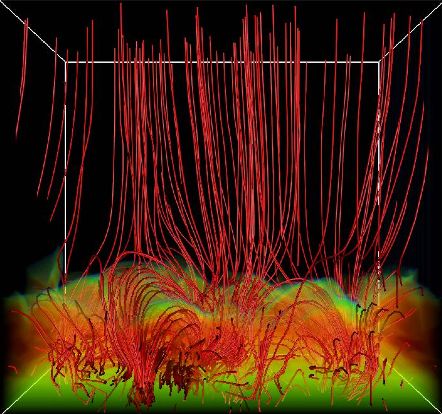
To determine energy and mass transfer from
           chromosphere into corona/heliosphere, we need
     1.A large observatory that obtains spectra and images that
       simultaneously cover the photosphere, chromosphere, TR and
       corona (from 4,000K to 10 MK),

     2.simultaneously at high spatial resolution (~0.2 arcsec),

     3.temporal resolution (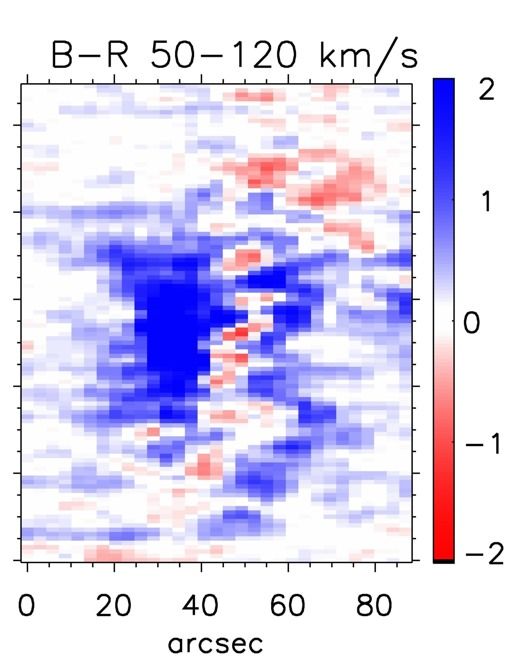
The chromosphere then... vs now...
                   1 arcsec, 30 s resolution vs 0.2 arcsec, 1.6 s resolution

  Heating to coronal temperatures?
(chromosphere & corona mass cycle)
         Transverse motions
 (Alfven wave supply to atmosphere)
   Dissipation of magnetic energy
           (reconnection)

                     Pre-Hinode                                 Hinode
                                Chromospheric dynamics occurring
                                   on timescales of order 1-10 s
                            Finescale structures on scales of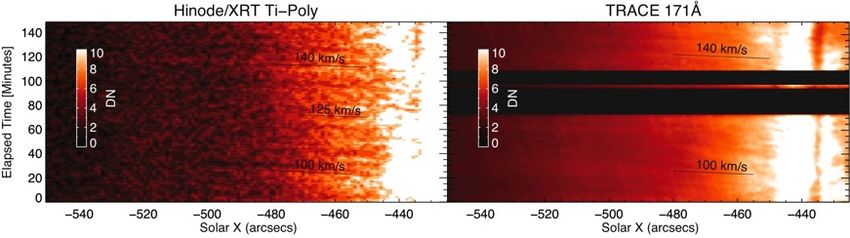
Observing the Roots of Coronal Heating -- In The Chromosphere
                                              Chromosphere-corona connection visible only
  Faint propagating disturbances
       (evaporated spicules)     in strong, but faint upflows, heated and propelled in chromosphere/TR,
                                                          enough mass to fill corona
                                                                                                       Blue Asymmetries
 time                                                                                                  in TR/coronal lines
                                                                  EIS TR & corona (0.5-2 MK)
                space                                                    Bright,gentle Faint upflows
                                                                         up/downflows 50-100 km/s
                                                                           ~10 km/s

                            XRT corona (3 MK)

                                                             Intensity     Doppler      Asymmetry

                                                                     SOT Ca II H chromosphere

                                                                                                       “Evaporating” Spicules
                      TRACE 171 corona (1 MK)

                        TRACE 1600 chromosphere (20,000 K)
                                                                                                          SOT Ca II H image

        Chromosphere-Corona connection visible in faint upflows (3rd and 4th moment of spectral lines)
Wednesday, March 10, 2010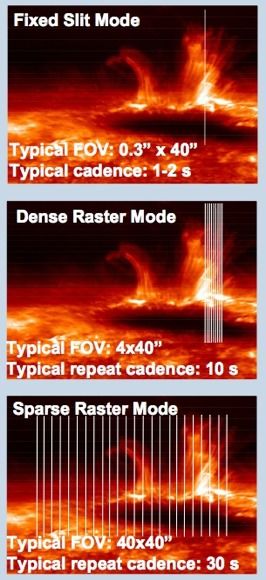
Using Line Asymmetries to Study Coronal Upflows
                                          3. Subtract signals in spectral windows
                                        equi-distant from core: Blue-Red asymmetry

                            Low-lying
                              loops Moss

                                                            2. Calculate centroid position

         Hinode/EIS (2 MK)            1. Fit single Gaussian to profile
Wednesday, March 10, 2010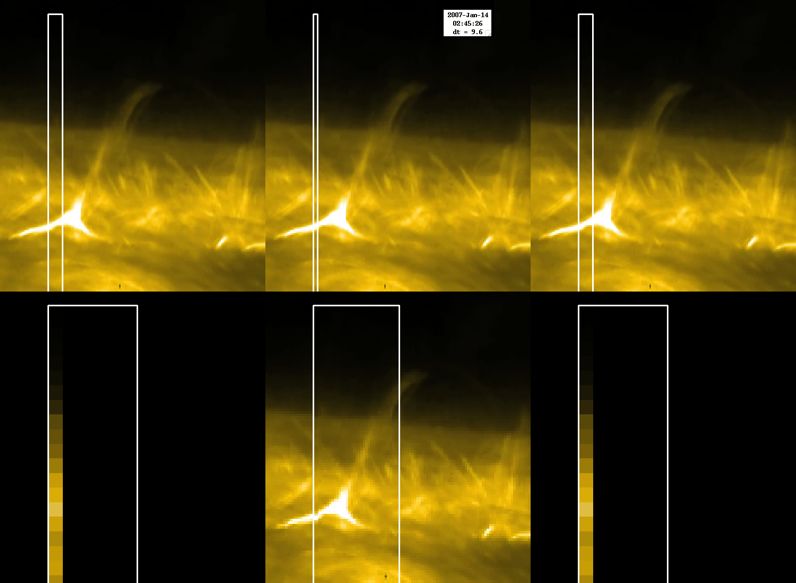
Using Line Asymmetries to Study Coronal Upflows
                                  3. Subtract signals in spectral windows
                                equi-distant from core: Blue-Red asymmetry

   Ubiquitous, faint (5-10%) upflows of 50-100 km/s seen in many TR
            Low-lying
   and coronal lines
                loops aboveMoss
                            AR/QS/CH network/plage with EIS, SUMER
   (incompatible w/current coronal nanoflare models)

      Requires: High S/N spectroscopy from chromosphere to corona at
      high spatial resolution (0.2-0.3 arcsec) and cadence (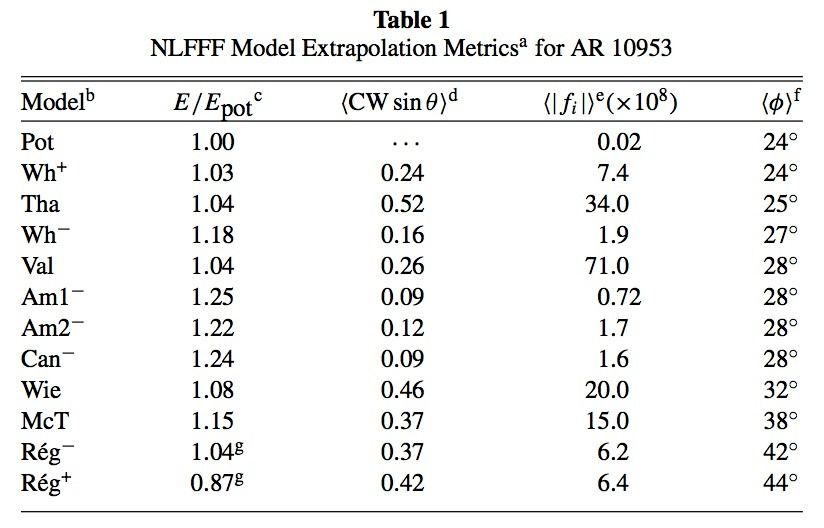
Outflows have been seen with TRACE and XRT,
         sometimes interpreted as propagating slow-mode waves

                                             “blobs” of plasma propelled outwards
                                           sometimes quasi-periodic ~3-20 minutes
                                                         V : 75-150km/s

                                                  Schrijver et al., Sol. Phys., TRACE first results, 1999
                                                          Sakao et al. 2007, Science, 318, 1585
                                              De Pontieu, McIntosh, Hansteen & Schrijver 2009, ApJL, 701, 1

                            TRACE  171Å
                            Hinode/XRT                 McIntosh & De Pontieu 2009, ApJL, 706, 80

    Asymmetries in EIS/SUMER profiles suggest TRACE/XRT/AIA should see short-
    lived (~100s) upflows of 100 km/s at 1-10% of background loop emission:
    Requires high S/N coronal imaging for wide range of T at high spatial resolution
Wednesday, March 10, 2010
Loops with propagating “blobs” show strong blueward line
asymmetries (EIS) at the footpoints for T=0.5 to 2 MK
0.5 MK 1.2 MK 1.6 MK
5% Asymmetry - Same velocity!
Visible in Unipolar Magnetic Regions
Across Many Temperatures
Co-spatial/temporal with “blobs”
Compare EIS & XRT De Pontieu, McIntosh, Hansteen & Schrijver 2009, ApJL, 701, 1
McIntosh & De Pontieu 2009, ApJL, 706, 80
Wednesday, March 10, 2010Plage below TR/coronal upflows (100 km/s) shows type II
spicules in Ca H at similar speeds
Hinode/SOT/BFI Ca IIH 20−Feb−2007 11:55:08.491
Compare EIS & SOT −50
Hinode/SOT/BFI CaIIH Bg. Sub. [8s Cadence, 0.4s Exposure]
50
−55
Solar Y [arcsecs]
−60
50
40
Time Elapsed Since 11:55:08.491 [Minutes]
−65
30
−70
30 100 km/s
−75 10
Counts
Hinode/SOT/BFI Ca IIH Background Subtracted
−50 −10
20
−55
−30
Solar Y [arcsecs]
−60
10 −50
−65
−70
−75 0
−484 −482 −480 −478 −476 −474 −472
−480 −470 −460 −450 −440 Solar−X [arcsecs]
Solar X [arcsecs]
5% Asymmetry - Same velocity!
Visible in/from unipolar magnetic regions!
Type-II Spicules!
Co-spatial/temporal with “blobs”
De Pontieu, McIntosh, Hansteen & Schrijver 2009, ApJL, 701, 1
McIntosh & De Pontieu 2009, ApJL, 706, 80
Wednesday, March 10, 2010Chromosphere/Corona Mass Cycle
Coronal Emission Line
Disk Center View
No Long Type-II Spicules in Ca II H Courtesy
Scott McIntosh
Asymmetric Coronal Line Profiles
I(λ)
Blue-Shifted
Coronal outflows
Component
Oblique/Limb View
Tall Type-II Spicules in Ca II H
Symmetric Coronal Line Profiles
λ0 λ
Heated Material Heated Material
Corona
Type-II
Coronal Emission Line
Spicules Cooling Material I(λ)
Upflows in the
Type-I
Spicules chromosphere λ0 λ
Buffeting Convective Flows
1. Emission in core of coronal lines dominated by emission from previously filled
loops (slowly cooling/evaporating plasma)
2. Chromosphere-Corona connection visible in faint upflows (3rd and 4th
moment of spectral lines)
3. Constrains coronal heating theories: coronal heating occurring at low heights?
Requires: High S/N spectroscopy & imaging from chromosphere to
corona at high spatial resolution (~0.2 arcsec) and cadence (Measuring line profile shapes important
Simulations courtesy Viggo Hansteen
Requires: High S/N spectroscopy & imaging from chromosphere to
corona at high spatial resolution (~0.2 arcsec) and cadence (Compatible resolutions for all T crucial
STEREO movie
171 A (1 MK)
80 s cadence
2.5 arcsec
pixels
CRISP overlay
Hα (0.01 MK)
10 s cadence
0.08 arcsec pixels
Wednesday, March 10, 2010High throughput crucial for slit-scanning spectrograph to allow
rapid rasters that track chromospheric/TR/coronal evolution
Simulated rasters on HINODE background
spectral context
raster image 6 arcsec
“IRIS” spectral raster &
“SUMER” raster context slit-jaw images “EIS” raster 16
Wednesday, March 10, 2010Solar C plan B will have great synergies with
Interface Region Imaging Spectrograph (IRIS) Small Explorer
Spacecraft Bus
Assembly
IRIS Electronics
Box (IEB)
Guide Telescope
Science Telescope
Spectrograph
17
Wednesday, March 10, 2010IRIS in brief
UV slit-jaw Images Realistic Radiative
Si IV (65,000K) 3D MHD models…
C II (30,000K)
Mg II h/k (10,000K)
Mg II h/k wing (6,000K) …to guide interpretation
20 cm UV telescope:
700
UV Spectra 6001/6 arcsec
Highpixels
nominal data rate
Far-UV 12.5 mÅ pixels kbit/sec multi-channel spectrograph
500
far-UV: 1332-1358 Å, 1390-1406
1390 Å,
Near-UV 25 mÅ pixels 40040 mÅ resolution, effective area 2.8 cm2
300near-UV:2785
2785-2835
- 2834 Å,
20080 mÅ resolution, effective area 0.3 cm2
100
slit-jaw imaging
01335 Å & 1400 Å with 40 Å bandpass each;
2790 2800
2800 2810
28102820
28202830
2830 SUMER
2796 CDS
Å & 2831
2831 Å with EIS SOT-SP
44 Å bandpass IRIS
each.
SOHO Hinode 18
Wednesday, March 10, 2010IRIS spectra and slit-jaw imaging covers
the photosphere, chromosphere, transition region
Wednesday, March 10, 2010Solar C plan B will be able to resolve
structures from chromosphere to corona
IRIS
Solar Cb
Wednesday, March 10, 2010Compared to IRIS, Solar C plan B will
1.provide better spatial resolution for a wide range of
temperatures,
2.provide critical magnetic field measurements
(photosphere, chromosphere),
3.will have much larger FOV (using FPI) compared to
IRIS’ slit-based spectrograph: flares, large-scale
evolution,...
4.provide the high temperature coverage that IRIS
lacks (much higher S/N spectra and imaging).
Wednesday, March 10, 2010Fabry-Perot Interferometers (FPI) required
to track rapid chromospheric dynamics
~3 line positions/s → 25 positions in 6.8 s
FWHM 66 mÅ
movie courtesy of Luc Rouppe van der Voort
Wednesday, March 10, 2010Hα -1.3Å (-60 km/s) Hα line core
Fabry-Perot Interferometers invaluable to study rapid, fine-scale
chromospheric dynamics (e.g, disk counterparts of type II spicules)
movie courtesy of Luc Rouppe van der Voort
Wednesday, March 10, 2010FPI observations reveal rapid blueshifted events, constraining formation
Chromospheric Observations
mechanism of type II spicules by showing heating and acceleration
Hα-50 km/s Hα Line center Typical Hα Profile
Doppler Velocity Width
Ca 8542 Dopplergram Ca 8542 Line center Typical Ca 8542 Profile
Doppler Velocity Width
Rouppe van der Voort, Leenaarts, De Pontieu, Carlsson,Vissers, 2009
Wednesday, March 10, 2010Seeing-free observations critical for chromospheric studies
Case study: Alfven waves carried by spicules
(with enough flux to power solar wind)
Wednesday, March 10, 2010Very general: many inclined lines in xt-cuts of unsharp masked data
Typically: thin spicules moving laterally by 0.5 Mm, at ~10-25 km/s
Time [s]
Space (x [Mm])
Wednesday, March 10, 2010These transverse motions had been detected before in ground-based data
Transverse motions of order 0.1-0.5 arcsec ~ same scale as seeing distortions
Seeing-free observations crucial
Wednesday, March 10, 2010Non-thermal energy deposition: Alfven waves
Hinode/SOT Ca II H data
(10,000 K)
CoMP data: Fe XIII
(1.5 MK)
Coronal Amplitude should be
Alfvenic Waves with of order 30-50 km/s, not 0.5-1 km/s
Amplitudes of ~ 20 km/s
and Periods 100-1000 s
Flux ~ 100 erg/cm2/s
Enough to power solar wind
De Pontieu et al., 2007
Solar C chromospheric
data will help reveal Alfvenic Waves with Amplitudes of ~ 0.5-1 km/s
origin of these waves and Periods 100-1000 s
Tomczyk et al., 2007, Tomczyk & McIntosh, 2009, McIntosh et al., 2010
High-resolution CoMP-like observations of transverse incompressible
waves in the corona can provide seismology, but also insight in non-
thermal energy deposition
Wednesday, March 10, 2010How do magnetic fields impact chromosphere dynamics?
Formation of type II spicules
Stokes Stokes Stokes H-alpha Ca II H
V Q U -1.2 A 3968 A
Need chromospheric vector magnetic data at various heights to
study non-thermal energy deposition in chromosphere
Hinode Hinode Hinode
SP NFI BFI
Connection between photospheric magnetic fields
and chromospheric energy deposition difficult to establish
Wednesday, March 10, 2010Importance of chromospheric field measurements
green: Joule heating
grey: TR
courtesy Juan Martinez Sykora
(LMSAL, UiO)
3D radiation MHD simulations indicate
jet formation triggered at chromospheric heights
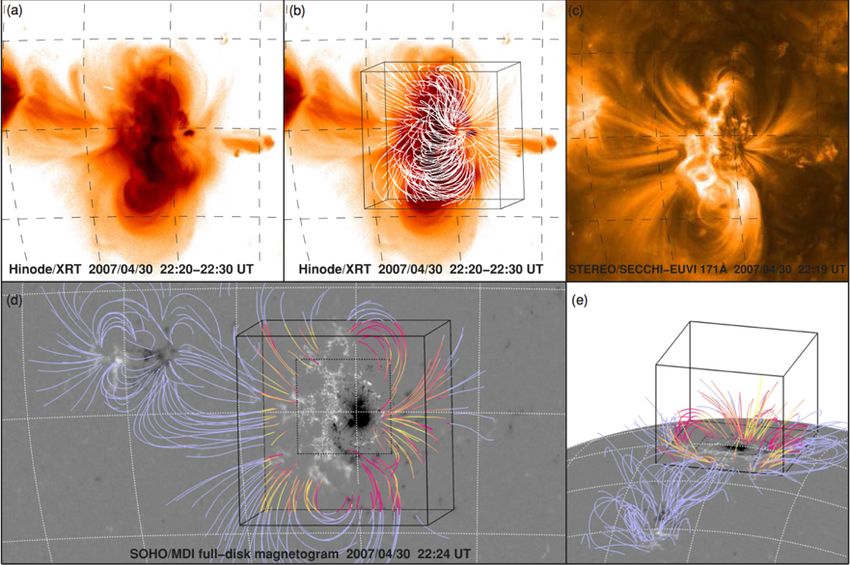
Wednesday, March 10, 2010Magnetic Field
non-linear force free field extrapolations
Extrapolation from photospheric field magnetograms problematic
Images from DeRosa et al., 2009
Wednesday, March 10, 2010Magnetic Field
non-linear force free field extrapolations
Extrapolation from photospheric field magnetograms problematic
courtesy DeRosa et al., 2009
Wednesday, March 10, 2010Non-linear force free field (NLFFF) extrapolations
•NLFF algorithms do not yield consistent solutions for
solar data
•Photosphere is not force-free, i.e., many (most?) currents
seen at the photosphere do not reach the corona
•Successful application likely requires :
•large field of view at high resolution (connectivity to
surroundings)
•'preprocessing’ of lower-boundary vector field (non-force
free to force-free)
•measurement of vector field at top of chromosphere?
• [Schrijver et al. 2006 (SPh 235, 161), 2008 (ApJ 675, 1637), Metcalf et al. 2008 (SPh 247, 269), DeRosa et al. (2008,
ApJ 696, 1780).
Wednesday, March 10, 2010To determine energy and mass transfer from
chromosphere into corona/heliosphere
1.A large observatory that obtains spectra and images that
simultaneously cover the photosphere, chromosphere, TR and
corona (from 4,000K to 10 MK),
2.simultaneously at high spatial resolution (~0.2 arcsec),
3.temporal resolution (You can also read