Some Observations on the Solar Eclipse March, 20th, 2015, 0 - 2 MHz
←
→
Page content transcription
If your browser does not render page correctly, please read the page content below
Some Observations on the Solar Eclipse
March, 20th, 2015, 0 - 2 MHz
During a solar eclipse, the moon draws its shadow onto the earth. For a moment it gets „night“ with similar
consequences at daily nightfall - at least regarding the ionosphere, see Figure 1.

Figure 1: The structure of the ionosphere changes according to the radiation of the sun. Most important for obeservations during a
solar eclipse is the vanishing of the D-layer which attenuates lower frequencies – e.g. on medium wave. Source: IPS.

To analyze some effects, I recorded the range from 0 to 2 MHz from 08:00 UTC to 14:00 UTC on March 20th
when a solar eclipse occured over the north of Europe – see Figure 2, next page.
    Reeceiver was SDR-IP form RFSpace, antenna a passive wire quadloop of 20 m circumference. The recor-
ding had been analysed with Simon Brown‘s „SDR Data File Analyser“.
    As you yee from Figure 1, a solar eclipse strongly effects the D-layer. This, in turn, largely influences
propagation on the lower frequencies as the D-layer attenuates this range. Hence, we should see rising signals
as the moon shadow arrives and a somewhat slower decay when it vanishes. On the other hand, the D-layer
reflects VLF frequencies (Ionospheric Radio, by Kenneth Davies. London, 1996, pp 142). That means that we
should observe dropping signals in this range.
    What signals do we have to observe? They should be on all the time with a stable carrier. Fortuneately,
engough, there still are many broadcasters in Europa and even in Germany these days - opposed to some

                                                                                           © 2015, Nils Schiffhauer, DK8OK — 1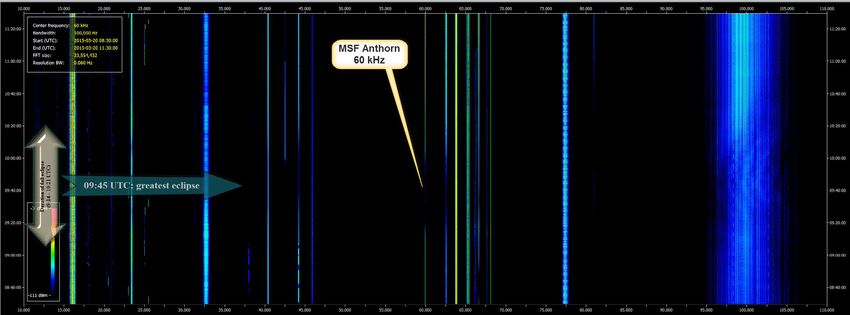
wrong information given by German ham radio organisation DARC e.V. The eclipse of 2015 may be so-
mewhat unique, as it takes place at a time where we have SDRs with their broad-band recording capabili-
ty at hand, plus having a lot of appropriate stations to do our observations. Most stations will cease their
operation within the next years. It‘s a pity that the interest in observing the influence of this (in Germany)
partial solar eclipse has been near total among the special interest media. I tried to get some information
published beforehand, but they were bluntly boycotted. Instead, they published simply wrong information.

Figure 2: Total Eclipse of March 20th, 2015. Insert: shadow at greatest eclipse. Source: NASA‘s GSFC.

                                                                                          © 2015, Nils Schiffhauer, DK8OK — 2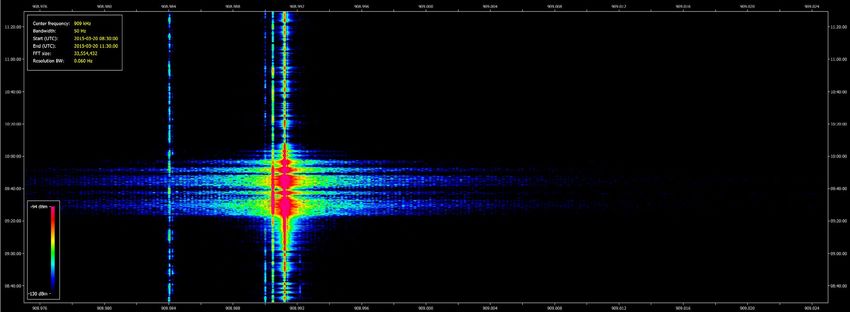
The whole Picture
After having recorded the 2 MHz band, a first inspection indeed shows some enhancements of some medium
wave channels during the eclipse – see Figure 3. And some dropping of signals on VLF – see Figure 4.

Figure 3: The range from 800 to 1.600 kHz clearly shows an enhancement of signals during the solar eclipse on medium wave.

Figure 4: On frequencies from about 20 kHz to 100 kHz you see just the opposite effect – signals do drop during solar eclipse. Fre-
quencies below 20 kHz remain nearly uneffected. But even LORAN at 100 kHz drops a bit. The British time signal station MSF at
Anthorn is a good example because its path to my location is largely in the dark during this solar eclipse.

How to proceed
First, I would like to concentrate on enhance, i.e. on the long and medium wave band. Then I will turn to
frequencies below 100 kHz.
    On long and medium wave, mostly broadcast stations had been observed. As often some stations do share
one channel, you have scrutinize what data you really get. Some experts did say: „Just observe the S-meter!“
This is totally misleading, as you then get just the sum of all stations on this channel!
    Fortunately enough, most stations do have a slight offset from their nominal channel. This makes it most-
ly easy to separate them from each other – see Figures 5 to 9.
    For these analyses, the realm of reliable information of MWLIST had been usesd This multi-national ef-
fort does also provide offsets, i.e. small and mostly un-intended deviation from the nominal channel. During
my session, the SDR-IP has not been disciplined by GPS frequency control because this introduces a slight
sawtooth-like „modulation“ onto a carrier. Hence, absolute freqeuncies may differ by some Hz (mostly: -12
Hz), but the relative order of offsets on a given nominal channel of course keeps applying.
    Also audio had been used to identify some stations.

                                                                                            © 2015, Nils Schiffhauer, DK8OK — 3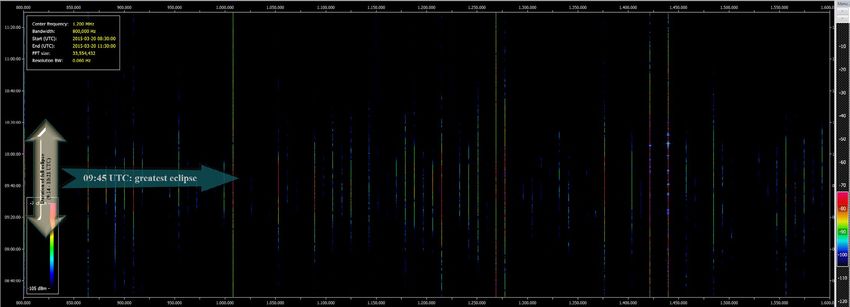
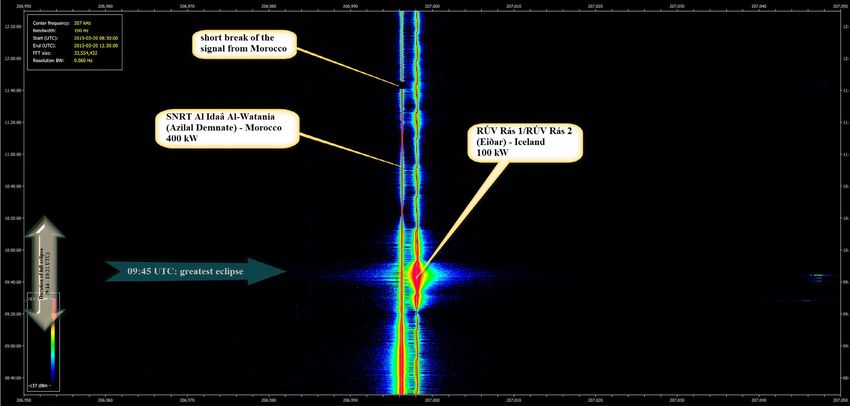
Figure 5: Channel 207 kHz has attracted much interest because on this frequency there is a transmitter in Reykjavik just north of
the total eclipse. But this is not the only station on this frequency as this screenshot reveals.

Figure 6: This is what you get if you follow the „experts‘“ advice: „Just look at the S-meter.“ It seems to nicely match what some
people did expect as effect of the solar eclipse – a strong enhancement from the Iceland signal. But you should be warned by the
near-symmetry of the trace, as the build-up of the D-layer should take more time than its vanishing. See next Figure.

Figure 7: Here you see only the signal trace of the station from Iceland/100 kW, on the east coast of this island. The trace is nor
more symmetrical, but shows a steep slope in the beginning (plus an even sharper and shorter dip at 09:21 UTC when the total
eclipse starts!), and a more smooth decay. Also observe the sinusoidal from of the trace from 11:40 UTC which cannot be seen in
Figure 6. See next Figure for the trace of the signal from Morocco.

                                                                                             © 2015, Nils Schiffhauer, DK8OK — 4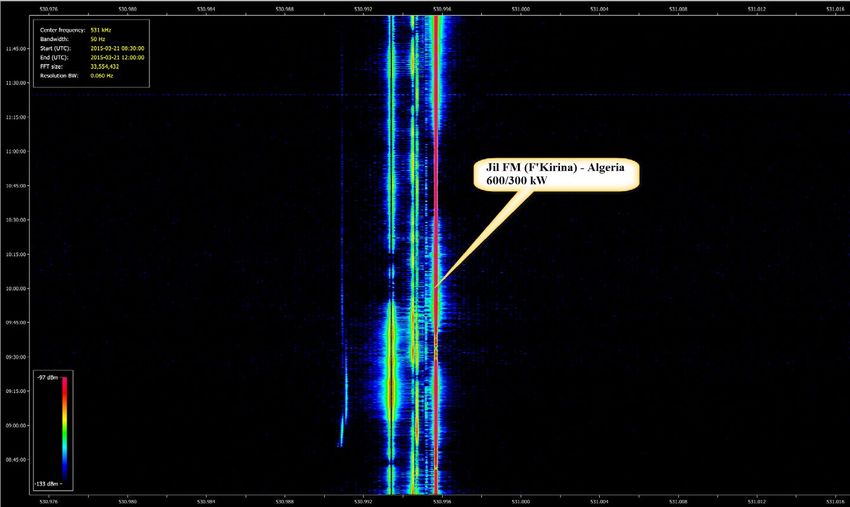
Figure 8: This is the trace of the signal from Morocco/400 kW, some Hz down from the signal from Iceland. You clearly see e.g. a
short break of the transmitter between 11:40 to 11:45 UTC – as in Figure 5.

Figure 9: On a channel with only one station you do not need any separation – as here Allouis/France on 162 kHz.

Figure 10: Belarus on 279 kHz also is the only station on this channel, and its propagation is also affected by the solar eclipse.

                                                                                               © 2015, Nils Schiffhauer, DK8OK — 5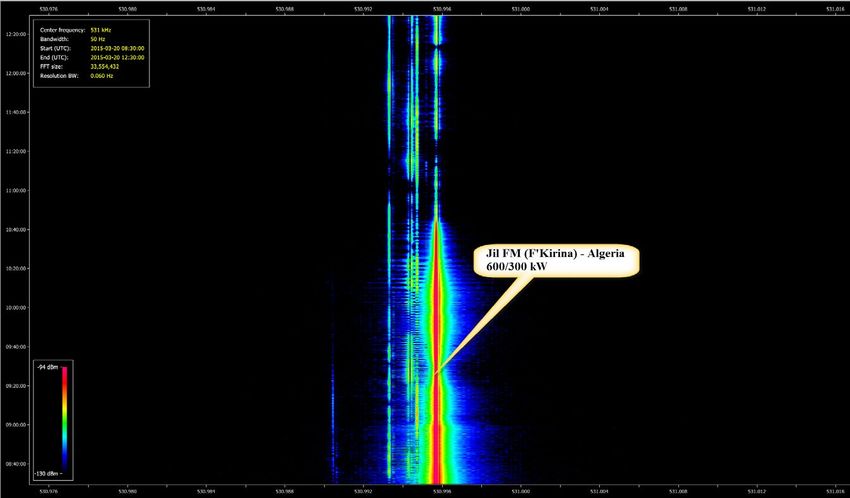
Some Examples
As the solar eclipse occured north of my location, it seemed to be a good idea first to check how signals from
the north had been affected by this phenomenon.
    Consider already as first example Figure 7, Iceland (and really just Iceland …) on 207 kHz. Let‘s proceed
with another channel from this country:

Figure 11: Iceland on 189 kHz (300 kW) and on the west coast of this island shows a somewhat different picture than on 207 kHz at
Figure 7. The dip is not that sharp.

Kringvarp Føroya 531 kHz/25 kW should have made easy going, but Jil FM from Algeria was prevalent.
Even when comparing the traces on this channels with them of the next day, I coudn‘t make out the station
from the Faroe Islands 100% sure – see Figures 11 and 12. Quite disappointing.

                                                                                     Figure 12: The strong Algerian made it dif-
                                                                                     ficult to identify the sation from the Faroe
                                                                                     Islands on the date of the solar eclipse …

                                                                                     Figure 13: … as well as on the day after.

                                                                                         © 2015, Nils Schiffhauer, DK8OK — 6
For some cluster channels from the UK the solar eclipse made an excellent enhancement. Unfortunately,
their frequencies are mostly GPS-disciplined, hence no specific offset can be noted to identify their locations.

Figure 14: BBC Radio 5 Live, 909 kHz. Twelve locations, up to 400 kW (Moorside Edge).

                                                                                                Audio at 10:28 UTC

                                                                                                Audio at 10:03UTC

                                                                                                Audio at 09:38 UTC

Figure 15: TalkSPORT, 1.053 kHz. 13 locations, up to 500 kW (Droitwich).

                                                                           Figure 16: Absolute Radio, 1.215 kHz. 14 locations,
                                                                           up to 200 kW (Moorside Edge).

                                                                                        © 2015, Nils Schiffhauer, DK8OK — 7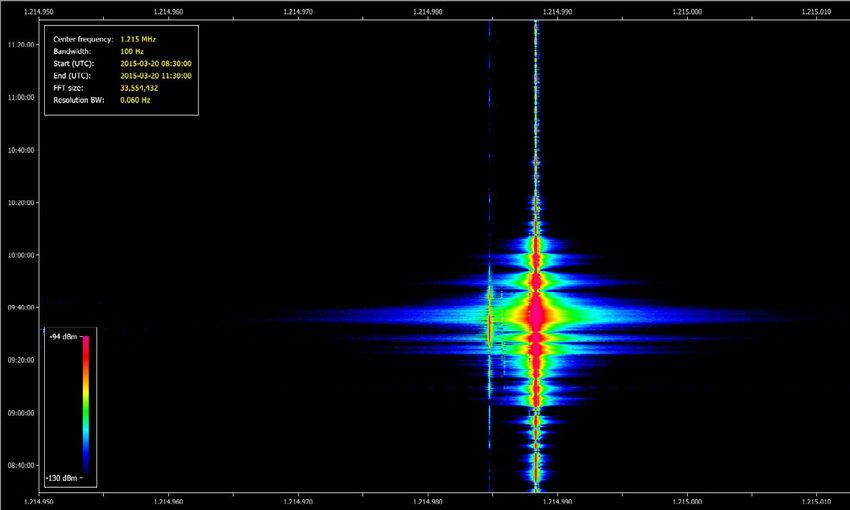
Figure 17: France Info 603 kHz/Lyon, 300 kW. There is some enhancement also for stations in the west and on low medium wave …

Figure 18: … as on the higher medium wave, here with France Bleu/Strasbourg, 1.278 kHz, 300 kW.

Figure 19: An interesting catch had been Radio North from Ireland with 1 kW on 846 kHz. Without the solar eclipse, no recption is
possible here at that time of the day.

                                                                                          © 2015, Nils Schiffhauer, DK8OK — 8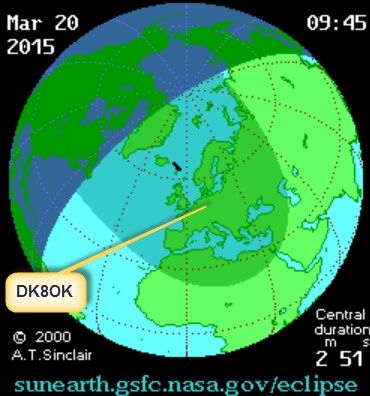
Figure 20: Groot Nieuws Radio on 1.008 kHz Flevoland/The Netherlands, 100/200 kW. Provides a stable signal here in Germany,
but was puzzled by the solar eclipse, including some considerable enhancement.

                                                                                       © 2015, Nils Schiffhauer, DK8OK — 9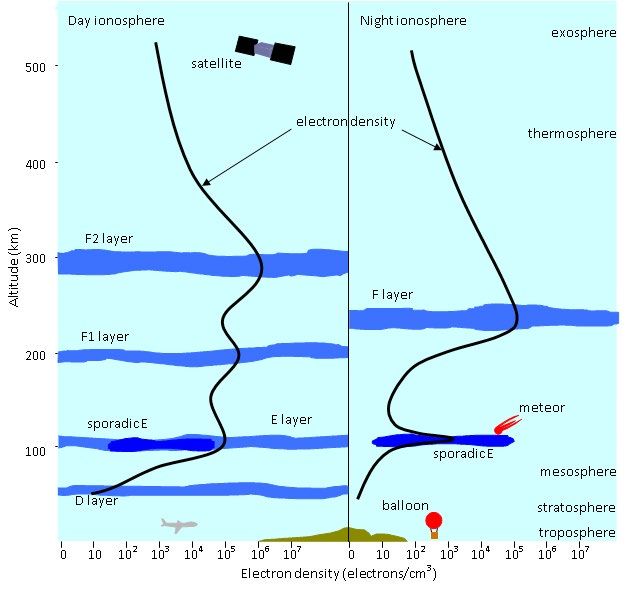
VLF and the lower Part of Long Wave
As you have seen from Figure 4, a solar eclipse does attenuate low frequencies (under e.g. 100 kHz), while
enhancing long wave and medium wave. The transition frequency depends on several aspects, and will vary
according to the actual ionisation of the specific day.
    VLF is the range from 3 to 30 kHz, long wave from 30 kHz to 300 kHz, as per ITU definition.
    Please find below some findings from these low frequencies during the eclipse of March 20th, 2015.
    Due to time limitation, they haven‘t been further commented.
    For this and other analysis on your own you must have a look onto the propagating path between the
transmitter and my location 52.27N 10.01E. In the next step you have to visualize the trace of the moon‘s
shadow over time to see how it is affecting the path.

Figure 21: French Navy, HWU, 20,9 kHz.

Figure 22: German Navy, DHO38, 23,4 kHz – Ramsloh.

Figure 23: U.S. Navy, NAA, 24,0 kHz – Cutler/Maine.

                                                                         © 2015, Nils Schiffhauer, DK8OK — 10
Figure 24: U.S. Navy, NRK, 37,5 kHz – Keflavik/Iceland. The peak at 09:54 UTC is local noise.
Figure 25: Swedish Navy, SRC, 40,4 kHz – Varberg/Sweden.
Figure 26: MSF Anthorn, 60 kHz – U.K.
© 2015, Nils Schiffhauer, DK8OK — 11Figure 27: French Navy, FUB, 62,6 kHz.
Figure 28: DCF77, 77,5 kHz, Mainflingen/Frankfurt/Germany.
Figure 29: U.K. Navy, GYN2, 81,0 kHz, Crimond/U.K.
© 2015, Nils Schiffhauer, DK8OK — 12To Do
Due to lack of time, I have to postpone to realize some other ideas, e.g.:
• compare different paths on the same frequency
• compare different paths on different frequencies
• compare noise on different frequencies
• visualize doppler effects during the eclipse (some experiments with 60 kHz and 1.008 kHz and soft-
ware SBSpectrum hasn‘t been too promising – the frequencies seem just to low, and the time of the
eclipse too short in respect to the sampling time of 40+ seconds using the 2,5 Hz window which is
needed)
As all data has been recorded, I may come back to these things – maybe also with reference to the work of
others.
Some additional Reading
Although written back in 1972, the 68-pager VLF, LF, and MF Signal Propagation by the U.S. Navy makes a
fine Firs Aid. See also here.
The dip before and after the signal enhancement of longwave signals by the eclipse does give many traces a
W-like shape. An international team of ham radio operators around Michael Sanders, PA3SBH, developed
1999 a mathematical model for illustrating this, see here.
© 2015, Nils Schiffhauer, DK8OK — 13You can also read