Q2 2021 Results Presentation - Aug. 2021

Page created by Sally Morrison
 
CONTINUE READING
Q2 2021 Results Presentation - Aug. 2021
Q2 2021 Results Presentation
           Aug. 2021
Q2 2021 Results Presentation - Aug. 2021
Safe Harbor Statement

This presentation has been prepared by Viomi Technology Co., Ltd (“Viomi” or the “Company”) solely for informational purposes
and does not constitute an offer to sell or issue or the solicitation of an offer to buy or acquire securities of the Company in any
jurisdiction or an inducement to enter into investment activity, nor may it or any part of it form the basis of or be relied on in
connection with any contract or commitment whatsoever. This document has been prepared by the Company solely for use at this
presentation. The information contained in this presentation, including the Company’s unaudited financial and operating results for
the second quarter of 2021, has not been independently verified. No representation, warranty or undertaking, express or implied, is
made as to, and no reliance should be placed on, the fairness, accuracy, completeness or correctness of the information or the
opinions contained herein. None of the Company or any of its affiliates, directors, officers, advisors or representatives will be liable
(in negligence or otherwise) for any loss howsoever arising from any use of this presentation or its contents or otherwise arising
from or in connection with this presentation.

This presentation contains forward-looking statements that are made under the “safe harbor” provisions of the U.S. Private
Securities Litigation Reform Act of 1995. These statements include descriptions regarding the intent, belief or current expectations
of the Company or its officers with respect to the consolidated results of operations and financial condition of the Company, which
can be identified by terminology such as “will,” “expects,” “anticipates,” “future,” “intends,” “plans,” “believes,” “estimates,” “confident”
and similar statements. Such forward-looking statements are not guarantees of future performance and involve risks and
uncertainties, and actual results may differ from those in the forward-looking statements as a result of various factors and
assumptions. The Company or any of its affiliates, directors, officers, advisors or representatives has no obligation and does not
undertake to revise forward-looking statements to reflect new information, future events or circumstances after the date of this
presentation, except as required by law.

                                                                                                                                                2
Q2 2021 Results Presentation - Aug. 2021
Agenda

1. Financial and Operating
   Highlights

2. Recent Developments

3. Appendix

                             3
Q2 2021 Results Presentation - Aug. 2021
Q2 2021 Financial Highlights

                                                               Gross Profit Margin                                 Net Income Attributable to Ordinary                                      Non-GAAP Net Income Attributable
                    Net Revenues
                                                                                                                             Shareholders                                                      to Ordinary Shareholders(1)

              RMB1.7 Bn                                                 21.2%                                                  RMB46.1 MM                                                        RMB59.5 MM
                                                                    (+6.9% y-o-y)                                                 (+367.4% y-o-y)                                                  (+44.9% y-o-y)

Note
1. “Non-GAAP net income attributable to ordinary shareholders” is defined as net income attributable to ordinary shareholders of the Company excluding share-based compensation expenses.
                                                                                                                                                                                                                               4
Q2 2021 Results Presentation - Aug. 2021
1H 2021 Financial Highlights

                                       Own-branded Net   Net Income Attributable to Ordinary
 Net Revenues    Gross Profit Margin
                                       Revenue Growth              Shareholders

RMB2.9 Bn            21.2%                29.5%               RMB95.2 MM
(+19.0% y-o-y)     (+5.5% y-o-y)           (y-o-y)              (+242.0% y-o-y)

                                                                                               5
Q2 2021 Results Presentation - Aug. 2021
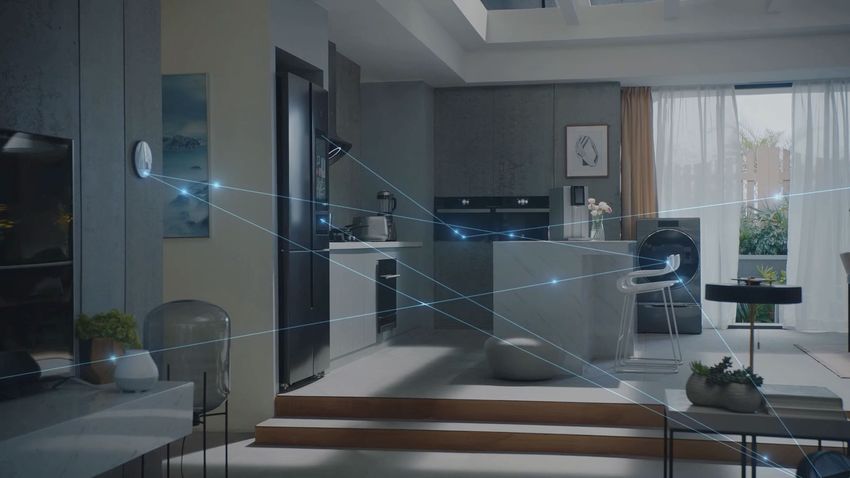
Further Product and Channel Diversification (Q2 2021)

Revenue Breakdown by Product Category       Revenue Breakdown by Channel

                 11.5%         13.2%
            Small Appliances   Home Water
              and Others        Solutions

     6.2%
   Consumables

                                                     56%             44%
                                                  Viomi Business Xiaomi Business

                         69.1%
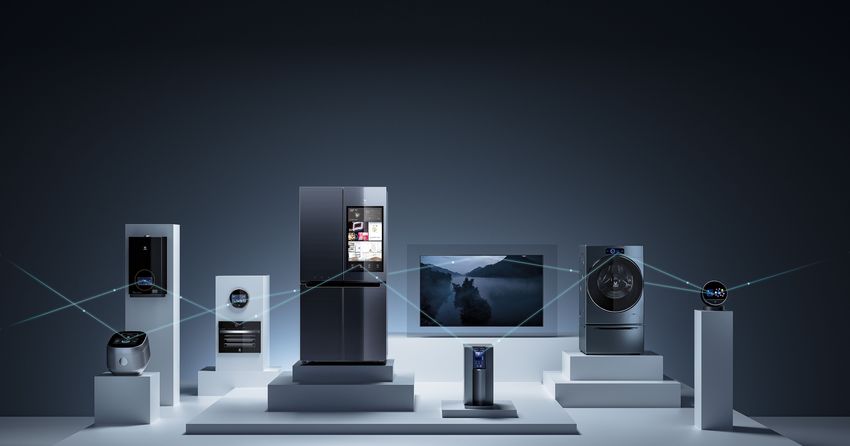
                   IoT @ Home Portfolio

                                                                                   6
Q2 2021 Results Presentation - Aug. 2021
Healthy Balance Sheet

                  Liquidity Position(1)
                  (RMB MM)

                      Short-term deposits
                      Short-term investments               1,127.9
                      Cash and cash equivalents             66.5

                                                            393.8

                                                            667.6

                                                           Q2 2021

Note
1. As of June 30, 2021.                                                   7
Q2 2021 Results Presentation - Aug. 2021
Continued Increase in
                                           Household Users and Product Penetration
                    Number of Cumulative Household Users(1)            Percentage of Household Users with
                    (‘000)                                             at least 2 Connected Products(1)

                                                                                                                20.7%
                                                                                                      20.4%
                                                              ~5,900                        20.0%
                                                                                  19.5%
                                                                        19.0%
                                                     ~5,600
                                           ~5,100
                                  ~4,600
                      ~4,200

                    Q2 2020 Q3 2020           1
                                           Q4 2020   Q1 2021 Q2 2021   Q2 2020   Q3 2020   Q4 2020   Q1 2021   Q2 2021

Note
1. At end of respective period.                                                                                          8
Q2 2021 Results Presentation - Aug. 2021
Outlook

 Q3    Net revenues:

2021   RMB1.0 billion to RMB1.1 billion

                                          9
Q2 2021 Results Presentation - Aug. 2021
Recent Developments
Our Corporate History and Roadmap
                                                                                                                                                                   1H 2021
                                                                                                                                                                   Continued Product Portfolio
                                                                                                                 2020                                              Optimization and Overseas
                                                                                                                                                                   Expansion
                         2018                                      2019                                          Announced 2030 “3511”
                         Established IoT @ Home                    Announced 5G + IoT                            Long-term Strategic Vision                      • Hosted 2021 strategic new product launch event
                                                                                                                                                                   with the theme of AI: Helpful
                         Platform                                  Strategy                                     • Enhanced 5G IoT strategic vision and
                                                                                                                                                                 • Continued introducing new high-end products
                        • Established comprehensive IoT product   • Published “Consumer IoT Outlook 2025”         introduced next-gen products and services,
                                                                                                                  including premium water purifier brand         • Accelerated overseas market expansion
                          portfolio
2014                    • Successfully completed IPO on Nasdaq
                                                                    together with IDC
                                                                  • Established 5G research institute             Quanxian, sweeper robots and large-screen      • Published ”trending tech” branding positioning and
                                                                                                                  refrigerators with diverse content offerings     invited top celebrity as the product spokesman
Company Co-founded        (Ticker: VIOT)                            together with major network carriers
                                                                  • Introduced WUKONG AI chip                   • Established agreement with local               • Cooperated with high-quality merchants for
Together with Xiaomi                                                                                                                                               opening larger offline stores
                                                                                                                  government for Viomi IoT Tech. Park project

                 2015                                        2016 - 2018                                                   2019 – 1H 2021
                 First Product Launch                        Continued Cooperation                                         Expanded Cooperation
                 Initial launch of Xiaomi                    • Continued collaboration with Xiaomi on                      • Introduced additional Xiaomi-branded product categories, including
                 water purifier                                water purifiers and consumables                               refrigerator, range hood, sweeper robot, blender and dishwasher
                                                             • Introduced additional products, including                   • Introduced additional SKUs of Xiaomi water purifiers
                                                               kettles, water pitchers, water quality meters,
                                                               various household items, etc.

                                                                                                                                                                                                                 11
Recent Developments
                   July 2021                                        July 2021                                    August 2021

  Published “trending technology” brand                                                          Advertised on Focus Media and Xinchao
                                                          Reinforced our one-stop
positioning and invited a top celebrity as the                                                   Media, covering around 100 major cities
                                                    comprehensive IoT @ Home solutions
           product spokesperson                                                                               across China

                   July 2021                                      June 30, 2021                                  July 20, 2021

                                                   Entered into a strategic partnership with   Participated in the 2021 China (Guangzhou)
      Cooperated with good-quality                China Unicom (Guangdong) for 5G Smart         International Building Decoration Fair with a
     merchants to open larger stores                     Home Strategic Program                series of new AI products in a home scenario

                                                                                                                                                12
Recent Developments
                   July 20, 2021                                         June, 2021                                     May, 2021

 Entered into partnership agreements with iQiyi,      During the “618” E-commerce Shopping
                                                   Festival, many of our products became viral hits      Water purification patents awarded
 Douguo app, Haoxiang Shopping and Lingbiao
                                                      and ranked among the top 10 bestsellers            the China Excellent Patent Award
Technology to enhance cross-industry cooperation

                   April 14, 2021                                        April 14, 2021                                April 14, 2021

                                                        April 14, 2021

    Hosted 2021 “AI: Helpful” Strategic New            Introduced new SKUs of sweeper robot               Launched EROx water purifier which
            Product Launch Event                                    Alpha series                      retains beneficial minerals for human health

                                                                                                                                                     13
Appendix
Selected Unaudited Financial Data
Selected Unaudited Income Statement Data
                                                                                                                                                                         For the Three Months Ended June 30
                                                                                                                                                   Q2 2020                                       Q2 2021      Q2 2021
(in thousands)                                                                                                                                      (RMB)                                         (RMB)        (USD)
Total Revenues                                                                                                                                   1,684,364                                      1,658,904     256,932

Total Cost of Revenues                                                                                                                          (1,443,402)                                    (1,307,072)    (202,440)

Gross Profit                                                                                                                                       240,962                                       351,832       54,492

Operating Expenses

   Research and Development Expenses                                                                                                              (60,670)                                       (66,188)     (10,251)

   Selling and Marketing Expenses                                                                                                                 (162,107)                                     (214,777)     (33,265)

   General and Administrative Expenses                                                                                                            (16,665)                                       (28,770)      (4,456)

Total Operating Expenses                                                                                                                          (239,442)                                     (309,735)     (47,972)

Other Income                                                                                                                                        7,220                                          5,070        785

Income from Operations                                                                                                                              8,740                                         47,167       7,305

Interest Income and Investment Income                                                                                                               7,097                                          8,860       1,372

Other Non-operating Income                                                                                                                            594                                          (402)        (62)

Income before Income Tax Expenses                                                                                                                   16,431                                        55,625       8,615

Income Tax Expenses                                                                                                                                (6,114)                                        (9,210)      (1,426)

Less: Net Income Attributable to the Non-controlling Interest Shareholders                                                                            460                                           341          53

Net Income Attributable to Ordinary Shareholders of The Company                                                                                     9,857                                         46,074       7,136

Share-based Compensation Expenses                                                                                                                  31,218                                         13,431       2,080

Non-GAAP Net Income Attributable to Ordinary Shareholders of The Company(1)                                                                        41,075                                         59,505       9,216
Note                                                                                                                                                                                                                      15
1. “Non-GAAP net income attributable to ordinary shareholders of the Company” is defined as net income attributable to ordinary shareholders of the Company excluding share-based compensation expenses
Selected Unaudited Balance Sheet Data
                                                             As of December 31, 2020   As of June 30, 2021   As of June 30, 2021
(in thousands)                                                        (RMB)                   (RMB)                 (USD)
Assets
Current Assets
  Cash and Cash Equivalents                                         504,108                 667,573                  103,394
  Restricted Cash                                                    70,601                  21,505                   3,331
  Short-term Deposits                                                   -                    66,525                  10,303
  Short-term Investments                                            696,051                 393,788                  60,990
  Accounts and Notes Receivable from Third Parties                  427,352                 362,899                  56,206
  Accounts Receivable from A Related Party                          609,094                 557,861                  86,402
  Other Receivables from Related Parties                             88,038                 148,949                  23,069
  Inventories                                                       439,375                 558,100                  86,439
  Prepaid Expenses and Other Current Assets                          87,280                 160,306                  24,828
  Long-term deposits due within one year                             10,000                  60,000                   9,293
Total Current Assets                                                2,931,899               2,997,506                464,255
Total Non-current Assets                                            247,620                  231,953                 35,925
Total Assets                                                        3,179,519               3,229,459                500,180

Current Liabilities
  Accounts and Notes Payable                                        1,001,371               1,102,055                170,687
  Advances from Customers                                           112,613                  78,502                  12,158
  Amount due to Related Parties                                     124,192                   5,852                    906
  Accrued Expenses and Other Liabilities                            335,488                 318,689                  49,359
  Income Tax Payables                                                50,962                  36,953                   5,723
  Lease Liabilities due within One Year                              9,481                   12,391                   1,919
Total Current Liabilities                                           1,634,107               1,554,442                240,752
Total Non-current Liabilities                                        15,093                  17,490                   2,709
Total Liabilities                                                   1,649,200               1,571,932                243,461

Total Shareholders’ Equity                                          1,530,319               1,657,527                256,719
Total Liabilities and Shareholders’ Equity                          3,179,519               3,229,459                500,180
                                                                                                                                   16
Thank You!
IR Contact: ir@viomi.com
You can also read