Norwegian Air Shuttle ASA - Q1 2019 Presentation 25 April 2019
←
→
Page content transcription
If your browser does not render page correctly, please read the page content below

Norwegian Air Shuttle ASA
Q1 2019 Presentation        25 April 2019
Highlights Q1 2019

  Completed
                Strengthened balance sheet through a fully underwritten rights issue of NOK 3 billion to increase
 preferential   financial flexibility and create headroom to the covenants of the outstanding bonds
 rights issue

                Sold and delivered two A320neo aircraft with a cash effect of USD 26 million
Delivering on
                In Q1 the Company has postponed delivery of 12 737 MAXs and four A321LRs, reducing 2019
the strategic   capex by USD 200 million
    shift
                Added two 787-9s to operations

  Continued     FOCUS2019: Exceeded Q1 target by reaching NOK 467 million in cost reduction (target from Q4
  working on    2018 presentation: NOK 400 million)
 operational
improvements    Improved punctuality by 8.2 p.p. compared to Q1 2018

                EBITDAR excl other losses/gains improved to NOK -716 million (NOK -840 million) despite
   Q1 2019      negative Easter impact in the quarter
  financials
                                                                                                                2
Load factor of 81 % in Q1 2019

                                                   17 % growth in capacity (ASK)

                                                   12 % growth in traffic (RPK)

                                               30,000                                       ASK       Load Factor                                  100%

                                                                                                               85.2 %                              90%
                                                                                                                        84.4 %   84.5 %
                                                                                                     83.0 %
                                                                                                                                          81.0 %
                                               25,000
                                                                          77.2 %   76.1 %   77.3 %                                                 80%
                                                        75.1 %   74.3 %

                                                                                                                                                   70%
                                               20,000

                                                                                                                                                   60%

                                               15,000                                                                                              50%

                                                                                                                                                   40%
                     Available Seat KM (ASK)

                                               10,000
                                                                                                                                                   30%

                                                                                                                                                          Load Factor
                                                                                                                                                   20%
                                                5,000

                                                                                                                                                   10%

                                                   0                                                                                               0%
                                                        Q1 10    Q1 11    Q1 12    Q1 13    Q1 14    Q1 15     Q1 16    Q1 17    Q1 18     Q1 19

            ASK                                         3,507    4,498    5,266    6,378    9,421    10,056    11,803   14,649   19,995   23,457
            Load Factor                                 75.1 %   74.3 %   77.2 %   76.1 %   77.3 %   83.0 %    85.2 %   84.4 %   84.5 %   81.0 %

                                                                                                                                                                 3
8.1 million passengers in Q1 (+9 %)

                                                            10

                                                            9                                                                                + 9%

                                                            8

                                                            7

                                                            6

                                                            5

                                                            4

                                                            3
                                     Passengers (million)

                                                            2

                                                            1

                                                            0
                                                                 Q1 10   Q1 11   Q1 12   Q1 13   Q1 14   Q1 15   Q1 16   Q1 17   Q1 18       Q1 19

            PAX (mill)                                            2.7     3.1     3.6     3.9    4.9     4.9     5.8     6.7     7.5          8.1
            PAX 12 mos. rolling (mill)                           11.3    13.4    16.3    18.0    21.6    24.0    26.6    30.1    34.0        38.0

                                                                                                                                         4
Contiued passenger growth at all key airports

                                                                                                                               5
 Source: 12 month rolling passengers as reported by Avinor, Swedavia, Copenhagen Airports, Finavia, Gatwick Airport and Aena
Revenue per country

   7 % revenue growth in the Nordics on a 12 months rolling basis
   Largest absolute growth in the US, both in Q1 and 12 months rolling

Growth in revenue by origin in Q1 19* (y/y):                           Revenue split by origin in Q1 19*:

    Revenue growth in Argentina was 1,377 % due to low capacity last
    year, and is excluded in this graph
                                                                                                            6
 * 12 months rolling (estimated)
A network of more than 60 intercontinental routes

                                              7
Fleet plan before further aircraft divestment
              Deliveries 787-9     Deliveries 737 MAX                      Re-delivery 737-800
2019:
               +1,690 seats            +3,024 seats                            -186 seats

                                 Considering sale of additional aircraft

                                                                                            8
Significant improvement in on-time performance

Q1 2019 OTP
 Introduced on-time performance
 project in April-May 2018
 Punctuality in Q2 2019 increased
 by 8.2 p.p.
 Huge improvement in the long
 haul operation (+22 p.p.)
 Seven consecutive months with
 positive punctuality development
 Number of long arrival delays
 (>3h) reduced by 43 %, despite a
 13 % increase in flights operated

                                                 9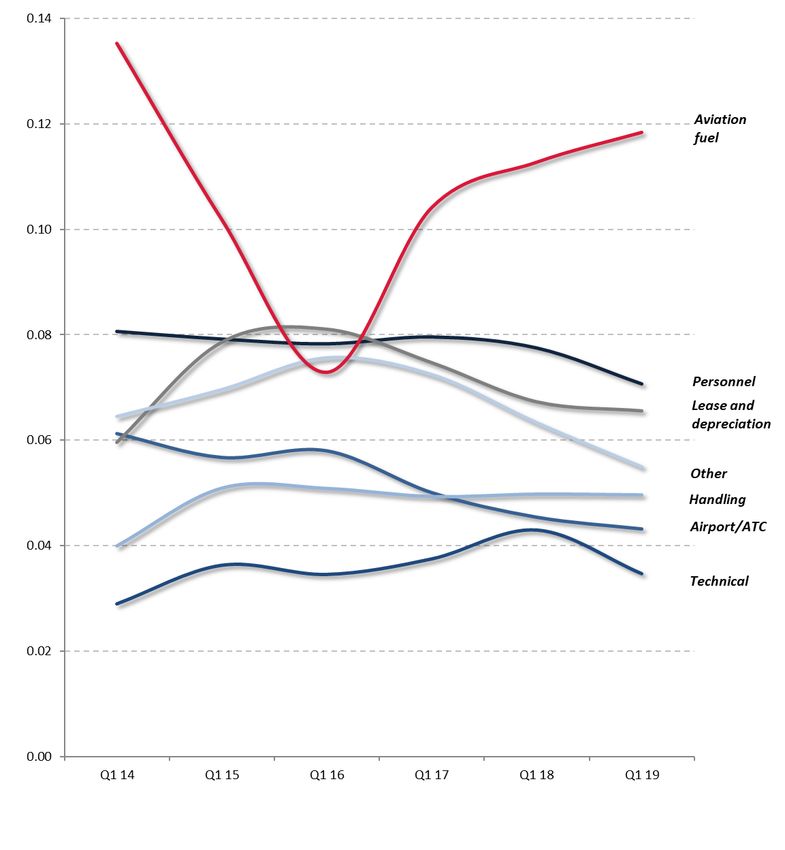
Financials

             10
Profit and loss
Positive P&L effect of NOK 883
million from fuel hedge gains
Negative IFRS 16 effect on EBT
of NOK 175 million due to
expenses the first half of a lease
period
Reclassification of NOFI holding
in Q1 2018 improved net financial
items by NOK 1.9 billion
11Unit revenue negatively impacted by Easter
Q1 unit passenger revenue (RASK) -3 % to 0.27 (-4 % in constant
currency), negatively impacted by Easter effect
Ancillary revenue per passenger increased by 3 % to NOK 167
Cargo revenue increased by 34 % to NOK 217 million
9,000
+ 14 %
8,000
7,000
6,000
5,000 Other
Ancillary
4,000 Passenger
Total revenue
3,000
2,000
NOK million
1,000
0
Q1 15 Q1 16 Q1 17 Q1 18 Q1 19
Total revenue 4,034 4,961 5,256 6,993 7,992
Passenger 3,221 3,971 4,074 5,511 6,299
% y/y chg 11 % 23 % 3% 35 % 14 %
Ancillary 676 802 919 1,211 1,358
% y/y chg 29 % 19 % 15 % 32 % 12 %
Other 137 188 263 271 334
% y/y chg 7% 37 % 40 % 3% 24 %
12Unit cost excluding fuel decreased by 8 %
Unit cost excl fuel decreased by 8 % (decreased by 11 % in constant currency)
Unit cost incl fuel decreased by 5 % (decreased by 10 % in constant currency)
0.60 CASK excl leasing, depreciation and fuel
Leasing and depreciation
0.55
Fuel
0.50
0.11
0.45 0.12 0.15
0.10
Operating cost EBIT level per ASK 0.40
0.13
0.14
0.07 0.10
0.11
0.06 0.12
0.35 0.06
0.06 0.08
0.08 0.07
0.06 0.07
0.30 0.06
0.07
0.25
0.20
0.35
0.33 0.31
0.15 0.29 0.29 0.30 0.29 0.28
0.28
0.25
0.10
0.05
0.00
Q1 10 Q1 11 Q1 12 Q1 13 Q1 14 Q1 15 Q1 16 Q1 17 Q1 18 Q1 19
Unit cost 0.52 0.51 0.52 0.48 0.47 0.47 0.45 0.47 0.46 0.44
Unit cost excl fuel 0.41 0.39 0.37 0.35 0.33 0.37 0.38 0.36 0.35 0.32
13Reduction in all cost elements except fuel Higher fuel cost (+5 % per ASK) driven by stronger USD vs NOK (+9 %), partly offset by lower fuel spot price (-3 %) and efficiency gains Lower personnel cost (-9 % per ASK) due to increased utilization of crew following FOCUS2019 initiatives Lower lease and depreciation (-3 % per ASK) due to IFRS 16 effects, partly offset by grounding of 787s and a stronger USD vs NOK Lower other operational expenses (-13 % per ASK) due to several FOCUS2019 initiatives and timing effect from IFRS 15 Unchanged handling cost has developed in line with production increase Lower airport/ATC cost (-5 % per ASK) due to increased sector length and renegotiations with suppliers Lower technical cost (-19 % per ASK) due to FOCUS2019 initiatives and compensation for 787 grounding 14
FOCUS2019: Exceeded Q1 target by reaching
   NOK 467 million in cost reduction

                                                                                                                          Actual
    Cost area                                          Completed cost initiatives
                                                                                                                         (MNOK)

                      •   Negotiations with airports have led to lower charges and additional bonuses
 Airport, handling    •   Negotiations with technical suppliers have led to lower prices and better visibility of cost
and technical costs   •   Increased performance in the technical supply-chain has improved reliability
                                                                                                                          197
                      •   Increased effectiveness of handling routines at all stations

                      •   Increased crewing efficiency and reduced hotel and transportation costs
    Operating
                      •   Streamlined setup of support services through process efficiency and governance                 205
    efficiency
                      •   Ongoing dialogue with unions in several countries

                      •   Reduced total spend on external service providers and consultants
  Procurement,
                      •   Renegotiated sourcing agreements and reduced licensing costs                                     50
  admin and IT
                      •   Ongoing effort to professionalize group procurement function

   Commercial,
                      •   Renegotiated marketing agreements and realized internal marketing synergies
  marketing and
                      •   Optimized in-flight services and improved catering supply chain
                                                                                                                           15
 product offering

       Total                                                                                                              467

                                                                                                                            15
FOCUS2019: Cost bridge
9,477
288
-467
-302
8,708
1,356
7,833
Cost* Q1 2018 Production Currency & Fuel Base cost Focus 2019 Other & IFRS Cost* Q1 2019
increase Q1 2019
16
*Total operating expenses excl other losses/gains, lease and depreciationBalance sheet
IFRS 16 increased assets and
liabilities by NOK 32.8 billion as
operating leases are added to the
balance sheet
Aircraft that are sold but not delivered
are classified as non-current assets,
while the associated debt is classified
as current liability
17Cash flow
NOK million Q1 2019 Q1 2018 The IFRS 16 effect was +1,323 on
Profit before tax -1,978 -515 operating activities and -1,323 on
Paid taxes -8 -53 financing activities
Depreciation, amortization and impairment 1,546 336
Changes in air traffic settlement liabilities 4,923 4,492 The two 787s delivered in Q1 was
Changes in receivables -3,951 -3,240 financed through SLB
Other adjustments -755 -1,154
Net cash flows from operating activities -221 -135
Purchases, proceeds and prepayment of tangible assets 2,455 -3,628
Other investing activities 7 9
Net cash flows from investing activities 2,462 -3,619
Loan proceeds 525 3,607
Principal repayments -3,714 -748
Financing costs paid -705 -400
Proceeds from issuing new shares 2,907 450
Net cash flows from financing activities -987 2,910
Foreign exchange effect on cash -26 8
Net change in cash and cash equivalents 1,229 -836
Cash and cash equivalents at beginning of period 1,922 4,040
Cash and cash equivalents at end of period 3,151 3,204
18IFRS 16 transition effects
NOK billion 88.8 88.8
32.8 -32.8
56.0 56.0
31 Dec 2018 Transition effects 1 Jan 2019 1 Jan 2019 Transition effects 31 Dec 2018
ROU assets lease liabilities
ASSETS EQUITY & LIABILITIES 19IFRS 16 income statement effects in Q1 2019
NOK billion
-1,086
1,264
59 -412
-1,802
-1,978
EBT ex IFRS 16 IFRS 16 OPEX IFRS 16 Aircraft lease IFRS 16 Depreciation IFRS 16 Interest costs EBT incl IFRS 16
20Capital expenditure and financing
Capital expenditures
Postponed aircraft deliveries in Q1 and Q2 to create financial headroom
and move capex commitments of USD 2.1 billion from 2019 and 2020
Capital commitments (all aircraft incl PDP)
2019 2020
Total contractual commitments USD 1.7 billion USD 1.2 billion
(previous estimate: USD 2.0 bn) (previous estimate: USD 2.4 bn)
Boeing 737 MAX 16 8
Boeing 787-9 5 5
Airbus 320/321 1 4
Long-term financing
Financed the two Dreamliner deliveries in Q1 with SLB
Utilizing a mix of long-term financing with focus on AFIC and export credits
going forward
21Outlook
22Estimated unit cost reduction of 2 % compared
to Q1 2018
Unit cost estimates 2019
Approximately NOK 0.30 incl depreciation costs excl fuel (previous
estimate: 0.295-0.300)
Approximately NOK 0.42 incl depreciation costs and fuel (previous
estimate: 0.4075-0.4125)
Including up to NOK 500 million effect of grounding of Boeing 737
MAX aircraft
Due to the uncertainty related to the MAX grounding, the company
see increased risk related to the target of a positive net profit in
2019
Assumptions: Fuel price of USD 655/mt (613), USD/NOK 8.27
(8.18), EUR/NOK 9.62 (9.55). Based on the current route portfolio
and planned production
Estimated production growth (ASK)
5-10 % ASK growth in 2019
23Expect positive RASK development in Q2
Fuel hedging (unchanged)
53 % of H1 2019 at USD 681
38 % of FY 2019 at USD 680
Markets and business
Current bookings indicate a positive RASK development in Q2
Continued positive development in long haul
Soars to #1 in New York as leading foreign airline, demonstrating a
strong foothold in the US market
24Continued focus on the strategic change
from growth to profitability in 2019
Reducing CAPEX by USD 2.1 billion in total through restructuring of fleet order and
Creating postponement of aircraft deliveries for 2019 and 2020 in total
headroom and
Contracted sales of 15 aircraft with delivery in 2019 with a total cash effect of approximately
improving USD 170 million and consider further aircraft sales
financial
flexibility Reached agreement with Airbus about restructuring of fleet order, subject to contractual
documentation agreement
FOCUS2019: Continuing efforts to reduce costs and confident to reach target of NOK 2 billion
Operational
improvements Optimization of base structure and route network, as well as streamlining the organization
Working on contracting wet leases and increasing utilization to make sure production is covered
throughout August
Grounding of
the Boeing Currently expecting up to NOK 500 million effect of grounding of Boeing 737 MAX fleet
737 MAX fleet
25Book tickets at
Fly Norwegian
Norwegian.com
26You can also read