Opel/Vauxhall Strategic Plan Michael Lohscheller, CEO Opel Automobile GmbH - Automotive ...

Page created by Connie Burton
 
CONTINUE READING
Opel/Vauxhall Strategic Plan Michael Lohscheller, CEO Opel Automobile GmbH - Automotive ...
Opel/Vauxhall Strategic Plan
Michael Lohscheller, CEO Opel Automobile GmbH

                                                1
Opel/Vauxhall Strategic Plan Michael Lohscheller, CEO Opel Automobile GmbH - Automotive ...
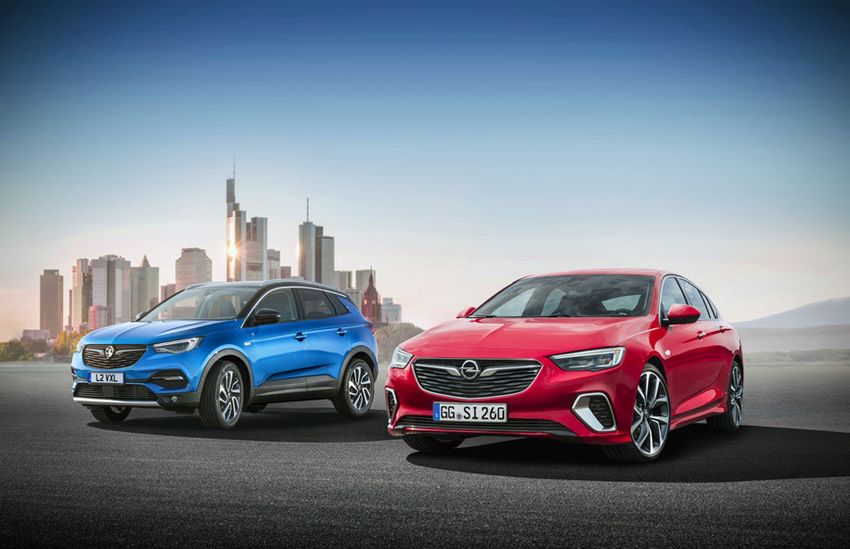
STATUS QUO IS NOT AN OPTION

 New competitive mindset reflected in the plan‘s name

 Profitability       Performance
 Agility             Accountability
 Collaboration       Customer focus
 Enablement          Empowerment

                                                        Foto: jamesteohart – fotolia.com
                                          2
Opel/Vauxhall Strategic Plan Michael Lohscheller, CEO Opel Automobile GmbH - Automotive ...
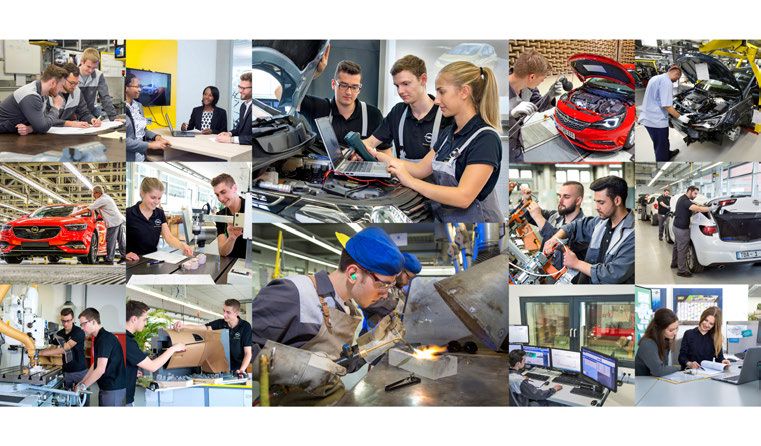
PEOPLE ARE THE SOLUTION TO MAKE OPEL/VAUXHALL FIT FOR THE FUTURE

                                3
Opel/Vauxhall Strategic Plan Michael Lohscheller, CEO Opel Automobile GmbH - Automotive ...
LEVERAGE GROUPE PSA’S STRENGTH

                                        New European champion: #2 in Europe

                                          Sales: 4.3 million units worldwide

                                          Automotive revenue: € 55 billion

                                         Combined purchasing power of € 38.8 billion

                                         > 40 plants + 10 R&D centers

                                     > 200,000 employees

                                 4
Opel/Vauxhall Strategic Plan Michael Lohscheller, CEO Opel Automobile GmbH - Automotive ...
CREATING A SUSTAINABLE FUTURE

   Positive Operational Free Cash Flow*
                 by 2020

Automotive Recurring Operating Margin**
              2% by 2020
              6% by 2026

       * Defined as ROI + D&A – capex –Capitalized R&D –Change in NWC
       ** Recurring Operating Income related to Revenue
                                                                        5
Opel/Vauxhall Strategic Plan Michael Lohscheller, CEO Opel Automobile GmbH - Automotive ...
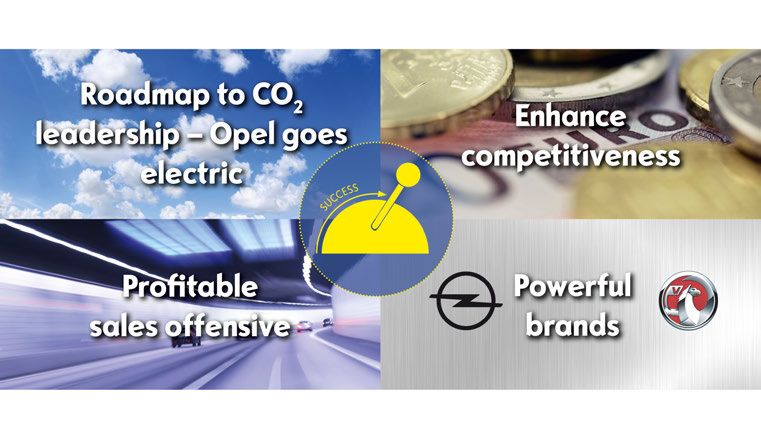
LOWER FINANCIAL BREAK-EVEN POINT TO 800,000 CARS:
GENERATE PROFIT, LOWER EXPOSURE TO HEADWINDS

                                 6
Opel/Vauxhall Strategic Plan Michael Lohscheller, CEO Opel Automobile GmbH - Automotive ...
4 LEVERS OF “PACE!”

7

    Foto: Trout55, The-Tor, kokoroyuki – istockphoto.com / Herbie – fotolia.com
Opel/Vauxhall Strategic Plan Michael Lohscheller, CEO Opel Automobile GmbH - Automotive ...
4 LEVERS OF “PACE!”

8

    Foto: Trout55, The-Tor, kokoroyuki – istockphoto.com / Herbie – fotolia.com
Opel/Vauxhall Strategic Plan Michael Lohscheller, CEO Opel Automobile GmbH - Automotive ...
CLEAR ROADMAP TO CO2 LEADERSHIP – OPEL GOES ELECTRIC

 Adapting portfolio and electrification strategy
 to reach 95 g CO2 EU 2020 target
     Current
   identified                   Utilize
  difference to   Adapting    Groupe PSA      Other
   95 g target    Portfolio   technology     actions

                                                           2020: 4 electrified carlines (incl. Grandland X and next gen. Corsa)

                                                           2024: 100% of European passenger cars with electrified options
                               Path to CO2
                               compliance

                                                       9
Opel/Vauxhall Strategic Plan Michael Lohscheller, CEO Opel Automobile GmbH - Automotive ...
4 LEVERS OF “PACE!”

10

     Foto: Trout55, The-Tor, kokoroyuki – istockphoto.com / Herbie – fotolia.com
ENHANCE COMPETITIVENESS – IMPROVE COST EFFICIENCY AND SYNERGIES

    Annual Synergies Groupe PSA

                       € 1.7 Bn
      € 1.1 Bn

        2020            2026

                                        *Full realization by 2022

                                  11
ENHANCE COMPETITIVENESS – COST EFFICENCIES IN ALL AREAS

                                     • Cost reduction of € 700 per car by 2020

                                     • Improve fixed marketing expenses
                                       efficiency by more than 10% by 2020

                                     • Ratio G&A/revenue from 5.6% to 4.7%
                                       by 2020

                                     • Improve efficiency to benchmark levels for
                                       manufacturing and logistics cost as well as
                                       wage cost/revenue ratio*

                                     *Revenue and wages of the automotive division

                                12
ENHANCE COMPETITIVENESS – COMPLEXITY REDUCTION IN ENGINEERING

                                           Full passenger car model line-up will
                                           be based on joint Groupe PSA
                                           architectures by 2024
               eCMP BEV

                          EMP2 PHEV

                                      13
ENGINEERING CENTER RÜSSELSHEIM: HOME OF ALL NEW O/V VEHICLES

                                     • German DNA: All new O/V vehicles
                                       engineered in Rüsselsheim

                                     • Using Groupe PSA technologies (platforms,
                                       modules, powertrains)

                                     • Joint R&D and Capex sized at 7-8% ratio on
                                       automotive revenue

                                     • O/V engineering skills will be fully leveraged
                                       within Groupe PSA

                                14
ENGINEERING CENTER RÜSSELSHEIM: GLOBAL COMPETENCE CENTERS

                                    • Rüsselsheim engineering will be key
                                      contributor to Groupe PSA global R&D

                                    • First centers of competence identified:
                                      • US market federalization for vehicles &
                                         powertrains
                                      • Fuel cell
                                      • Alternative fuels
                                      • Certain automated driving & driver
                                         assistance developments
                                      • Electric/Electronic test automation
                                      • Software configuration & release

                               15
ENHANCE COMPETITIVENESS – CLOSE THE PERFORMANCE GAP VS. BENCHMARK

                                    • Improve manufacturing and logistics
                                      performance by > € 400 per car by 2020*

                                    • Main levers:
                                      • Components diversity: - 50%
                                      • Rightsize plant space requirements: -25%
                                      • Increase utilization > 100% by 2020, e.g. by
                                        moving volumes from Korea to Europe
                                      • Capex from 6% to 4% of revenue in 2020
                                        through improvement in carry over of tools

                                    * Included in the € 700 cost per car reduction

                               16
ENHANCE COMPETITIVENESS – HIGHER EFFICIENCY AND PLANT INVESTMENTS

                                    • Plant performance plans to allow allocation
                                      of new Opel/Vauxhall models and create
                                      opportunities to produce PCD* vehicles, as
                                      per existing cross-manufacturing

                                    • Localization of CMP and EMP2 platforms in
                                      Opel/Vauxhall plants

                                    • Starting with Eisenach (SUV, EMP2 based)
                                      and Rüsselsheim (D-segment, EMP2 based)

                                    • Allocation of new powertrains in Opel/Vauxhall
                                      manufacturing sites to accompany the shift
                                      from GM to PSA engines and gearboxes
                                    *PCD = Peugeot, Citroën, DS Automobiles

                               17
4 LEVERS OF “PACE!”

18

     Foto: Trout55, The-Tor, kokoroyuki – istockphoto.com / Herbie – fotolia.com
POWERFUL BRANDS – CLEAR BRAND POSITIONING

                                            Innovation accessible to all

                               19
VIDEO „THE FUTURE IS EVERYONE‘S“

                                   20
POWERFUL BRANDS – CLEAR BRAND POSITIONING

                                              Great design and
                                            ingenious technology

                               21
POWERFUL BRANDS – UNIQUE OPEL/VAUXHALL DESIGN WILL REMAIN A USP

                               22
POWERFUL BRANDS – FOCUS ON PRICING POWER

     Pricing gap versus benchmark in Europe G7 (%)*          • 40% of sales volume from SUVs by 2021

                                                             • Optimize channel mix/strengthen
                                                               market share in retail and fleet

                                   *In retail channel

                                                        23
POWERFUL BRANDS – QUALITY

                                 Significant improvements of quality, customer
                                 sa7sfac7on, service quality and brand loyalty
                                                                               Direct Run Rate
                                                                                        vs benchmark
                                        2015                 2016                 2017                  2018               2019             2020
                                                                                                                                             0
                                                                                                                             -1

                                                                                                         -2
                                                             -2.6
                                                                                  -3.2

                                        -4.7

                                                                                Brand Loyalty*
                                                                                         vs benchmark

                                        2015                 2016                 2017                          2020                        2024

                                                                                                                                             0
                                                                                                                  -7
                                                                                  -13
                                        -15                  -15

                                 *Source: International studies vs. industry benchmark
                                 Direct Run Rate defined as percentage of cars leaving the manufacturing line w/o the necessity of rework
                                 Brand Loyalty: Percentage of customers replacing their vehicle with a model from the same brand

                            24
4 LEVERS OF “PACE!”

25

     Foto: Trout55, The-Tor, kokoroyuki – istockphoto.com / Herbie – fotolia.com
PROFITABLE SALES OFFENSIVE – NEW MODELS

                                      • One major launch per year on
                                        Groupe PSA architectures from 2018

                                      • Total of 9 launches – including
                                        bodystyles – until 2020

                                      • Reduce complexity and focus on key
                                        options/versions

                               26
PROFITABLE SALES OFFENSIVE – DEVELOP LCV BUSINESS

                                     • 2018: New Combo launch

                                     • Exploring further markets

                                     • 2020: Start of electrification of
                                       LCV portfolio

                                                Increase LCV sales >25% by 2020

                                27
PROFITABLE SALES OFFENSIVE – ENLARGE FRONTIERS

                                     • Increase overseas export sales:
                                        • Double sales by 2020
                                        • >10% of global sales
                                          by mid next decade

                                     • Enter > 20 new markets by 2022

                                     • Explore profitable worldwide mid-term
                                       opportunities

                                28
FURTHER PROFIT AND REVENUE DRIVERS

                                     • Aftersales Business: > €100 million operating
                                       profit improvement until 2020

                                     • New possibilities thanks to strengthened
                                       Financial Services
                                       • Introduction of full service leasing
                                       • Increase penetration of financial offers,
                                          services and insurance products through
                                          access to very competitive cost of funds

                               29
KEY TAKE-AWAYS

                 Ø Reshape product portfolio strategy
                 Ø 100% European passenger carlines with electrified option by 2024

                 Ø   Implement synergies: €1.1 billion p.a. by 2020 / € 1.7 billion p.a. by 2026
                 Ø   Lower break even point to 800,000 units
                 Ø   Release Working Capital: €1.2 billion by 2022
                 Ø   Lower wage costs/revenues ratio to industry benchmark
                 Ø   Engineering: All new Opel/Vauxhall vehicles will be engineered in Germany
                 Ø   Rüsselsheim: First O/V competence centers identified for Groupe PSA
                 Ø   Increased competitiveness will secure plants’ future
                 Ø   Intention to maintain and modernize all plants and to refrain from forced
                     redundancies
                 Ø Clear brand positioning : Opel will stay German, Vauxhall will stay British

                                                                                                   Foto: Trout55, The-Tor, kokoroyuki – istockphoto.com / Herbie – fotolia.com
                 Ø Enhance Pricing Power: Improvement by 4 percentage points vs.
                   benchmark by 2020

                 Ø Launch 9 new vehicles until 2020; LCV sales + >25% by 2020
                 Ø Increase overseas sales to > 10% of global sales by mid of next decade
                 Ø Strengthen Financial Services with full service leasing offers

                  30
T H A N K YO U
Carlos TAVARES
                       Chairman of the Managing Board

Rüsselsheim, 9 November 2017
          DCOM                                          Mensuelle Com Dec 2016 / C2
BRING OPEL VAUXHALL BACK ON A PROFITABLE GROWTH PATH

                Market share                           Financial losses
                  (Europe)                               (Cumulated)

       9.22 %                                                             $19bn

                               5.72 %

         1999                  2016            1999                       2016

                                        2
ORGANIC PROFITABLE GROWTH

             OPERATIONAL EXCELLENCE

DCOM                                  Mensuelle Com Dec 2016 / C2
BUILD SUSTAINABLE BASIS

      Recurring Operating Margin*                                Worldwide Unit Sales**                           Cumulated Free Cash Flow (€bn) ***
          Automotive Division                                         (in millions) 3.15                                   Since end 2013
                               7.3%                                                                    1.58                                   + 1.6
                                                                    2.9         3.0                                                      8.1 2017 H1
                              2017 H1                                                                2017 H1
                                                      2.8
                 5.0%    6.0%                                                                                                                  5.4

                                                                                                                                 1.8
              0.2%                                                                                                  2013
  2013
              2014         2015         2016          2013         2014          2015        2016                                2014         2015         2016
                                                                                                                   -1.0
-2.8%                                                 ** Assembled Vehicles, CKDs and vehicles under license
* Recurring
   * Recurringoperating
               Operatingincome  relatedtotoRevenue
                         Income related     Revenue   -**Detail in attachment
                                                         Assembled   Vehicles, CKDs and vehicles under license        *** FCF
                                                                                                                 *** FCF       for Sales
                                                                                                                          for Sales      & Manufacturing
                                                                                                                                    & Manufacturing        companies
                                                                                                                                                    companies

 Production cost savings in Europe                            Financial breakeven point                                      Wages to revenue ratio
 €/veh. over 2015 - 2018, including Euro6                          Million Vehicles                                           Automotive division*
                                          700                         2.6                                                                            Bench
                                                                               -1 M Veh
                467                                                                                                    2015            2016          OEM's
                                                                                          1.6
   211          256

                                                                                                                                                     11.0%
   2015       Cum.                      Cum.                         2013                2015                                        11.4%
            2015-2016                 2015-2018
                                                                                                                      12.0%
CREATE A EUROPEAN CHAMPION

 Split of PCD + OV sales per region                                                             Size in home region of top-4 worldwide OEMs 1)

                                                                                                                        3.8
                                                                                                                                               3.6
                                                                                                  3.5
      3.0                                                 Critical size in
                                                          home region

                                                                                                                                                           2.5

                    0.7           0.6

                                                 0.2           0.2

     Home Middle East            China         South          Others                        North America             Europe 30          Japan, Korea &   Europe 30
    region    & Africa                        America                                                                                    South Asia
  (Europe 30)

1) Considered as strategic groups (all brands taken into account); 2) Volumes for all Europe (IHS definition): 4.2 m for VW, 3.2 m for Renault/Nissan
North America: home region considered
Sources: IHS, Roland Berger
TO A GLOBAL MULTI BRAND GROUP

                                6
DCOM
9 November 2017
                  DCOM   Mensuelle Com Dec 2016 / C2
You can also read