Results Presentation Monday, March 23, 2020 - Cell C's Turnaround Strategy takes shape

Page created by Bruce Hale
 
CONTINUE READING
Results Presentation Monday, March 23, 2020 - Cell C's Turnaround Strategy takes shape
Results Presentation
     Monday, March 23, 2020
  For the year ending 31 December 2019
Cell C’s Turnaround Strategy takes shape
Results Presentation Monday, March 23, 2020 - Cell C's Turnaround Strategy takes shape
Agenda

     1     The Cell C Journey

     2     Cell C’s Strategy

     3     Financial Results (for YE 31 December 2019)

     4     Highlights

     5     Balance Sheet

     6     The Way Forward

     7     Questions

2   R e s u l t s   P r e s e n t a t i o n
Results Presentation Monday, March 23, 2020 - Cell C's Turnaround Strategy takes shape
The Cell C Journey

R e s u l t s   P r e s e n t a t i o n
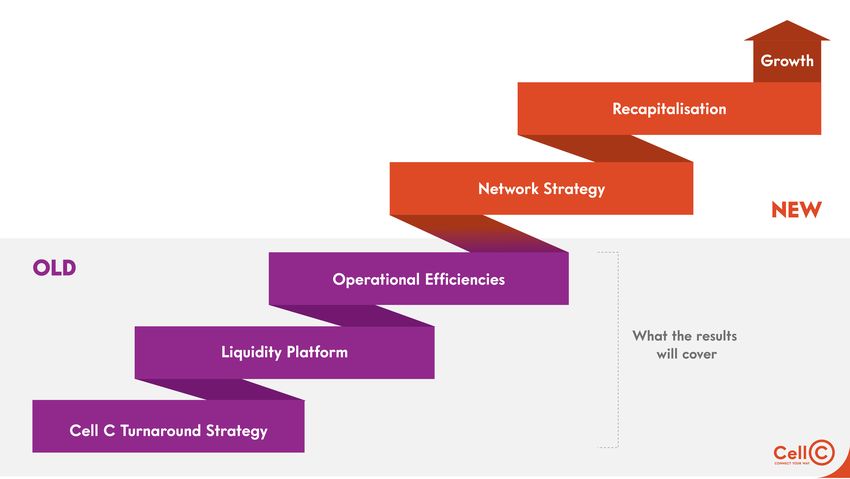
Results Presentation Monday, March 23, 2020 - Cell C's Turnaround Strategy takes shape
The Cell C Journey

                              Focus                  Turnaround strategy                 Improved Performance

          • Operational efficiencies                  Turnaround strategy has               Improved business
          • A new network strategy                delivered improved operational          performance allows for a
          • A new capital structure                 efficiencies with the positive     successful recapitalisation with a
                                                  impact of these changes flowing          sustainable debt stack.
                                                   through in the latter half of the
                                                           reporting period.

3   R e s u l t s   P r e s e n t a t i o n
Results Presentation Monday, March 23, 2020 - Cell C's Turnaround Strategy takes shape
A Step Change
Positioning Cell C for Growth
Results Presentation Monday, March 23, 2020 - Cell C's Turnaround Strategy takes shape
Cell C’s Strategy

R e s u l t s   P r e s e n t a t i o n
Recap of turnaround strategy to focus on sustainable growth

                          1                               2                             3                             4
               Liquidity Focus                   Network strategy          Operational Rationalisation        Recapitalisation

         Liquidity platform is in             Network strategy is an        A cost efficiency             Complex restructure.
         place.                               evolution of the capex        programme.
                                              intensive, infrastructure-                                  Multiple stakeholders.
         Informal debt standstill,            based network.                Review of product portfolio
         current terms on hold                                              & rebalancing traffic.        Structures are being
         while debt is restructured           This is a capex for opex                                    discussed.
         as part of recapitalisation.         substitution.                 Shift to revenue
                                                                            generating activities.        All parties remain vested
                                              Expanded roaming                                            in the process.
                                              agreement with MTN
                                              concluded.

                    Complete                       Complete                        Ongoing                    In Progress

7   R e s u l t s   P r e s e n t a t i o n
Financial Results
                                          For the annual period ended 31 December 2019

R e s u l t s   P r e s e n t a t i o n
Annual highlights for 2019… 1/2
    Key performance indicators

                         -1%                                          -15%                                          2%

               vs 2018 Service Revenue                               vs 2018 EBITDA                     of Revenue Capital Expenditure*

              R14.2 Billion                                      R2.5 Billion                                R0.3 Billion
            Maintained revenue considering               Tough economic conditions resulted in higher   Low capital intensity due to reduced
              decline in subscriber base                    bad debt and delays in implementing the        network capital expenditure
                                                          revised MTN roaming agreement penalised
                                                                     financial performance

    Results excluding the adoption of IFRS 16.
    * - Excluding intangible assets and leased assets.

9   R e s u l t s   P r e s e n t a t i o n
Annual highlights for 2019… 2/2
     Key performance indicators

                          -1%                             H1 vs H2

                                                            4%                    -15%
                                                                                                           H1 vs H2

                                                                                                           136%                   2%
                                                     R273 Million                                       R1 Billion
                vs 2018 Service Revenue                                          vs 2018 EBITDA                       of Revenue Capital Expenditure*

               R14.2 Billion                                                 R2.5 Billion                                  R0.3 Billion
             Maintained revenue considering                          Tough economic conditions resulted in higher     Low capital intensity due to reduced
               decline in subscriber base                               bad debt and delays in implementing the          network capital expenditure
                                                                      revised MTN roaming agreement penalised
                                                                                 financial performance

     Results excluding the adoption of IFRS 16.
     * - Excluding intangible assets and leased assets.

10   R e s u l t s   P r e s e n t a t i o n
1
2019 Results Full year
      Summary of reported financial information

           R’m                                   2019     2018      % change     Notes & Comments
                                                                                 •   In 2019, the net loss after tax includes
          Service revenue                       14 218    14 385          -1%        non-cash impairments to the value of
                                                                                     R 3 283 million.
           Non-Service revenue                     937    1 282           -27%   •   In 2019, net loss after tax without the
                                                                                     non-cash impairment totals a loss of
           Total revenue                        15 155    15 667          -3%        R 697 million.

           Gross margin                          7 412    8 090           -8%
                                                                                     Impact of roaming on EBITDA
                                                                                                      (ZAR mln)
           Gross margin %                         49%      52%            -3%
                                                                                                                    4 899   4 747

           EBITDA                                2 467    2 897           -15%        2 897
                                                                                              2 467

           EBITDA margin %                        16%      18%             -2%
                                                                                      Incl Roamin g               Excl Ro aming
           Net loss after tax                   (3 936)   (7 337)          46%
                                                                                                      2018   2019

Results excluding the adoption of IFRS 16.

11    R e s u l t s   P r e s e n t a t i o n
Impact of IFRS 16 on the financial results
                                                                                                              Notes & Comments

          R’m                                             2019                 2018         % change          •       Increase in EBITDA as operating
                      Impact of IFRS 16 on the income statement                                                       leases are recognized as finance
                                                                                                                      expenses.

                                                                                                              •       Increase in the debt portfolio due to an
                                                                                                                      increase in the lease liability. There is
                                                                                                                      an increase in the right-of-use lease
                                                                                                                      asset which is depreciated over the
                                                                                                                      period of the lease term.
                                    1 526
                                                                                 1 402
                                                                                                                        Impact of IFRS 16 on the Balance
                                                                                                                                     Sheet
                                                  4 423
                                                                                               3 869        8000

                 2 897                                                                                      6000
                                                                  2 467
                                                                                                            4000

                                                                                                            2000

                                                                                                                  0
            2018 EBITDA           IFRS 16      2018 EBITDA     2019 EBITDA      IFRS 16     2019 EBITDA                         2018                   2019
            Excl. IFRS 16        Adjustment    Incl. IFRS 16   Excl. IFRS 16   Adjustment   Incl. IFRS 16
                                                                                                                             Incl. IFRS 16    Excl. IFRS 16

12   R e s u l t s   P r e s e n t a t i o n
H1 vs H2 2019
      Summary of reported financial information
                                                                                                    EBITDA H1 vs H2 2019

          Rand Million                       H1 2019 Excl. IFRS 16   H2 2019 Excl. IFRS 16    %
                                                                                                            H1 2019

          Revenue                                   7 464,8               7 690,6             3%         R734,6m

          Mobile                                    6 972,4               7 246,0             4%

          Prepaid                                   3 468,2               3 536,2             2%

          Direct Expenditure                       (3 927,0)              (3 816,9)           -3%

                                                                                                            H2 2019
          Gross Margin                              3 537,8               3 873,7             9%
                                                                                                       R1 732,3m
          Operating Expenses                      (2 938,6)               (2 415,8)          -18%

          EBITDA                                    734,6                 1 732,3            136%

Results excluding the adoption of IFRS 16.

13    R e s u l t s   P r e s e n t a t i o n
Highlights from H2 2019
     Impact of the turnaround strategy

                                               18%
                                                            EBITDA more     EBIT before

                     9%
                                                            than Doubled    impairments

                Gross Margin
                                               Operating
                                               Expenses
                                                           R1-bil          R705m
                  increase                     decrease    Turnaround

14   R e s u l t s   P r e s e n t a t i o n
Annual revenue story
                      Maintained revenue while right-sizing the customer base

R e s u l t s   P r e s e n t a t i o n
Revenue by subscriber type
                                                                                                                                               6%
           Segment (R’m)                               2019                    2018                  % change                           7%

                                                                                                                                  7%

           Prepaid*                                   7 004                      7 359                          -5%
                                                                                                                                 3%             2019       46%
                                                                                                                                 6%           Subscriber
                                                                                                                                               Revenue
           Contract*                                   3 753                     3 769                           0%

           Broadband*                                    924                       910                           2%                     25%

           Mobile revenue                            11 681                     12 038                          -3%

           Other^                                        482                        394                        22%

           Wholesale                                     981                        875                        12%                            8%
                                                                                                                                       7%
           Incoming                                    1 074                     1 078                           0%               6%
                                                                                                                                 2%            2018        47%
           Net Service revenue                      14 218                      14 385                          -1%              6%           Subscriber
                                                                                                                                               Revenue
           Equipment                                     937                     1 282                        -27%

           Total Revenue                             15 155                     15 667                          -3%                     24%

     * Segments of mobile revenue are net of volume discounts. ^ Other revenue is made up of FTTH, other bulk SMS and content.

16      R e s u l t s   P r e s e n t a t i o n
Unpacking our Subscribers
     Other key performance indicators
                                                                                                                    Notes & Comments

         Thousand                                                                                                   Prepaid base down 21%. Annualised ARPU
                                                    2019                     2018                % change
                                                                                                                    -2%, however ARPU up 7.5% on an annual
                                                                                                                    Dec vs Dec basis. Total cost of acquisition
         A3 prepaid base                            10 886                   13 845                     - 21%       down 43% annually. We are connecting
                                                                                                                    better customers and focusing on profitable
         Contract base*                             1 103                      1 156                        - 5%    subscribers. We are not chasing subscriber
             Postpaid Base                              303                       421                       - 28%
                                                                                                                    growth as a cosmetic indicator.
             Hybrid Base                                800                       735                          9%
                                                                                                                    Contract base -5% with dramatically lower
         Broadband base*                              383                       409                         - 6%    subsidies. ARPU has increased by 9%.

          MVNO^                                      2 035                    1 828                         11%     Broadband -6% with ARPU up 17% with
                                                                                                                    base down 6% as we were more selective in
         Total Subscribers                          14 407                   17 238                     - 16%       deal value.
                                                                                                                    Fibre to the home revenue up 36%. Although
                                                                                                                    off a smaller base it is growing quickly.
          ASPU ‘R                                  2019                       2018               % change
                                                                                                                    Wholesale MVNO base up 11%. We still
            Prepaid                                  50                        49                            2%     managed to grow as we reduced prices that
                                                                                                                    our MVNOs paid and growth was severally
            Contract                                 275                       251                            9%    curtailed as our financial uncertainty slowed
                                                                                                                    down the rollout of new MVNOS. This
            Broadband                                189                       162                           17%    includes the BSP business.

* - Customer base excludes Business Service Provider (BSP) base.   ^ - BSPs have been added to MVNO base.

17     R e s u l t s   P r e s e n t a t i o n
Optimising network traffic to improve profitability

                                    Service Revenue vs Data usage                                                                      Notes & Comments

                                                                                                                                       • Data Traffic reduced during
 Million                                            2019             2018               % change                                         the period.

                                                                                                                                       • H2 service revenue
                                                                                                                                         outperforms H1 with less
                                                                                                                                         data traffic.

                                                                                                                     SERVICE REVENUE
       DATA GB

                 Jan-19   Feb-19 Mar-19 Apr-19 May-19 Jun-19        Jul-19   Aug-19 Sep-19   Oct-19 Nov-1 9 Dec-19

                                                      Data (GB)   Service Revenue

 •   ^ Data in GPRS

18    R e s u l t s       P r e s e n t a t i o n
0
Evolution of the customer base in pursuit
 of profitability
                                                                                                                                              Notes & Comments
                                       Service Revenue vs Total Subscribers                                                                   •   We have been actively
                                                                                                                                                  managing our customers by
                                                                                                                                                  pursuing more profitable
                  Million                                      2019                   2018              % change                                  customers.

                                                                                                                                              •   This has caused a reduction
                                                                                                                                                  in the Cell C customer base.

                                                                                                                            SERVICE REVENUE
     TOTAL SUBSCRIBERS

                                                                                                                                              •   Cell C removed non-profitable
                                                                                                                                                  products and increased its
                                                                                                                                                  focus on retail product pricing.

                                                                                                                                              •   An example of this of this was
                                                                                                                                                  the cancellation of Wholesale
                                                                                                                                                  Fixed LTE services that were
                                                                                                                                                  no longer feasible.

                         Jan -19 Feb-19 Mar-19 Apr-19 May-19 Jun-19          Jul-19   Aug-19 Sep-19 Oct-19 Nov-1 9 Dec-19

                                                         Total Subscribers      Service Revenue

- Customer base excludes FTTH and CST subscriber bases.

19   R e s u l t s             P r e s e n t a t i o n
Robust Wholesale Model

                                   Service Revenue vs Data usage                                                                       Notes & Comments
                               Wholesale Revenue vs Wholesale Subscribers                                                              Wholesale revenue contributes 7% of the
                                                                                                                                       total service revenue.
                         Million                              2019             2018              % change
                                                                                                                                       The value proposition proposed by new
                                                                                                                                       MVNOs creating new demand for
                                                                                                                                       subscribers.

                                                                                                               WHOLESALE SUBSCRIBERS
     WHOLESALE REVENUE

                         Jan-19 Feb-19 Mar-19 Apr-19 May-19 Jun-19 Jul-19 Aug-19 Sep-19 Oct-19 Nov-19 Dec-19

                                                   Wh olesale Subscribers   Wh olesale Revenue

20         R e s u l t s           P r e s e n t a t i o n
Operational expenditure story
                                          Operating expenses was 18% lower when comparing
                                          H1 vs H2, right sizing the operator for future growth.

R e s u l t s   P r e s e n t a t i o n
Operational expenditure
                                                                                                                                                                        2%
                                                                                                                                                                              12%

         R’m                              H1 2019 Excl. IFRS 16                 H2 2019 Excl. IFRS 16                H1 vs H2 %                           28%

     Direct expenditure                             (3 927.0)                          (3 816.9)                              3%
                                                                                                                                                                       2019
                                                                                                                                                                       Direct           29%
                                                                                                                                                                     Expenditure
         Network Expenses                                                                                                                              2%
                                                   (1 037.0)                           (1 031.0)                              1%
                                                                                                                                                          8%
         Commercial Expenses                          (644.5)                             (412.5)                            36%                                3%
                                                                                                                                                                              2% 0%
                                                                                                                                                                        14%
         Administrative Expenses                   (1 256.9)                              (972.3)                            23%

         Depreciation, Amortisation                   (767.5)                          (4 268.1)                            >100%
         & Impairment
                                                                                                                                      Termination Costs                        Roaming Costs
                                                                                                                                      Purchase of Retail Content               Other Mobile Services Costs
                                                                                                                                      On-Going Commissions and Discounts       Prepaid S AC and S RC *
                                                                                                                                      Bad Debts                                Other
           R’m                                              2019                         2018                                         Handset and Sims                         Wholesale Cost

         Capital expenditure                                 273                         2 112
                                                                                                                                    Depreciation, amortisation and impairments
                                                                                                                                    An annual impairment assessment of fixed and intangible assets was
                                                                                                                                    concluded which resulted in an impairment of R3.2 billion. In
                                                                                                                                    accordance with IFRS, we could not consider the benefits from the
     Capital expenditure                                                                                                            recapitalization and the extended roaming agreement.
     •    Capital expenditure is lower than 2019 due to the prioritisation of the turnaround strategy.
     •    Furthermore, the expansionary capex ceased due to the current liquidity pressures.

22   R e s u l t s    P r e s e n t a t i o n                                  Results excluding the adoption of IFRS 16.
Balance sheet story

R e s u l t s   P r e s e n t a t i o n
Balance sheet
                                                                                Notes & Comments

          R’m                                     2019      2018    % change    Trade receivable have decreased due to
                                                                                early settlements by customers to support
                                                                                the liquidity platform.
         Network Assets                          5 096     8 401         -39%
                                                                                Other liabilities and provisions decreased
         Intangible assets                         951     1 113         -14%   due to the cost and network optimization
                                                                                which focused on incurring costs for
         Trade receivables and other assets      2 822     4 620         -39%
                                                                                profitable growth.
         Total assets                            8 869    14 134         -37%

         Loans and borrowings                    8 706     8 970          -3%

         Other liabilities and provisions        6 187     7 264         -15%

         Lease obligations                       1 824     1 768          3%

         Total Liabilities                      16 717    18 002          -7%

         Net equity                             (7 848)   (3 868)      >-100%

Results excluding the adoption of IFRS 16.

24    R e s u l t s   P r e s e n t a t i o n
Analysis of debt and finance cost
                                                                                                                             Notes & Comments
                 Description                                Debt                   Interest                  F-X

                                                   2019      |     2018     2019       |      2018    2019   |     2018
                                                                                                                             Cost of funding remains
      Long term debt                                 -               -        -                -        -            -       excessively high.
      Short term debt*                             8 706           8 970     905              819     -209          405
                                                                                                                             Debt has not increased in 2019.
                                                   8 706            8970
                                                                                                                             Instead, a decline through
      Finance leases                               1 824           1 768     267              256      -             -       settlement of short-term debt.

      Other finance costs                            -               -      412                275    28             280     Handset financing liability
      - Other finance costs                          -               -      185                93      -              -
                                                                                                                             decreasing due to not acquiring
                                                                                                                             customer at any cost.
      - Discounting future cash flows                -               -       53                92      -              -

      - Working capital                              -               -       -                 -      28            280
      - Derivatives                                  -               -       -                 -       -             -
      - Other interest                               -               -       174               90      -                 -

      Cash / interest income                        -262           -493      -33               -61     -              -

      Net debt excl. leases (net of cash)          8 444           8 477    1 284             1 033   -233           685
      Net debt incl. leases (net of cash)          10 268          10 245   1 551             1 289   -181           685

      Handset finance (off balance sheet)          1 749           1 825    254                189     -              -

Results excluding the adoption of IFRS 16.

25    R e s u l t s      P r e s e n t a t i o n
Breakdown of long- and short-term debt
                                                                                                        Notes & Comments
                                                                                   2019    |   2018

                                Description                                        Principal Debt       R264m reduction of financial
                                                                                                        debt.

                      Listed Bonds                                                 2 705        2 666
                                                                                                        In a foreign currency static
                                                                                                        situation the total Pro-forma
                      CDB                                                          1 940        1 935
                                                                                                        financial debt reduced by
                      ICBC                                      Unchanged in ZAR   1 105        1 046   R352m in the comparative
                                                                                                        period.*
                      Nedbank                                   Unchanged in ZAR    847          797
                                                                                                        Debt reduction in trying times.
                      DBSA                                      Unchanged in ZAR    230          190

                      RMB/ABSA                                  Unchanged in ZAR   1 081        1 400

                      Capitalised Finance Costs                                     -11          -36

                      ZTE Bridge Vendor                                             151          107

                      Subsidy                                        Reduced        686          865

                                                                      Total        8 706        8 970

* - At a USD/ZAR closing exchange rate of R14.39 as at 31 December 2018.

26    R e s u l t s    P r e s e n t a t i o n
The Way Forward

R e s u l t s   P r e s e n t a t i o n
A Step Change
Positioning Cell C for Growth
Looking forward

                                                                                                          Prepare
                      Operational                                       Network                         Cell C for a
                      efficiencies                                      Strategy                      recapitalisation

     •   Operationally sound business

     •   Financially viable and competitive

     •   Business performance allows for a successful recapitalisation and sustainable debt profile

     •   Continue to be a customer champion offering innovative products and services

29   R e s u l t s   P r e s e n t a t i o n
Questions?

R e s u l t s   P r e s e n t a t i o n
You can also read