BRIEFING BY TRANSNET TO THE SELECT COMMITTEE ON THE IMPACT OF THE COVID-19 PANDEMIC ON THE FRIEGHT & PORT BUSINESS OPERATIONS DATE: 14 OCTOBER ...
←
→
Page content transcription
If your browser does not render page correctly, please read the page content below
BRIEFING BY TRANSNET TO THE SELECT COMMITTEE ON THE IMPACT OF THE
    COVID-19 PANDEMIC ON THE FRIEGHT & PORT BUSINESS OPERATIONS

    PRESENTATION BY: TRANSNET SOC LTD
    VENUE: TBC
    DATE: 14 OCTOBER 2020
1
CONTENTS

1. EXECUTIVE SUMMARY ON IMPACT OF COVID19 ON OPERATIONS

2. TRANSNET FRIEGHT RAIL – MS SIZAKELE MZIMELA

3. TRANSNET PORT TERMINALS – MR VELILE DUBE
YTD AUGUST 2020 PERFORMANCE
    EXECUTIVE SUMMARY INCLUDING COVID IMPACT
INTRODUCTION                                                                      REVENUE
                                                                                  •  The Container terminals have been able to operate at close to normal operating conditions
•   The performance to August 2020 was significantly impacted by the                 with volumes improving as lockdown restrictions are released.
                                                                                  •  The Auto sector recommenced manufacturing on 2 May 2020 (at 50% production) and
    depressed economic climate as well as the Covid-19 pandemic which led to         processing of Auto exports recommenced
    the imposition of a national lockdown                                         •  Petroleum volumes (Durban – Johannesburg pipeline) heavily impacted due to shutdown of
                                                                                     airports and general lockdown
•   The South African economy contracted by an annualised rate of 2% for          •  Revenue % of plan (Pre-Covid)
                                                                                        •    April at 60% , May at 75% , June at 83% , July at 84% ; August 101%
    the first quarter of 2020 and is expected to contract by 9,5% in 2020         •  Export Iron Ore, Export Coal and Export Manganese contribute 65% of the TFR revenue and
    year                                                                             are expected to catch-up to approximately 90% of FY2021 plan.
                                                                                  •  TPL and TNPA are regulated so the impact on current year will be recovered, over time
•   Low customer demand due to the impact of Covid-19 has resulted in YTD            through future tariff determinations to be issued by the Regulators.
    volumes for all key rail, port and pipeline commodities being significantly
                                                                                  OPERATING EXPENSES
    lower compared to the previous financial year and current budget              •  The lower level of operations has resulted in lower variable and overhead costs.
                                                                                  •  We are pursuing a number of cost containment initiatives to mitigate the impact on FY2021
•   Accordingly, Financial performance for the period to August 2020 shows a         EBITDA.
    significant decline from the corresponding period in the previous financial   •  A project to review Procurement practices is underway and is expected to achieve ~20%
                                                                                     saving over next FY
    year and current budget.                                                      •  Aggressive management of working capital to reduce the cash impact and to avoid an
                                                                                     increase in the overall funding requirement.
•   Although YTD revenue is less than budget there has been steady month on       •  We are making good progress on a number of commercial issues which, if resolved, will
    month improvement with the easing of lockdown restrictions                       release unplanned cash into the system.

•   Whilst there have been slight savings in net operating expenses these have    CAPITAL EXPENDITURE
                                                                                  Due to the impact of the lockdown restriction on project execution we expect the FY2021 capital
    been offset by the impact of unbudgeted Covid-19 expenses                     expenditure to be 26% less than planned, without any impact on maintenance capital.
•   Capital investment (including intangibles) has been underspent mainly due     •   We continue to assess the commercial rationale for continuing with projects in execution and
                                                                                      in this regard it is essential that on-going financial, commercial viability and benefits
    to construction
         3
                    sites being closed as a result of the lockdown.                   realisation assessments are conducted.
                                                                                  •   In this regard, Sector Specific Strategies are being developed that will be used to determine
                                                                                      future capital investments.
TRANSNET FRIEGHT RAIL
PRESENTATION BY: MS. SIZAKELE MZIMELA
DATE: 14 OCTOBER 2020
4TRANSNET FRIEGHT RAIL FOCUS AREAS 5
IMPACT OF COVID19 ON PEOPLE
AS AT 17/08/2020

                 National Lockdown Employees Attendance

  6
IMPACT OF COVID19 – LESSONS LEARNT
Aggressively implemented work from
home protocols where feasible
Each shift signing on and off Proactive management of risk
at different locations in order Pool and Chronic employees
to separate shifts through clinics and panels
Creating the “new normal”
Train drivers were allocated to Implemented A and B Teams with no
the same Train Assistants to overlap to minimize contact between
limit multiple exposure people
7IMPACT OF COVID19 ON RAIL OPERATIONS
Volume HIT rate vs Corporate Plan as at 23 Aug 2020
Level 5 APRIL MAY JUNE JULY AUGUST AUGUST YTD
• Essential Commodities were railed: VOLUMES 10,79 14,01 15,66 15,94 16,24 72,65
• Fuel and Chemicals TOTAL TFR (volume percentage) 62% 79% ↑ 86% ↑ 87% ↑ 112% 84%
• Agriculture (grain, timber)
• Coal – Power generation, energy for hospitals, prisons
BUSINESS UNITS
• Import containers (essential medical supplies, food)
Agriculture & Bulk Liquids 87% 85% ↓ 101% ↑ 85% ↓ 88% 89%
Containers & Automotive 38% 76% ↑ 77% ↑ 55% ↓ 80% 65%
Level 4 COAL 88% 86% ↓ 83% ↓ 90% ↑ 131% 93%
• Non-essential (partially running): Iron Ore & Manganese 49% 77% ↑ 84% ↑ 87% ↑ 95% 78%
• Coal Export Line Mineral Mining & Chrome 38% 80% ↑ 112% ↑ 99% ↓ 172% 93%
• Ore Line (reduced service) Steel & Cement 19% 33% ↑ 69% ↑ 75% ↑ 92% 59%
• Steel and cement (AMSA Coal and Import Coke resumed service)
• Export Coal for MPT/ RBTG (reduced service) BUSINESS LINES
• Chrome (resumed service) EXPORT COAL 86% 81% ↓ 79% ↓ 91% ↑ 131% 91%
• Magnetite (resumed service) EXPORT IRON ORE 58% 79% ↑ 86% ↑ 90% ↑ 95% 81%
GFB 43% 77% ↑ 94% ↑ 82% ↓ 113% 94%
• Level 3
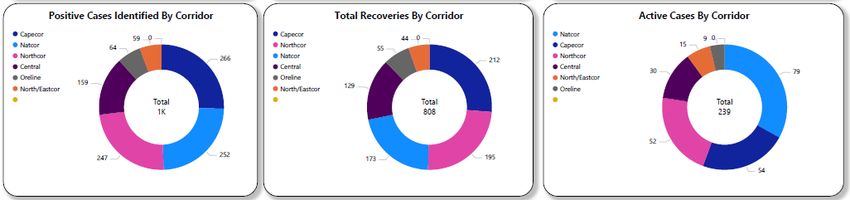
CORRIDORS
• Flows to and from Botswana; Zimbabwe; Maputo; Lesotho and Swaziland
NATCOR 54% 86% ↑ 82% ↓ 58% ↓ 71% 70%
CAPECOR 16% 48% ↑ 77% ↑ 81% ↑ 100% 64%
Level 2
ORELINE 55% 80% ↑ 86% ↑ 88% ↑ 95% 81%
• Limestone for water purification, power generation and Steel Plants; Soda
Ash and Salt, Rock phosphate to RBQ CENTRAL 24% 40% ↑ 64% ↑ 63% ↓ 77% 57%
• Relaxation in lockdown from L3 to L2 allowed more customers to resume NORTHEAST 47% 69% ↑ 108% ↑ 93% ↓ 155% 89%
operations and railing. NORTH 85% 88% ↑ 84% ↓ 92% ↑ 137% 95%
• Volumes railed steadily increased to 0.62mt per day target as a result of 0-60% - Red
relaxation of lockdown restrictions. 61%-80% - Black
∆ = Change
↑
Movement from Previous month
8 81% - 100% - Green ↓TRANSNET PORT TERMINALS
PRESENTATION BY: MR VELILE DUBE
DATE: 14 OCTOBER 2020
9PRIVATE AND CONFIDENTIAL
TPT MANAGEMENT OF COVID19
Durban
COVID_19 Statistics at 31 Aug 2020 Berthing delays per month
15 Ngqura
Cape Town
• Recovery Rate = 96,2%
708
16
• 14 active cases in isolation 10
Days
• 2 contacts in quarantine
681
5
14
12 1
Positive Recovered Deceased Deceased Active Quarantined/Isolated
0
(Non-covid) Dec-19 Jan-20 Feb-20 Mar-20 Apr-20 May-20 Jun-20 Jul-20 Aug-20
Cape Town Berthing delays Commentary
1. 96% recovery Rate at TPT
(Daily since end of May 2020)
2. Covid-19 protocols strictly enforced
3. Cape Town was the first port to be affected and was hardest hit by covid-19
4. Focused efforts in CTCT to improve operational efficiencies and reduce vessel waiting
time (Covid protocols observed, supervision, deployment of operators from other
terminals, daily tracking)
5. Berthing delays currently down to zero days)
6. Lessons learned from Cape Town implemented at NCT and DCTYou can also read