Investor Presentation - TSX:HLC HLC.DB HLC.DB.A August 15, 2018 - Holloway Lodging
←
→
Page content transcription
If your browser does not render page correctly, please read the page content below
Investor Presentation
  TSX:HLC HLC.DB HLC.DB.A
        August 15, 2018
Forward-Looking Statements
This corporate presentation contains forward-looking information within the meaning of
applicable securities laws. Forward-looking information may relate to Holloway's future
outlook and anticipated events or results and may include statements regarding Holloway's
future financial position, business strategy, financial results, plans and objectives. In some
cases, forward-looking information can be identified by terms such as "may", "will",
"should", "expect", "plan", "anticipate", "believe", "intend", "estimate", "predict", "potential",
"continue" or other similar expressions concerning matters that are not historical facts.
Forward looking-information is subject to certain factors, including risks and uncertainties,
that could cause actual results to differ materially from what Holloway currently expects
and there can be no assurance that such statements will prove to be accurate. Some of
these risks and uncertainties are described under "Risk Factors" in Holloway's Annual
Information Form ("AIF"), dated March 7, 2018 which is available at www.sedar.com.
Holloway does not intend to update or revise any such forward-looking information should
its assumptions and estimates change.

All information contained in this presentation is as of June 30, 2018 unless otherwise specified.

                                                                                           TSX:HLC | 2
Overview
Overview
33 hotels with 3,764 rooms
26 limited service, 6 full service
1 leased to a third party on a triple net basis
Internal management for all hotels
Development assets
3 free standing single tenant properties
7 land development parcels
Enterprise value of $313mn
$107mn market capitalization1
$206mn of debt outstanding
Annualized dividend of $0.14 per share
1Based on share price on August 7, 2018 TSX:HLC | 4Hotel Portfolio - Locations
Whitehorse, YT (2)
Yellowknife, NT (2)
Fort Nelson, BC
High Level, AB
Fort St. John, BC
Slave Lake, AB (2)
Grande Prairie, AB (4)
Whitecourt, AB (2)
Drayton Valley, AB
St. John’s, NL
Timmins, ON (2) Sydney, NS
Moncton, NB (2)
Thunder Bay, ON (2) Stellarton & New Glasgow, NS (2)
St. John, NB Truro & Windsor, NS (2)
Dartmouth, NS
Ottawa, ON (2)
London, ON
TSX:HLC | 5Hotel Portfolio – Geographic Diversification
Hotel NOI by Region*
11%
8%
5%
25%
1%
32% 6%
12%
*Based on 2018 Forecast TSX:HLC | 6Hotel Portfolio – Brand Diversification
996 Rooms, 27%
769 Rooms, 21%
532 Rooms, 15%
Other 336 Rooms, 9%
329 Rooms, 9%
323 Rooms, 9%
281 Rooms, 8%
99 Rooms, 3%
TSX:HLC | 7Financials
Focused on Cash Flow
                                                 NOI, FFO, & AFFO
                 45

                 40

                 35

                 30
                                                                                 NOI
   MM's in CA$

                 25
                                                                                 FFO
                 20
                                                                                 AFFO
                 15

                 10

                  5

                  0
                            2014           2015            2016   2017   2018*

                      *Twelve months ended June 30, 2018                          TSX:HLC | 9
Focused on a Strong Balance Sheet
Debt ratio improvement due to principal repayments and improved NOI
Lower cost of debt due to refinancings, offset by higher prime rate
Net Debt to NOI Weighted-Average Cost of Debt
8.5x 7.0%
8.0x
7.4x 6.4%
7.5x 6.5%
6.1% 6.1%
6.4x
6.5x 6.0%
6.2x
6.0x
5.6%
5.5%
5.5x 5.5%
4.5x 5.0%
2014 2015 2016 2017 2018* 2014 2015 2016 2017 2018
*Twelve months ended June 30, 2018 TSX:HLC | 10Flexible Capital Structure
Flexible capital structure
44% of debt is convertible debentures with no covenants, maturing in 2020 and beyond
Minimal mortgage maturities over the next 4 years
Total liquidity of $52.9mn*
Three unencumbered properties which could provide additional financing
$60
$57
$60
$52
Mortgage Maturing
$50 Mortgage Amortization
Debentures
$40
MM's of CA$
$30
$20
$9
$10 $5 $3
$0
2018* 2019 2020 2021 2022 Thereafter
*As of June 30, 2018 TSX:HLC | 11Value Creation
Value Creation
Holloway consistently sells assets at prices greater than book value

   Hotel                                  Sale Price    Gain on Sale        %
   Ramada Trenton                          3,950,000        116,000        3%
   Travelodge Etobicoke                   13,000,000       1,646,000      15%
   Holiday Inn Express Myrtle Beach        7,598,000        308,000        6%
   Travelodge Barrie                       8,725,000       2,942,000      52%
   Holiday Inn Oakville                   19,438,000       7,832,000      69%
   Travelodge Belleville                   7,000,000       (144,000)      -2%
   Total                                  59,711,000       12,700,00      29%

                                                                       TSX:HLC | 13
Cap Rates on Hotel Sales
Holloway continues to trade at a discount to the valuations it realizes on
hotel sales
Hotel Date of Sale Cap Rate
Travelodge London South February 2014 1.3%
Travelodge Chatham February 2014 8.9%
Holiday Inn Express Kamloops April 2014 7.6%
Ramada Trenton January 2015 -0.4%
Travelodge Etobicoke February 2015 2.8%
Holiday Inn Express Myrtle Beach December 2015 6.3%
Travelodge Barrie September 2016 6.9%
Holiday Inn Oakville January 2017 7.2%
Travelodge Belleville March 2017 4.6%
Weighted-average cap rate1 5.5%
1Cap rates calculated using the last twelve months of operating results prior to the sale. TSX:HLC | 14Returning Capital to Shareholders
Three prongs: debt repayment, dividend and share repurchases
Mandatory principal amortization of ~$4.4mn per year
Represents ~$0.25 per share of value or 4.1%1
Annual dividend of $0.14
Represents a yield of 2.4%1
Repurchase shares opportunistically
$2.5mn repurchased in 2013 (average price of $3.56)
$0.9mn repurchased in 2014 (average price of $4.15)
$1.7mn repurchased in 2015 (average price of $4.94)
$0.7mn repurchased in 2016 (average price of $4.58)
$2.9mn repurchased in 2017 (average price of $5.57)
$3.0mn repurchased in 2018 (average price of $5.98)
1Based on share price on August 7, 2018 TSX:HLC | 15Strategy
Strategy
Actively manage hotel operations to maximize profitability
Acquire additional properties
Accretive to Holloway
Newer build select service or value add opportunities
Sell assets at attractive valuations
Capitalize on internal development opportunities
Reposition select assets to their highest and best use
Develop excess land within existing portfolio
Return capital to shareholders through dividends, share repurchases and debt
repayment
Establish Holloway Lodging Management Services as a national level
management contract entity
TSX:HLC | 17Holloway Lodging Management Services
Comprehensive suite of services
Our turnkey services include sales and revenue management, strategic planning and budgeting,
accounting and cost management, human resources, insurance and property taxes, purchasing, and
maintenance and capital management.
Simple and transparent fee structure
We offer a fee structure that includes both a revenue-based and a performance-based fee, so we
measure success by maximizing revenue and profit.
Flexible contract terms
Terms starting from 12 months, with straightforward termination clauses, allowing you to choose an
arrangement that best fits your needs.
www.hlcorpmanagement.ca
TSX:HLC | 18Summary of Investment Opportunities
Undervalued hotel company with presence across Canada
Cash flow growth through hotel upgrades, acquisitions and return of Western
Canadian economy
Upside potential associated with redevelopment opportunities
Focused on returning capital to shareholders
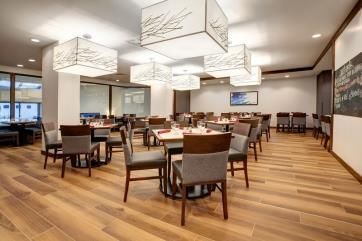
Holiday Inn®, Ottawa, ON DoubleTree® by Hilton, London, ON
TSX:HLC | 19Share Structure
Holloway Lodging Corporation (TSX:HLC)
Shares Outstanding1 17,873,653
Management/Board Ownership2 43%
Institutional Ownership3 72%
Share Price1 $5.97
52-Week Trading Range $5.25-6.10
Market Capitalization $107mn
Enterprise Value $313mn
1Shares outstanding and Share price as of August 7, 2018
2Includes shares owned and controlled by Clarke Inc. which has one representative on the Board TSX:HLC | 20
3Includes shares owned and controlled by Clarke Inc.Contact Us
Holloway Lodging Corporation
6009 Quinpool Road
10th Floor
Halifax, Nova Scotia
B3K 5J7
Telephone: 902-404-3499
Fax: 902-423-4001
Email: investorrelations@hlcorp.ca
Michael Rapps, Chairman, at (416) 855-1925
Jane Rafuse, CFO, at (902) 443-5101
www.hlcorp.ca
TSX: HLC, HLC.DB, HLC.DB.A
TSX:HLC | 21You can also read