IR PRESENTATION Richard Neuwirth, CFO - June 2021 - seat11a
←
→
Page content transcription
If your browser does not render page correctly, please read the page content below
IR PRESENTATION

Richard Neuwirth, CFO

June 2021

S&T AT A GLANCE
01 S&T PROVIDES GLOBAL IOT 4.0 TECHNOLOGY 03 S&T IN FIGURES
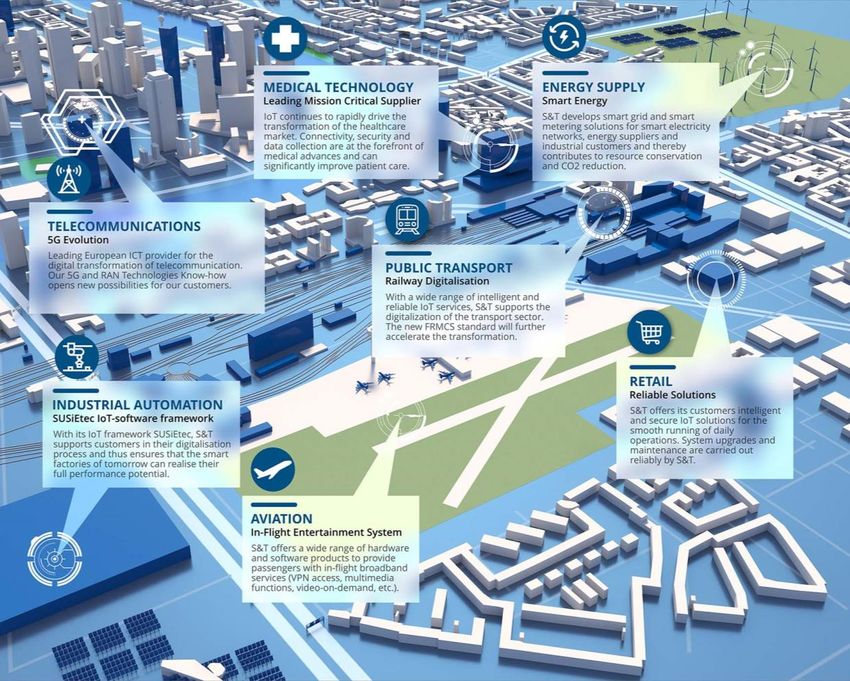
> IoT solutions for Industrial, Medical, Transportation and Communication > FY 2020: EUR 1,255 Mio. revenue and EUR 130.0 Mio. EBITDA
> IoT grows fast: The whole Industry 4.0 market is expected to grow at a > FY 2020: EUR 140.8 Mio. record cash flow
CAGR of ~15% by 2022* > 6,078 employees in 33 countries (as of March 31st, 2020)
02 S&T IS AN IT SERVICE PROVIDER WITH REGIONAL FOCUS 04 MEMBER OF THE TECDAX® & SDAX®
> Germany, Austria, Switzerland (DACH) > Headquarter in Linz, Austria, listed in Frankfurt, Germany
> Eastern Europe > ~ EUR 1,373 Mio. market cap as of March 31st, 2021
* Revenues in % of S&T Group total revenues based on location of revenue generating S&T subsidiary 2
** Source: IMS Report, ABI Research, Oracle, Markets and Markets Analysis
S&T BUSINESS MODEL TRANSFORMATION

                        REVENUES PER PRODUCT                                                             GROSS AND EBITDA MARGIN TREND

  (in EUR Mio.)                                                                      60,0%

   800,0
                                                                                     50,0%                                                  IoTaaS/SLAs
   700,0
   600,0                                                                             40,0%                               IoT Products

   500,0
   400,0
                                                                                     30,0%               IT Services

   300,0
                                                                                     20,0% IT Products
   200,0
   100,0                                                                             10,0%
       0,0
              2008    2010         2012      2014     2016       2018         2020    0,0%
                                                                                             2008 2010 2012 2014 2016 2018 2020 2022 2024 2026 2028 2030
                     IT Products      IT Services   IOT      as of IoT SLAs
                                                                                                                       GM %      EBITDA %

In 2011 S&T was an IT Service company, today IoT products account for 71% of EBITDA – by 2030 IoT business > 90%
                                                                                                                                                           3
THE MARKETS FOR S&T

                      In Billions                             2020       2025           Growth / yr
                      IoT devices (in pcs.)                    20.4          75                + 31 %
                      as of 5G devices (in pcs.)                             32
                      IoT market (in USD)                    1,800      3,000                        11%
                      TAM Industrial IoT (in USD)                  25        48                      14%

                      Main competitors in           Revenue             Machines
                                                    (in USD Bn.)        connected to the Internet
                      Industrial IoT                                    (IN MIO.)

                      Advantech                            1.8
                      S&T                                  1.7                                  75

                      Curtiss Wright                       1.2
                                                                                    20,4
                                                                             6,4
                      ABB B&R                              1.1
                                                                           2016     2020       2025
                      Beckhoff                             1.0
                                                                                             31%
                      Top 5 account for                   27%                              Growth/Year

                                                                                           Source IDC, mgmt est.
                                                                                                           4
S&T BUSINESS MODEL

                    IT SERVICES                                                          IOT SOLUTIONS EUROPE                                          IOT SOLUTIONS AMERICA

         SERVICES EE                  SERVICES DACH         INDUSTRIAL   IOT SW    ODM      TRANSPORT   TELECOM   ENERGY      MEDICAL      IOT ASIA          IOT NORTH AMERICA

     REVENUE FC 2021: EUR 570 Mio.                          REVENUE FC 2021: EUR 850 Mio.                                                             REVENUE FC 2021: EUR 150 Mio.
                               MID-TERM TARGETS                                                                            MID-TERM TARGETS                           MID-TERM TARGETS
                               › EBITDA** > 7%                                                                             › EBITDA** > 14%                           › EBITDA** > 14%
                               › GM > 30%                                                                                  › GM > 40%                                 › GM > 40%
                               › Growth p.a.: 6%                                                                           › Growth p.a.: 12%                         › Growth p.a.: 12%

    S&T started 2011 as an IT Service company, today 75% of profits are derived from IIoT.
*    * incl. I/C revenues ; ** before HQ-fee distribution                                                                                                                                  5
SHORT AND MIDTERM GOALS | VISION 2030

  GUIDANCE 2021                                             AGENDA 2023
  Revenue:     minimum EUR 1,400 Mio.                       5 years plan          2018       2023p        Growth
  EBITDA:      minimum EUR 140 Mio.                         Revenue        990 Mio.      2,000 Mio.       +102%
  EPS:         minimum 1 Euro                               EBITDA         90.5 Mio.       220 Mio        +143%
                                                            EPS             70 cent       175 cent        +150%

                                                VISION 2030

                                   SMART         Transformation to          M&A
             Digitalization     Technologies     50% GM, 15% EBITDA        Strategy            Brand Awareness
                   .                    .                 .                   .                       .

  Based on current forecasts and order backlog we confirm all short, mid and long-term plans
                                                                                                                   6
WHY INVEST IN S&T?
SUCCESSFUL STRATEGY OF STRONG BACKBONE
SUSTAINED LONG-TERM GROWTH
› Financially strong position: Liquidity of EUR 282 Mio. with free
› Meeting/exceeding annual forecasts since relaunch in 2011 cash flow of EUR 107 Mio. by end 2020
› Continuous Gross Margin & EBITDA margins improvements › High diversification in different markets and regions
› Sustainable and resilient business model: Portfolio addressing › No customer dependencies
future trends in Industrialization/Digitalization
TECHNOLOGY LEADERSHIP ATTRACTIVE VALUATION
› Transformation into leading IoT player ongoing › Share price currently at ~ EUR 20 per share
› Increasing Software product portfolio › Consensus target price at EUR 30 per share
› Solutions addressing IoT trends for secure connectivity and › S&T valued at ~ 9 times EBITDA FY 2021
machine learning (AI), 5G IoT WAN Networks and many more
7DISCLAIMER This document includes 'forward-looking statements'. Forward-looking statements are all statements, which do not describe facts of the past, but containing the words "believe", "estimate", "expect", "anticipate", "assume", "plan", "intend", "could", and words of similar meaning. These forward-looking statements are subject to inherent risks and uncertainties since they relate to future events and are based on current assumptions and estimates of S&T AG, which might not occur at all or occur not as assumed. They therefore do not constitute a guarantee for the occurrence of future results or performances of S&T AG. The actual financial position and the actual results of S&T AG, as well as the overall economic development and the regulatory environment may differ materially from the expectations, which are assumed explicitly or implicitly in the forward-looking statements and do not comply to them. Analysts and investors, and any other person or entity that may need to take decisions or prepare or release opinions about the shares / securities issued by S&T AG are cautioned not to place undue reliance on those forward-looking statements, which speak only as of the date of this document. Past performance cannot be relied upon as a guide to future performance. Except as required by applicable law, S&T AG undertakes no obligation to revise these forward-looking statements to reflect events and circumstances after the date of this presentation, including, without limitation, changes in S&T’s business or strategy or to reflect the occurrence of unanticipated events. The financial information and opinions contained in this document are unaudited and are subject to change without notice. This document contains summarized information or information that has not been audited. In this sense, this information is subject to, and must be read in conjunction with, all other publicly available information, including if it is necessary, any fuller disclosure document published by S&T AG. None of the Company, its subsidiaries or affiliates or by any of its officers, directors, employees, advisors, representatives or agents shall be liable whatsoever for any loss however arising, directly or indirectly, from any use of this document its content or otherwise arising in connection with this document. This document or any of the information contained herein do not constitute, form part of or shall be construed as an offer or invitation to purchase, subscribe, sale or exchange, nor a request for an offer of purchase, subscription, sale or exchange of shares / securities of S&T AG, or any advice or recommendation with respect to such shares / securities. This document or a part of it shall not form the basis of or relied upon in connection with any contract or commitment whatsoever. This document does not constitute an offer to purchase securities in the United States, Canada, Australia, South Africa and Japan. Securities, including the bond of S&T AG may not be sold or offered for sale within the United States or to or for the account of / in favor of US citizens (as defined in Regulation S under the U.S. Securities Act of 1933 in the current version (the "Securities Act") unless they are registered under the regulations of the Securities Act or unless they are subject to an exemption from registration. Neither S&T AG nor any other person intend to register the offer or a part thereof in the United States or to make a public offer of the securities in the United States.
S&T AG
Industriezeile 35
A-4021 Linz
www.snt.at
IR Contact:
ir@snt.at
+43 (1) 80191 - 1196
You can also read