USE OF REMOTE SENSING FOR MONITORING WETLAND PARAMETERS RELEVANT TO BIRD CONSERVATION - AURELIE DAVRANCHE
←
→
Page content transcription
If your browser does not render page correctly, please read the page content below
USE OF REMOTE SENSING FOR
MONITORING WETLAND PARAMETERS
 RELEVANT TO BIRD CONSERVATION
               AURELIE DAVRANCHE

                      TOUR DU VALAT
                           ONCFS
      UNIVERSITY OF PROVENCE – AIX-MARSEILLE 1
    UFR « Sciences géographiques et de l’aménagement »
             University - CNRS 6012 E.S.P.A.C.E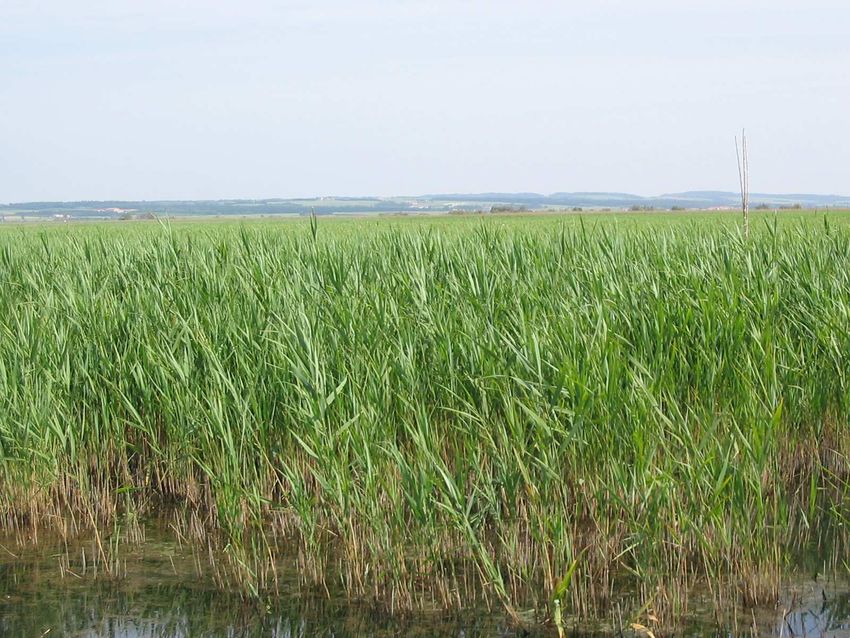
Camargue : Rhône river delta
Dynamic system: water and sediment inputs from the Rhône and the sea

            90 000 ha of natural habitats mostly wetlands
                2/3 on relatively small private estates
                                                                   2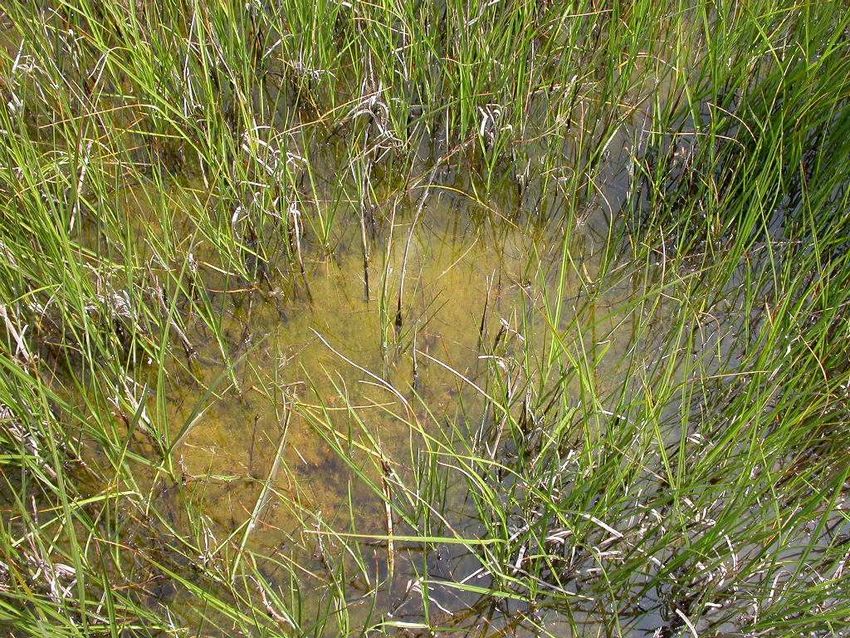
Socio-economic activities and natural habitats

     Rice             Reed                Waterfowl              Cattle
   growing          harvesting             hunting              grazing

                         Water management
                 input of freshwater in brackish marshes
                     modification of the hydroperiod
             division of the marshes into smaller dyked units

     Influence on floristic composition and vegetation biomass

                       Changes in bird habitat

                                                                          3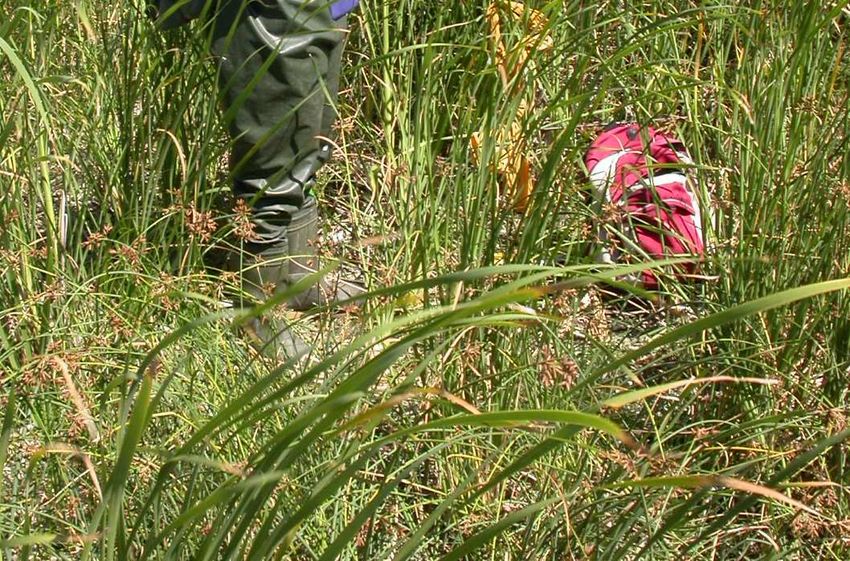
Main objective
  Global loss of     Proliferation of
   biodiversity     invasive species       A fragmented configuration
                                           within a large geographical
                                           area: monitoring based on
        Necessity to monitore              repeated ground measures
         the management and                           difficult
       the health state of these
               marshes
                                                  Remote sensing:
       Reserve managers and                      good potentialities
      stakeholders are in needs                 for wetlands spatial
       of management advices                          analysis

            Development of reliable and replicable remote sensing
                       tools for wetland monitoring

                                                                         4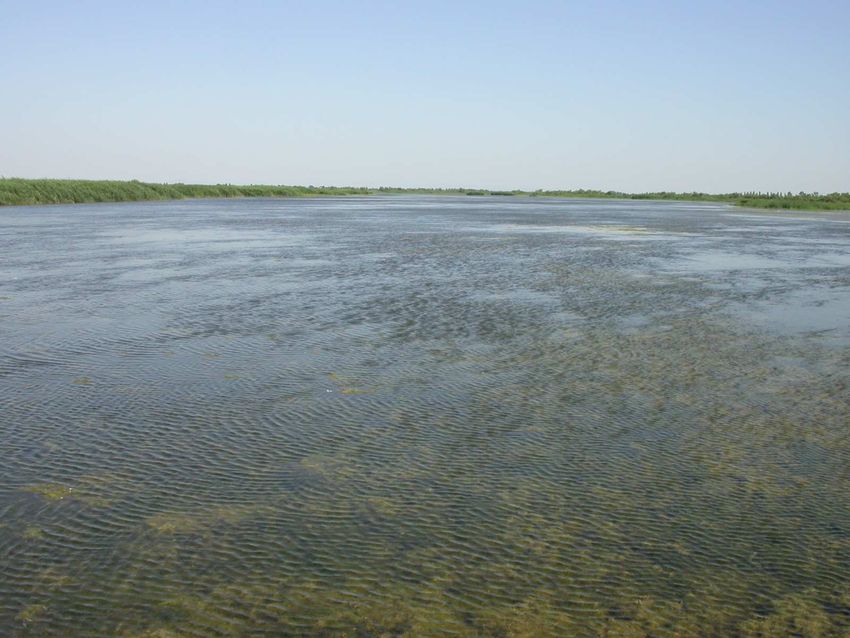
Specific objectives
 These tools will help to :
   ►map the vegetation of Camargue marshes (common reed, club-
   rush, aquatic beds) to follow their spatial evolution over time

   ►map flooded areas irrespective of vegetation density to follow
   their spatial evolution monthly

   ►map vegetation parameters that are associated with ecological
   requirements of vulnerable birds in reed marshes
                                                                     5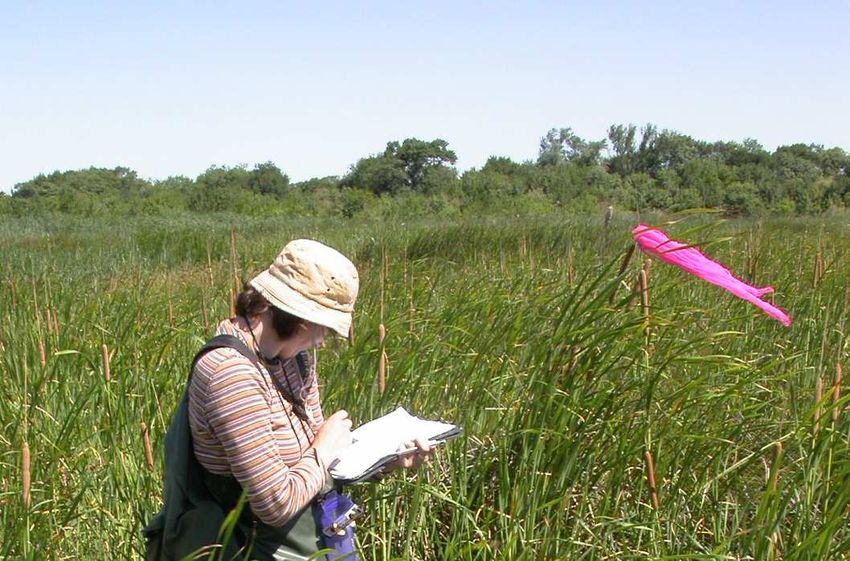
Methodology

     Image                       Sampling
   acquisition

                     GPS        Vegetation       Estimation of
 Image processing            characterisation     water levels
                             (reedbeds, club-      for each
                           rush, aquatic beds)       image
   Data image
   extraction
                                   Database

 Multispectral and
  multitemporal             Statistical modellings:
       index                  Classification trees
                           Generalized Linear Models

                               Formulas = maps
                                                                 6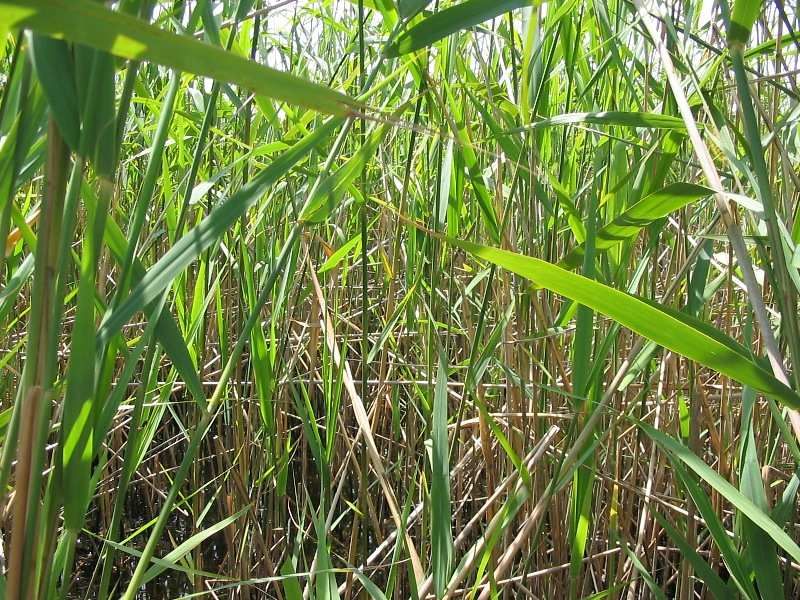
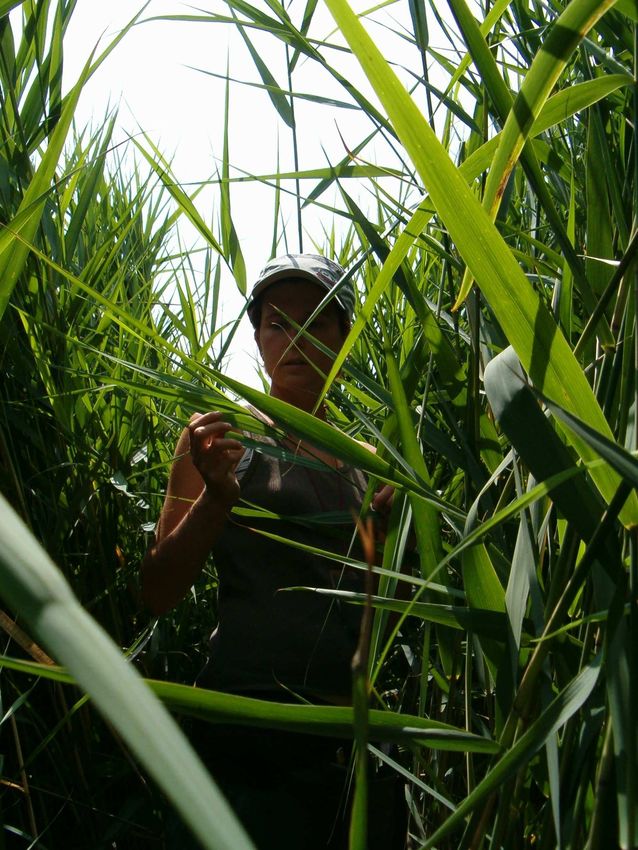
Sampling
Fields campaigns : reedbeds, club-rush, aquatic beds, water levels, GPS

                       Digitalizations : Others
                                                                      7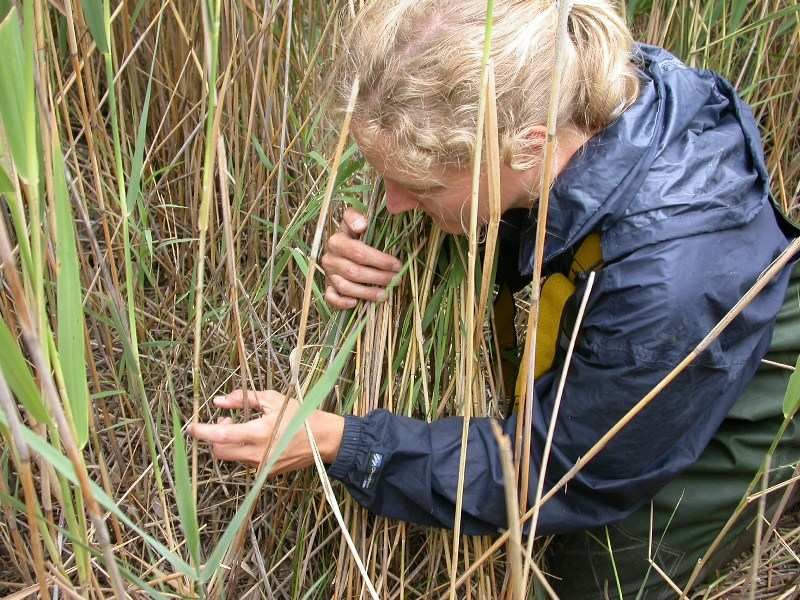
Image processing: radiometric normalization
6S atmospheric model vs. pseudo-invariant features (PIF)
Similarity index (Euclidian distance): Estimation of radiometric variation of PIF
                                                                          Water                              Pine tree
                              16                                                                                                     0.16

                              12                                                                                                     0.12      Each PIF varies at least once
                              8                                                                                                      0.08
                                                                                                                                                      over the year
  Radiometric variation (%)

                              4                                                                                                      0.04

                                  0                                                                                                  0
                                                                           Roof                                Sand
                              16                                                                                                     0.16

                              12                                                                                                     0.12

                              8                                                                                                      0.08
                                                                                                                                            Necessity of different types of PIF
                              4                                                                                                      0.04

                                  0                                                                                                  0
                                      Dec                      Mar       May   Jun   Jul   Sep   Dec   Mar   May   Jun   Jul   Sep
                                                                                                                                               6S does not take into account this
                                                                                                                                                  variation for the correction
                                                                    6
                                        Radiometric variation (%)

                                                                    5

                                                                    4

                                                                    3                                                                         Variation significatively lower
                                                                    2                                                                                     with 6S
                                                                    1

                                                                     0
                                                                                     6S                       PI
                                                                                                                                                                                    8
Spectral variations
               0,3         Reedbeds

                           Club-rush

              0,25         Aquatic beds

                                                                                                                                                        Influence of :
               0,2
                                                                                                                                                        • phenology
Reflectance

              0,15
                                                                                                                                                        • pluviometry
               0,1                                                                                                                                      • water management
              0,05

                0
                                    MIR

                                                         MIR

                                                                               MIR

                                                                                                      MIR

                                                                                                                             MIR

                                                                                                                                                  MIR
                     B1
                          B2
                               B3

                                          B1
                                               B2
                                                    B3

                                                               B1
                                                                    B2
                                                                         B3

                                                                                     B1
                                                                                          B2
                                                                                                B3

                                                                                                            B1
                                                                                                                 B2
                                                                                                                       B3

                                                                                                                                   B1
                                                                                                                                        B2
                                                                                                                                             B3
                          December              March                    May                   June                   July          September

                                     Natural and artificial phenomena characterizing Camargue
                                     wetlands                  require                a          multispectral                           and            multitemporal
                                     imagery for their monitoring

                                                                                                                                                                         9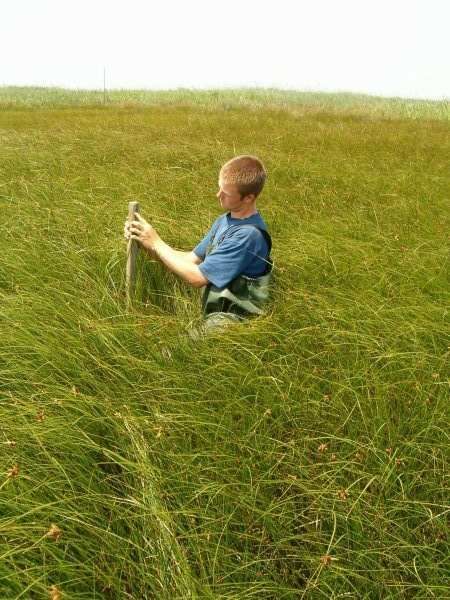
Statistical modelling : two approaches

 1 - Qualitative approach : presence/absence
   • Presence of reed, club-rush and aquatic beds
   • Presence of water in differing conditions of vegetation density
                             Classification trees

 2 - Quantitative approach : prediction of continuous variables
   • Diagnostic parameters of reedbeds
   • Quality for reed harvesting
   • Suitability for vulnerable reed birds species (passerines, Purple
   heron, Eurasian bitterns)
                             Generalized Linear Models

                                                                         10
Classification tree algorithm
Rpart based on the algorithm CART (classification and regression tree)
Breiman et al, 1984; implemented in R.
Method Advantages
Recursive partioning based Hierarchical classification strategy:
on gini index easy interpretation of results
Binary tree Optimal for presence/absence
Cross-validation (k-fold) Small samples and reproducibility
Prior parameter Unbalanced samples
11Recursive partioning
A two-dimension example with two variables selected for reedbeds
classification
0,7
Split at
0,6
0.04897
Split at 0,5
0.2467
0,4
0,3
other
osavi12
aquatic beds
0,2
reedbeds
0,1 club-rush
0
-0,2 -0,15 -0,1 -0,05 0 0,05 0,1 0,15 0,2 0,25
-0,1
-0,2
-0,3
c30603
12Tree: example for reedbeds classification
c30603< 0.04897
2|
672/46
osavi12>=0.2467
1 2
544/0 128/46
ndwif209>=-0.3834
1 2
80/0 48/46
1 2
39/0 9/46
Reedbeds
Formula
Presence of reedbeds = c30603≥0.04897 & OSAVI12Maps resulting from the formula
Combination of three maps: reedbeds, club-rush and
aquatic beds in Camargue
14Tree for flooded areas classification
c4>=0.1436
2|
34/181
ndwif2< -0.5475
1
Scattered 2
29/45 vegetation 5/136
and high
water levels Flooded
areas
dvw>=-0.5092
1 1
21/12 8/33
Dense
vegetation
and lower
1 2
8/22 0/11 water levels
Flooded
areas
Flooded areas = c4 < 0.1436 or (c4 ≥ 0.1436 & NDWIF2 ≥ - 0.5475 et
DWV < -0.5092)
15Classification accuracy and validation
Classification accuracy (%) for the 3 types of marsh vegetation in Camargue:
2005 2006 Acquisition in October
Reedbeds 91,9 92,6 instead of September +
Club-rush 93 extremely small class ?
Aquatic beds 88,3 84,9
Aquatic beds in brackish marshes
mixed with Club-rush + acquisition
in October?
Classification accuracy (%) for flooded areas in 2006:
All Open Vegetated
marshes marshes marshes Best results: first
Flooded half of the year and
76 86 70
areas reed heightGeneralized Linear Models (GLM)
Equation for p descriptives variables: Y=a1x1+a2x2+…+aixi+…apxp+b
Model selection : Coefficient of determination : R²
►R² = 1 → 100 % variance explained
►R² increases with the number of variables
Best model : maximum R² with minimum number of variables
Variable selection : Forward stepwise (FSW)
►Sequence of F-tests (Fischer statistic) : inclusion and exclusion of
« statistically significant » descriptive variables
►End: when no additional variable contribute to increase
significantly the variance explained
Problem : the first variables selected have a big influence on
the resulting model
Pre-selection of descriptive variables necessary
17Variables pre-selection
Criterions for pre-selection : stability
►Spectral response: correlation between two consecutive years
►Mean spectral response : no significant difference between two
consecutive years
20 of the 90 variables are pre-selected !
1 - What is the efficiency of these variables
for modelling reedbed parameters ?
2 - What is the minimum number of images
required for modelling reedbed parameters ?
18Percentage of explained variance
One descriptive
Reedbed Best model =
variable = one Two dates
parameters multidate
date
Height of
44 54 66
stems
Number of dry
- 59 61
reeds
Panicles
- 38 47
number
Number of
- 35 60
green reeds
Ratio dry/green - - 56
Percentage of
- 50 60
open areas
Best predicted parameter: height of stems
19Best models : validation in 2006
Purcentage of explained variance (*p=0.05, **p=0.01, ***p=0.001) :
2005 2006
Height of green
66*** 46***
reeds
Number of dry
61*** 30**
reeds
Panicles number 47*** 19*
Number of green
60*** 1
reeds
Ratio dry/green 56*** 43***
Percentage of
60*** 17*
open areas
Number of panicles: binomial distribution → Rpart?
Green reeds: bi-modal distribution → GAM?
% of open areas: methodological imprecision 20Application for monitoring: reedbeds evolution
Influence of water management, salinity…
21Application for monitoring: reedbeds evolution
Influence of water management, salinity…
22Application for monitoring: Birds habitats
Great Reed-Warbler reedbeds: height of stems >195 cm
23Application for monitoring: flooding duration
Influence of water management on aquatic beds
24Conclusion
► Remote sensing and statistical modelling for wetland
monitoring : sustainability, precision, affordablility
► SPOT 5: multispectral and multitemporal modes optimal for
wetland monitoring on large areas
► Roles reversed : field campaigns as a complementary tool
for wetland monitoring with satellite remote sensing
25Perspectives: improvements
► More descriptive variables : TC wetness, index differences
► Additional field campaigns to monitor reed harvesting
► Monitoring of water levels with the IME
► Number of panicles and green reeds : Rpart? GAM?
► Automatization of the methodology: simplicity for managers
26Perspectives: other applications
► Rice cultivation:
27Perspectives: other applications
► Rice cultivation:
PNRC:
digitalization
of rice fields
28You can also read