Comparison between measurements with passive sampling devices (DGT, POCIS, SBSE) and biota
←
→
Page content transcription
If your browser does not render page correctly, please read the page content below

Louise FOAN
                Jean‐Louis GONZALEZ
                Ifremer Méditerranée (La Seyne‐sur‐Mer)
                "Biogeochemistry and Ecotoxicology" Unit

Comparison between measurements
  with passive sampling devices
   (DGT, POCIS, SBSE) and biota
State of the art and review of available data

   International Passive Sampling Workshop (IPSW)
              Thursday 27th June, 2013
Context
o Water Framework Directive (2000/60/CE)
• 41 priority substances (Annex IX & X):
           ‐ metals: Cd, Hg, Ni, Pb.
           ‐ organic pollutants: PAHs, pesticides…

o Directive on Environmental Quality Standards (2008/105/CE)
• EQS defined in surface waters (coastal, transitional and continental)
for the 41 priority substances of the WFD (Annex I):
Measures on non filtered water except metals: dissolved fraction
(filtration at 0,45 µm or equivalent preliminary treatment)

• Possibility of using integrative matrices for studying long term evolution:
biota, sediments or passive samplers.

                                                                                2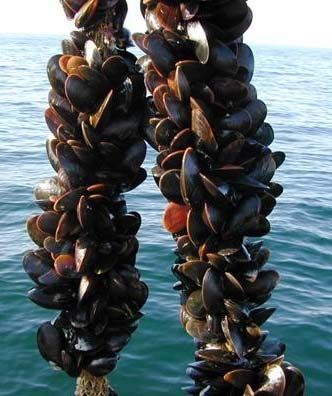
Context
o Active water sampling
   •   Analytical difficulties:
        ‐ sample representativity (spot sampling)
        ‐ sample stability (analyte loss or contamination)
        ‐ sensitivity (insufficient LOQs to attain 1/3 EQS)
   •   Speciation is not studied
                   no information on fate, bioavailability and toxicity

o Biota
   •   Easy sampling procedure
   •   Less analytical difficulties
   •   Information on pollutant bioavailablity

o Passive sampling
   •   Less analytical difficulties
   •   Green chemistry
   •   Information on pollutant speciation

                                                                          3
Biota
o Bioconcentration
                                         Mercury                           PCB
                                  (Csea water = 0,03 µg   L-1)   (Csea water = 0,002 µg L-1)
   Phytoplancton                                -                            4.106
      Plants                                 1.103
    Zooplancton                                 -                          5.106
   Invertebrates                             1.105                         4.106
       Fish                                  1.104                         1.107
       Birds                                    -                          5.107
     Mammals                                    -                          8.107

 Source : Bliefert and Perraud (2008)

o Passive/active biomonitoring
     •    Passive: extensive studies (long‐term, high spatial resolution)
     •    Active: intensive studies with homogeneous populations

o Marine/continental studies
     •    Marine: national programs (RNO & RINBIO in France)
     •    Continental: few studies as more complex systems & various species

                                                                                               4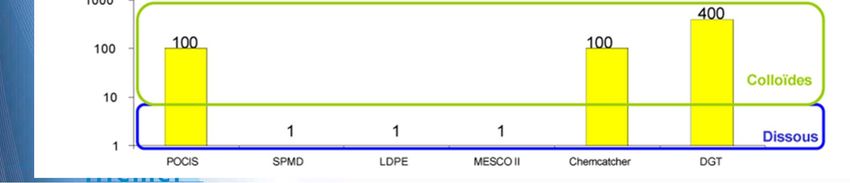
Passive sampling devices
                                           o    Metals
                                           DGT (Diffusive Gradient in Thin film)
                                           o    Organic micropollutants
                                           SPMD (Semi‐Permeable Membrane Device)
                                           LDPE (Low Density PolyEthylene)
                                           MESCO (Membrane‐Enclosed Sorptive COating)
                                           Silicone rod
                                           SBSE (Stir Bar Sorptive Extraction)
                                           POCIS (Polar Organic Chemical Integrative Sampler)
                                           Chemcatcher®

Mazzella et al.
                  log cut-off point (nm)
(2011)                                                                   Suspended matter

                                                                                     Colloids

                                                                                     Dissolved

                                                                                                 5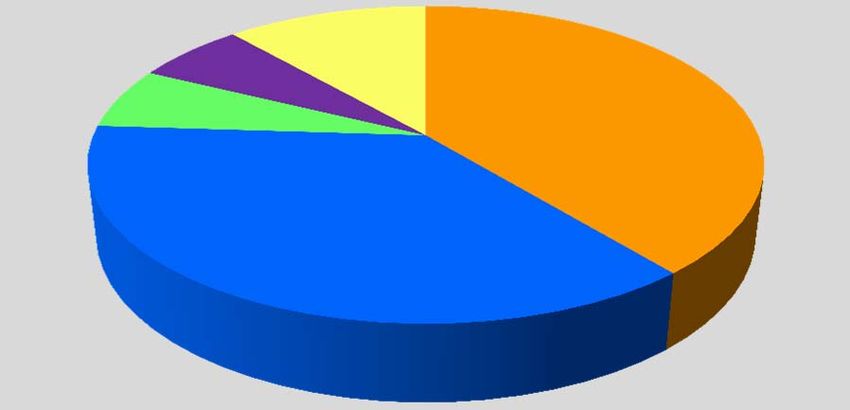
DGT                                  POCIS
         Metals                                 Pesticides
                                                Alkylphenols
                                                Pharmaceuticals
                   Magnetic   PDMS     Glass
          SBSE       bar      phase   envelop
           PAHs
            PCB
      Pesticides

  Can micropollutant bioavailibility be
predicted with passive sampling devices?

                                                                  6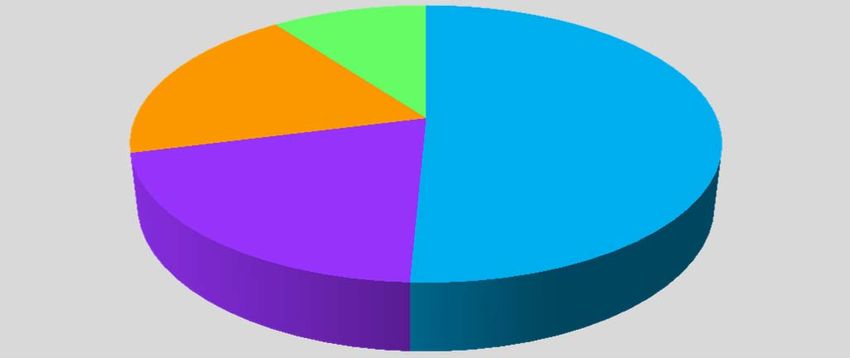
Comparison PS vs biota
                                 64 studies between 1992 and 2012
                                                      Marine                                     River
     Studies in the natural                         sediments        Laboratory studies          water
         environment                                   14%                                        4%
                                                                                                  Sea water
Open sea                         Continental                                                         18%
                                   waters         Continental
  11%                                             sediments
                                    23%
                                                     18%
                                                                                    Artificial
           Coastal
                                                                                  fresh water
           waters                  Transitional                                       32%
            53%                      waters
                                       13%
                                                   Artificial
                                                  sea water
                                                     14%

       Primary           Biota                                  Others   Passive samplers
      producers                                                  13%
         10%                                               POCIS
  Benthic                                                    6%
 organisms                                                                             DGT
                                                         SBSE
    19%                                                                                39%
                                  Bivalves                6%
                                    51%
                  Fish                                                    SPMD
                  20%                                                      37%

                                                                                                         7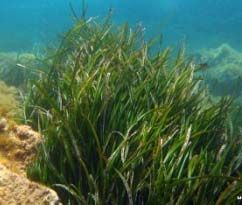
Studies with DGTs
o Metals measured
Most studies: Cu, Cd, Ni, Pb, Zn
Isolated studies: Al, Cr, Co, Fe, Hg, Mn, Sb, Sn
Specific DGTs for monomethylmercury
o “DGT‐labile” fraction
Free ions + mineral complexes + “weak” organic complexes
Significant differences between metals:
Cd : DGT‐labile fraction ~ dissolved fraction (mineral complexes)
Cu : DGT‐labile fraction
DGTs vs biota
                                  Laboratory studies
Metal     Biota                      Correlation between       Source
                                     DGT & biota data
Cu        Trout gills                r = 0,691                 Luider et al. (2004)
          (Oncorhynchus mykiss)      p < 0,0001
Al        Trout gills                r = [0,75‐0,85]           Røyset et al. (2005)
          (Salmo truta L.)           p < 0,05
Cd        Amphipods                  r = 0,968                 Pellet et al. (2009)
          (Gammarus pulex)           p < 0,05
62Ni      Bivalves                   relation log‐log linear   Bourgeault et al. (2012)
          (Dreissena polymorpha)     r = 0,9996
                                     p < 0,001
MM199Hg   Bivalves                   r = 0,94                  Clarisse et al. (2012)
          (Macoma balthica)          p < 0,001

                                                                                          9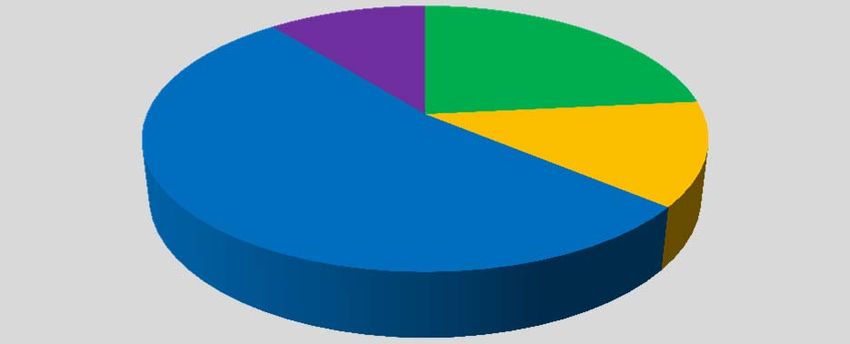
DGTs vs biota
                                               In situ studies
Metal            Biota                          Correlation between     Source
                                                DGT & biota data

Cd, Cr, Pb, Zn   Mosses                         r = [0,61‐0,76]         Diviš et al. (2007)
                 (Fontinalis antipyretica)      p < 0,05

Cu               Bivalves                       r = 0,787               Jordan et al. (2008)
                 (Saccostrea glomerata)         p < 0,001
Cd               Bivalves                        r = 0,790; p < 0,005   Schintu et al. (2008)
Pb               (Mytilus galloprovincialis)    r = 0,728; p < 0,05
Pb               Algae                          r = 0,993               Schintu et al. (2010)
                 (Padina pavonica)              p < 0,05
MMHg             (Macoma arenaria)              r = 0,99                Best et al. (2009)
                                                p < 0,001

                                                                                                10
Environmental parameters
o Influence on metal speciation
pH
Natural Organic Matter (NOM)
Impact on accumulation by DGTs & biota
o Competition with metals
Others cations: Ca…
Impact on bioaccumulation
o Biotic ligand model
Biological membrane = ligand
Integrates speciation models
& competition models
Luider et al. (2004)
11Environmental parameters
Influence of natural organic matter
Cd influx in Gammarus pulex (µg.g‐1.L‐1) in function of dissolved Cd [Cd]w, inorganic Cd [Cd]inorg and DGT‐labile
[Cd]DGT in mineral water (●) and water doped with organic ligands : EDTA at 10 µg.L‐1 ( ); humic acids (∆) at 5
and 10 mg.L‐1 (Pellet et al., 2009).
Better estimation of the bioavailable fraction with DGTs
12Environmental parameters
Influence of natural organic matter
Study with bivalves Dreissena polymorpha (Bourgeault et al., 2012)
Study with mosses Fontinalis antipyretica (Ferreira et al., 2008)
13Physiological parameters
o Main physiological parameters
growth (dry mass, condition index, …)
nutrition (ingestion rates, assimilation efficiency…)
excretion (elimination rate)
o Environmental parameters which affect the biota
temperature
food quality and quantity
hydrodynamism
Ni bioaccumualtion with bivalves Dreissena polymorpha (Bourgeault et al., 2012)
14Biodynamic model
Concentration in the Biovailable concentration
organism (µg/g) in the water (µg/L) Concentration in
food (µg/g)
dCorg
ku.Cw AE.IR.Cf ( ke g ).Corg
dt Growth rate (d‐1)
Sampling rate Assimilation Ingestion rate Elimination rate
(L/g/d) efficiency (%) (g/g/d) (d‐1)
(Casas, 2005; Pan & Wang, 2008; Bourgeault et al., 2011)
Modelisation with DGT data for Cw has given reliable results,
even during studies performed in situ
15Studies in sediments
o Passive sampling in sediments with DGTs
DGTs measure the mobile fraction of metals
Accumulation from interstitial waters
Mobilization of “labile” metals adsorbed to particulate phase
DIFS model gives the dynamic response of sediments
o DGT vs biota
Often correlations between data from the 2 matrices
Function of the metals studied
Important differences between species due to their diet
Mobile fractions vary with sediment types: sand >> clay
DGTs give a better estimation of the bioavailable fraction
except for detritus feeders
16Studies with POCIS
o Micropollutants measured
Alkylphenols
Estrogens
Perfluoroalkylated compounds
o POCIS
Reliable time‐intergrated measures of hydrophilic pollutants
Results correlated with YES (Yeast Estrogen Screen) bioessays
POCIS are a usefull tool for evaluating estrogenic activity
o Biomonitoring
Fish (plasma, bile) & bivalves
No significant correlation with concentrations in water
Metabolization of the compounds
Biota is not reliable for monitoring the compounds studied
17Studies with SBSE
Magnetic PDMS Glass
bar phase envelop
o Micropollutants measured
Polycyclic aromatic hydrocarbons (PAHs)
Polychlorinated biphenyls (PCBs)
Organochlorine pesticides (OCPs)
o SBSE
Main drawbacks:
‐ not time‐integrated
‐ concentrations often < LOQ
Ideal for use in controlled conditions
Few studies in situ
o Biomonitoring
Fish plasma & bivalves
Metabolization of PAHs observed in fish plasma
Bioconcentration factors determined in situ with SBSE data
1819
You can also read