History and Importance of Submerged Aquatic Vegetation (SAV) in Back Bay, VA - Chad Boyce Fisheries Biologist Va. Dept. of Game and Inland ...
←
→
Page content transcription
If your browser does not render page correctly, please read the page content below
History and Importance of
Submerged Aquatic Vegetation
   (SAV) in Back Bay, VA
               Chad Boyce
            Fisheries Biologist
   Va. Dept. of Game and Inland Fisheries
              3909 Airline Blvd.
          Chesapeake, VA 23321
                (757)-465-6812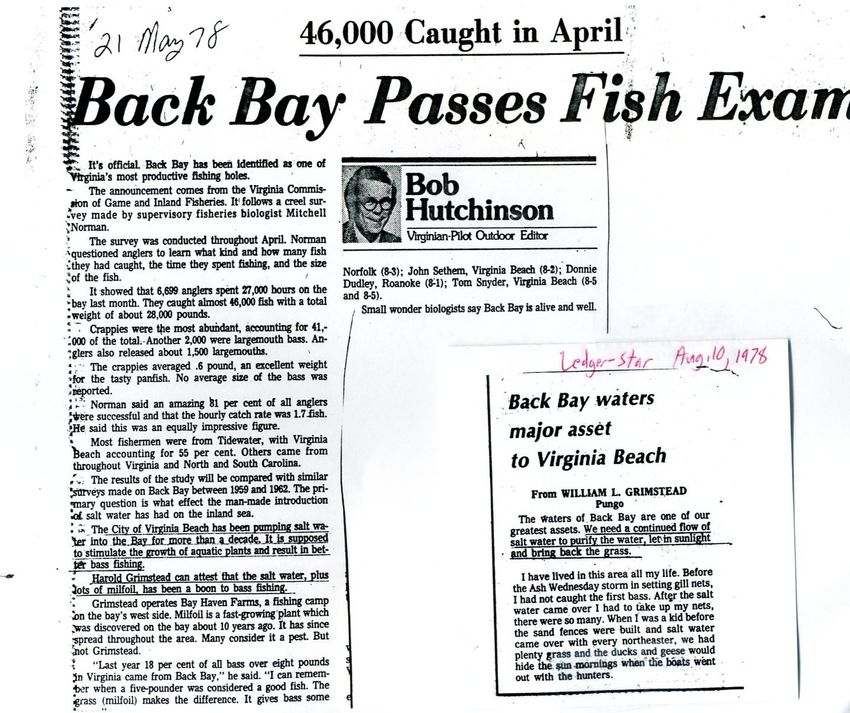
Before we get started...Let’s acknowledge a
few points!
1. Local history and culture is strongly opinionated when it comes to
   everything pertaining to Back Bay!

2. Back Bay has an extremely dynamic history!

3. When it comes to improving Back Bay - especially regarding SAV in
   the bay - my (VDGIF’s) goal is the same as yours!

4. INCREASE SAV COVERAGE THROUGHOUT THE BAY!!

                                   2
Notes on Measuring Salinity

Older reports show salinity as “% Sea Strength (SS)”, modern
         data reported as “parts per thousand (ppt)”

% Sea Strength – Convert to ppt
                 Example = 5% SS (0.05 X 34 = 1.7 ppt
                  5% SS = 1.7 ppt
                 10% SS = 3.4 ppt (.10 x 34 = 3.4)
                 15% SS = 5.1 ppt (.15 X 34 = 5.1)

Freshwater – 0 ppt
Oceanwater – 34 ppt
Current Back Bay average – 1- 2 ppt

                             3
The Past…

    4
Average Salinity in Back Bay 1925-2007
data source, Va Dept. of Environmental Quality
8.00
1933 storm
7.00
6.00
Salinity (ppt)
5.00 1935 storm
Ash Wed storm Saltwater pumping
4.00
Saltwater pumping
drought
3.00
2.00
1.00
0.00
Year
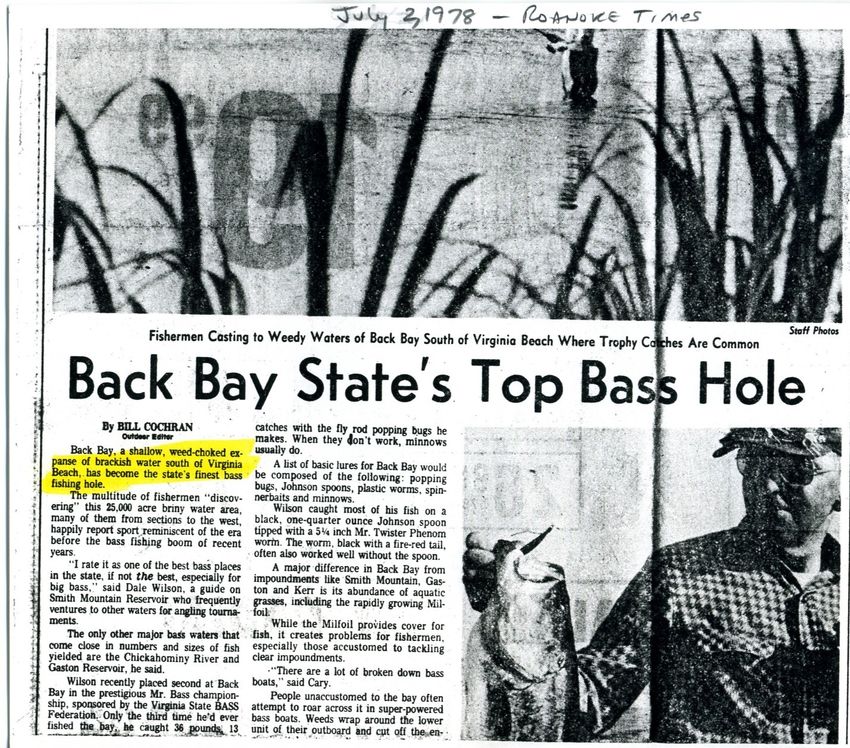
5Early Accounts of Back Bay Water Quality and SAV
Forrest (1853) – “ …was very remarkable for extensive fishing
operations and apparently greatest around the inlet.”
Regarding the closing of Currituck inlet…”with the freshening
of the sound, the saltwater fish disappeared and freshwater
fish took their place.”
Weiland (1897) – Regarding the closing of Currituck Inlet,
“…Further there were such changes in vegetation as brought
countless thousands of ducks of species that had been only
occasional before. The salt water fishes were driven out and
fresh water fishes took their place.”
O’Connor (1929) – When referring to the condition of the bay’s
grasses, “…has been a steady, progressive diminution in the
number of ducks in Back Bay since about 1920…compares
with the decrease of duck food.”
6Bourn (1932) - “Water is extremely turbid and …turbidity
of the waters of Back Bay and Currituck Sound has
probably been a chief factor responsible for the
destruction of the submerged seed plants.”
Coast Guardsman (1939) – “I have seen the grass in the
middle of Back Bay so thick that the yellow shanks walked
on it the same as if they were on land.”
Bourn (1944) “While traveling from Refuge HQ to Ragged
Island in 1944, considerable difficulty was had in clearing
the boat propeller from sago pondweed…”
Chamberlain (1948) – “…waters are very turbid and
turbidity was primary factor limiting aquatic growth.”
78
Unique History of Diverse Habitat and Fisheries
 Salinity Influenced Through Ocean Inlets
  1500’s -1820’s
  Open ocean inlets, Marine and brackish fishes
  (presupposed, i.e. sparse data), little SAV data

  ~1829 – Closing of New Currituck Inlet, almost
  immediate freshening of bay occurred, shift from marine
  to brackish SAV and fishes, improved SAV growths

  1840-1900’s (“before 1924”– Frequent ocean
  overwash, SAV moderate (personal accounts), good
  numbers of fish and waterfowl,

                             9
1920-30’s –Relatively Low SAV abundance, fish and waterfowl decrease, salinity
Maps of Historical Distribution of SAV
                   (Sincock et. al. 1964)

       June 1929                            October 1946

                   1956

                                              October 1947
June 1929
1964- 1968- Post 1962 storm overwash - Explosion of SAV, pumping of seawater - (theorized ocean overwash rejuvenated SAV growth-ducks) 1968-1978 – Highest historical growths of SAV, initial saltwater pumping in 1965 Eurasian Watermilfoil (exotic plant first documented in 1966). *Important to note when referring to historical SAV in the bay, milfoil is an exotic, not documented in the bay before 1966 All other references to SAV prior to 1966 did not include milfoil 1979-1987 Nationally-ranked trophy bass fishery, even though SAV is steadily decreasing. Bass fishery collapsed in 1980’s. Saltwater pumping continued until 1987
When it comes to Salinity and SAV Abundance…1 +
  1≠2
                           Timeline
Post-1933 but Pre-1962 – low salinities (
Additional Notes on Introduction and Establishment of
Eurasian Watermilfoil
1. First documented in 1966
2. Seeds could have over washed during 1962 storm or
saltwater pumping
3. Beginning of bass fishing boom, fragments on boat/trailer
4. Not uncommon behavior of exotic species upon
establishment
- Documented presence, explosion in growth and
distribution
- Rapid colonization by fragmentation and seed dispersal
- Growth explosion followed by gradual or rapid period of
reduction of distribution (disease, nutrient limiting?)
1415
1987- late 1990’s
Bass Fishery collapse, overharvest, lack of
recruitment, poor water quality, low SAV
Written off as “a big mud hole”, bass and waterfowl
       near non-existent

      Classic “Catch 22” - high turbidity and no SAV,
      No SAV because of high turbidity, look at
      exotics = even looked at hydrilla.
Largemouth Bass Citations from Back Bay,
Virginia 1965 - 2016
300
250
200
150
100
50
0
17% SAV Coverage vs Largemouth Bass
Citations from 1965 - 1990
100 300
90
250
80
70
200
60
Number
Percent
% SAV
50 150 # Citations
40
100
30
20
50
10
0 0
Year
18Anecdotal Notes on SAV / Flooding
Anonymous letter in Sincock report (~1920) “…people in this area have
always been bothered occasionally by high water—even twenty-five
(1899) to fifty years ago(1874)—but the water did not do so much
damage because the waters did not stay as high as long.”
Many Back Bay “old timers” refer to the periods of high SAV and bay
water not fluctuating as much during wind events.
Points to SAV density affecting water flow by creating friction.
Likely that higher densities of SAV retards water flow and reduces
amplitude and duration of water flooding events.
More SAV means less wave action - Less waves mean less marsh island
erosion.
Loss of marsh islands allow floodwaters to flow with less resistance. i.e.
wider channels.
19SAV Importance To Back Bay/Currituck Watershed
1. Improves water quality i.e. traps sediment, increases clarity etc.
2. Waterfowl Food source – seeds and plants
3. Essential Fish Habitat
4. Benefits to flood water mitigation, reduce duration of flooding
events.
20Questions?
You can also read