Volumetrics - Do it Right! - Tools
←
→
Page content transcription
If your browser does not render page correctly, please read the page content below
Tools
Volumetrics – Do it Right!
LP360, versions 2014.1 and above
l
Lewis Graham
January 9, 2015
Revision 1.0
We have more and more customers computing volumetrics using LP360 in combination with point cloud
data sets derived from Dense Image Matching (DIM). Note that I will use DIM to mean both the process
of generating a point cloud from a dense set of overlapping images as well as the product point cloud
itself. Thus a DIM is a point cloud derived from a dense image matching process such as Pix4D or
Agisoft’s PhotoScan.
We have discussed the process of performing volumetric analysis in previous versions of GeoCue Group
News (and, before that, in LP360 News). In this article I want to address the criticality of quality
inspecting the DIM and classifying such that features not intended to be included in volumes, aren’t.
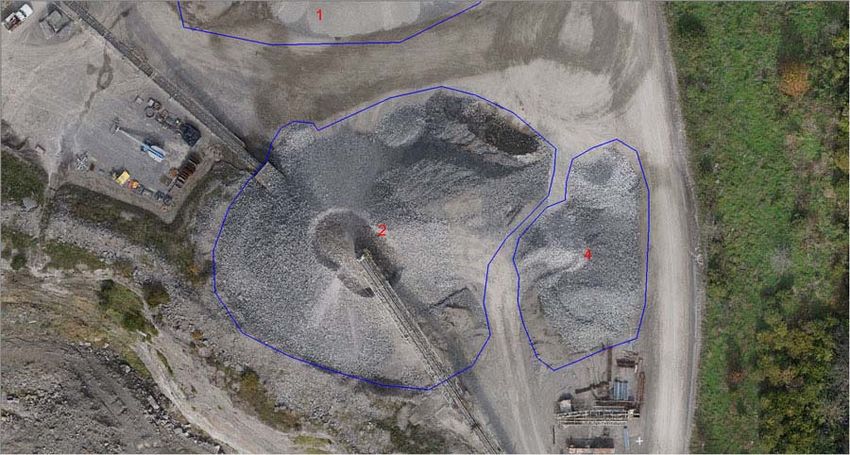
I am going to use a gravel stockpile that we recently acquired as part of a quarry mapping mission. This
stockpile is shown in Figure 1 (the pile labeled as “2”). Note that there are several items above this
stockpile that prevent us from simply using the “Volume from Digitized Polygon” point cloud task in
LP360 with no preparation work.
Figure 1: The Stockpile of interest
LP360 Basic Edition ArcGIS QCoherent Software LLC
LP360 Standard Edition Windows www.LP360.com
Page 1 of 8
LP360 sUAS Edition GeoCue 256‐461‐8289 (phone)
LP360 Advanced Edition 256‐461‐8249 (fax)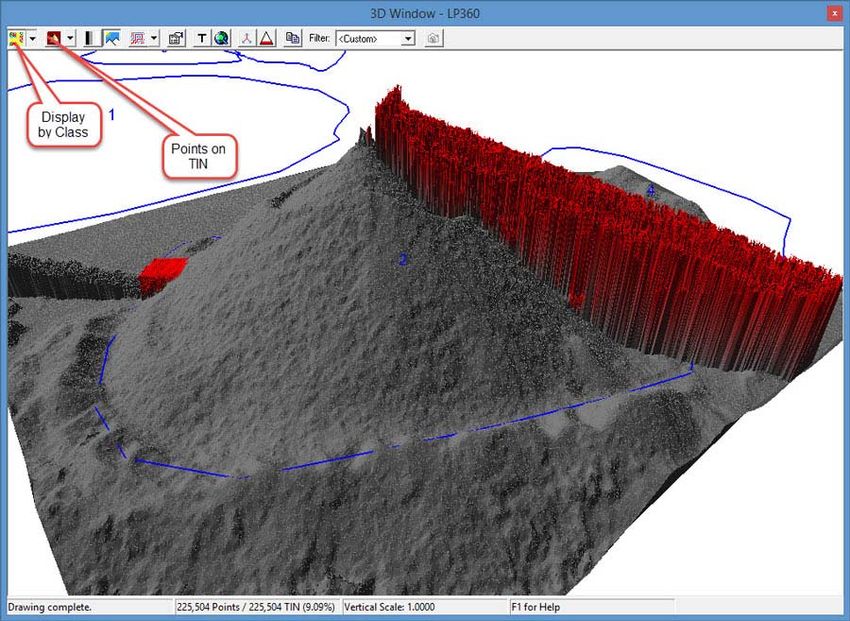
Tools
Volumetrics – Do it Right!
Before we get into the details, recall how it is that we compute volumes in the first place. In LP360 we
use a triangulated irregular network (TIN) constructed from points and polygons as the surfaces for
performing these computations (as well as many other things in LP360!). A TIN allows you to make a
solid surface from a “porous” point cloud model. The points are connected via “edges” using an
algorithm called the Delaunay triangulation (invented in 1934 by Boris Delaunay!). The edges then form
triangles called “facets.” The triangulation process itself has no intelligence other than some rules about
which particular choices to make regarding drawing the edges. This means that if some points exist that
are not supposed to be included in the surface model, some other mechanism must be used to effect
this exclusion. Just as we do with LIDAR data processing, we typically use “classification” to indicate
these excluded points.
First let’s have a look at what might happen if we just process the stockpile of Figure 1 with no data
preparation. When the Volumetric Analysis Point Cloud Task (PCT) forms a TIN of the surface of the pile,
the overhead conveyor will be included in the model. A zoomed in view of this (shaded by elevation to
make the defect stand out) is shown in Figure 2. Notice how the edges of the TIN extend from the
surface of the stockpile to the conveyor. If we were to proceed with the computation, we would have a
volume much larger than that of the gravel portion of the pile.

                                      Figure 2: Conveyor included in TIN

Lewis Graham                                     Page 2 of 8                        QCoherent Software LLC
January 9, 2015                                                                           www.LP360.com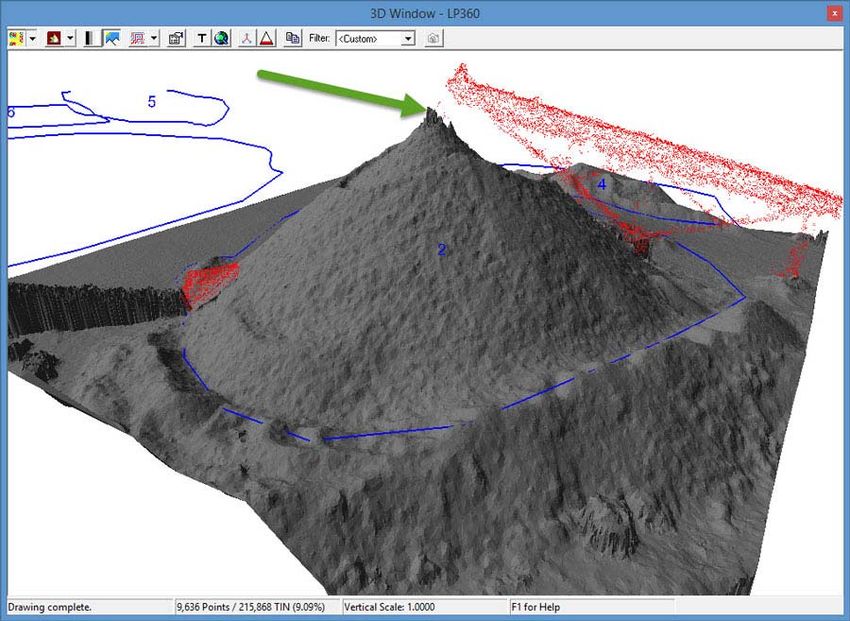
Tools
Volumetrics – Do it Right!
Fortunately we can address this problem by tagging the points that do not belong to the stockpile
through point classification. We can set this up by either defining a special class for the conveyor or
using a class that we do not need for other purposes. We will simply use class 6, the Building class, for
this purpose. The best approach to classifying in the vertical direction (that is, we want to classify the
conveyor into a different category than the stockpile) is to use the profile view. This configuration is
depicted in Figure 3. Note the conveyor above the stockpile in the lower section of the figure (pointed
out by the red arrow). As an aside, also note how poorly the conveyor itself is modeled in the DIM. If we
were looking at high density LIDAR data, the conveyor would have clean, sharply defined edges. This lack
of linear feature definition in a DIM is a characteristic of this type data. However, relatively low
curvature surfaces such as the stockpile itself are well modeled. Anyway, back to the topic at hand. We
need to include the stockpile in our model but exclude the conveyor.

                                      Figure 3: Conveyor above stockpile

Note in Figure 4 how we have set up the profile view for this type of classification. The source class
cannot be seen but it is set to include all points. The destination class (green arrow) is set to “Building”
and we are using the “classify above line” (blue arrow) tool. As I digitize a line, the points that will be
moved to the Building class are highlighted in white (red arrow). Hitting the space bar commits the
reclassification. Note that, in the event of an error, you can undo the classification by pressing the Undo
button in the main reclassification toolbar.

Lewis Graham                                     Page 3 of 8                         QCoherent Software LLC
January 9, 2015                                                                            www.LP360.com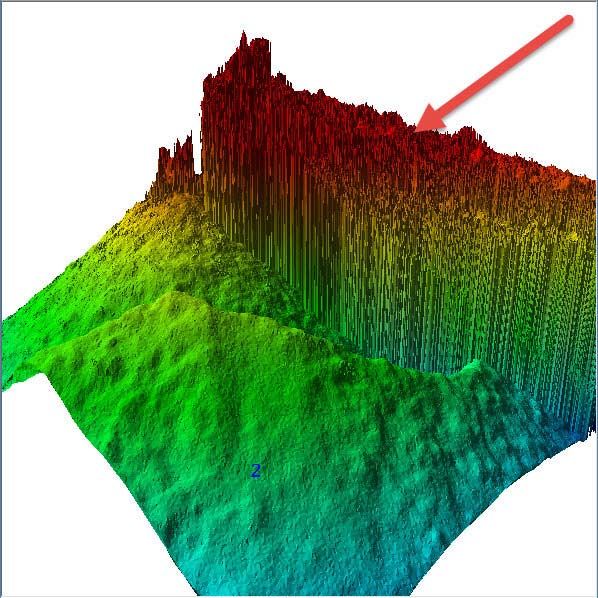
Tools
Volumetrics – Do it Right!

                                  Figure 4: Classifying "above line" to Building

The result of the reclassification is depicted in Figure 5. Note that I am displaying the points by
Classification. The color for Unclassified is grey whereas the default color for Building is red (you can
change these via the legend settings).

                                       Figure 5: The reclassified conveyor

Lewis Graham                                       Page 4 of 8                        QCoherent Software LLC
January 9, 2015                                                                             www.LP360.com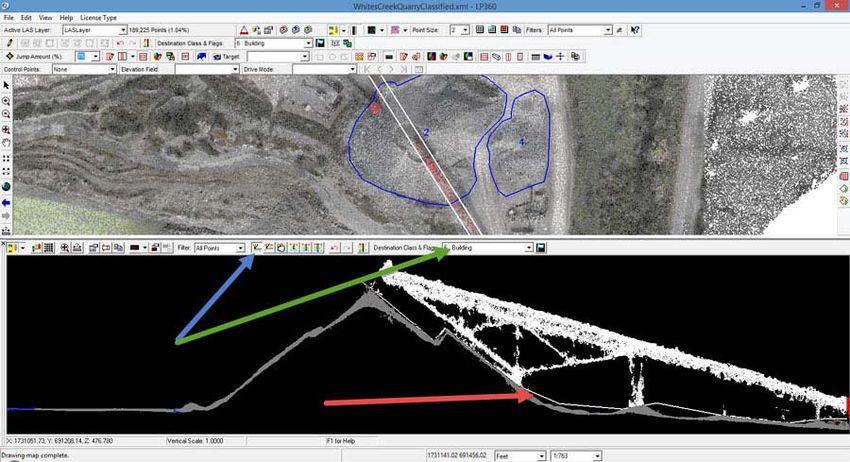
Tools
Volumetrics – Do it Right!
We are not quite ready to do the volume computation. First a Quality Check (QC) step is in order. LP360
has a really cool feature that is custom made for this purpose. In LP360 you can configure separate
“channels” for displaying by points and by TIN. In our example, we will configure the 3D View to use the
Building class for points and all other points for the TIN. First we select the stockpile area for 3D viewing,
set the display mode to Classification and the rendering mode to “Points on TIN.” This configuration is
depicted in Figure 6. Note that we have the conveyor points participating in the TIN.

                                       Figure 6: Configuring the 3D View

Next we configure the symbology filter to separate the classes being used in the TIN and Point display.
The first setting is the “Display”, “Points Filter” tab. As shown in Figure 7, this tab is configured to
separate the Points and TIN display channels (by unchecking the “Use Points Filter for TIN” option) and
configuring to allow only the Building points.

Lewis Graham                                      Page 5 of 8                         QCoherent Software LLC
January 9, 2015                                                                             www.LP360.com
Tools
Volumetrics – Do it Right!

                                      Figure 7: Setting up the Points Filter

Next, the TIN filter tab is configured to show all classes except the Building class (Figure 8). Of course, we
could have selected only Class 0 (Created, Never Classified) as the only class since this is the class we are
using for the non‐conveyor potions of the display.

Lewis Graham                                       Page 6 of 8                        QCoherent Software LLC
January 9, 2015                                                                             www.LP360.com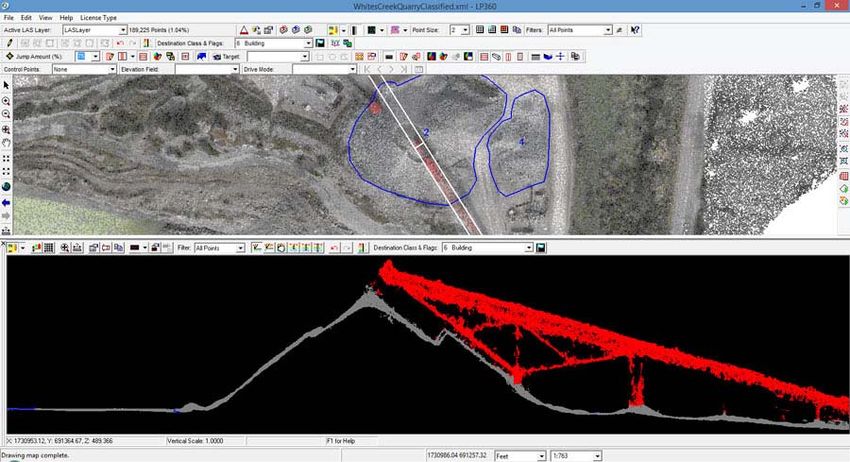
Tools
Volumetrics – Do it Right!

                                   Figure 8: Configure the TIN display filter

After dismissing this dialog by pressing OK (and ensuring the display mode is set to Points on TIN), you
should see the 3D view look similar to Figure 9. Here we see the surface rendered in grey (make sure
you have enabled Shading in the 3D view) and the points of the conveyor, rendered as points, above and
separate from the Surface TIN. Note a bit of noise above the top of the pile. You may want to move a
few of these points to the Building class as well to eliminate them from the volume computation. Of
course, if you are doing a rigorous classification, you would move these to a Noise class (Classes 7, 18).
Also notice that I am displaying the stockpile bases as the blue polygons. I find that I tend to overclassify
if I don’t have this delineation displayed (I guess I color outside the lines!).

Lewis Graham                                      Page 7 of 8                        QCoherent Software LLC
January 9, 2015                                                                            www.LP360.com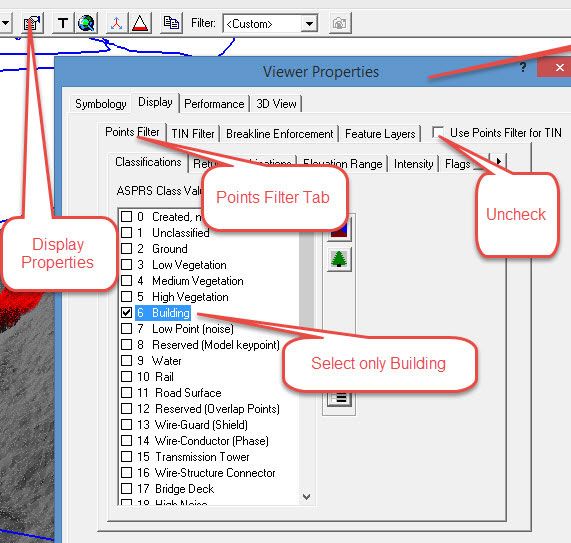
Tools
Volumetrics – Do it Right!

                                  Figure 9: The 3D view Points, TIN rendering

A very nice feature of LP360 is the dynamic linking of windows. This means that as you classify points in
the profile window, the 3D window will automatically update to reflect the changes. This makes
classifying a very high quality surface for volumetrics (or any other use, for that matter) a very
immersive task with immediate quality feedback. As a side note, a three monitor setup is absolutely
lovely since you can pull each of the Map, Profile and 3D views from the main application and expand
each to fill an entire monitor!
After this classification and quality check, you would compute volumes as normal. The only change from
the completely unclassified case is to ensure that you have set the Volume PCT filters to exclude the
Building class. Note, very importantly, that it is not usually necessary to classify ground when performing
volumetric analysis. My usual approach is to assess the customer deliveries (did the customer specify a
classified point cloud), the environment (overhanging features, interfering vegetation, etc.?) and then
make classification decisions.
I hope you have found this article useful, not only in providing a bit more insight into volumetric analysis
strategies but also some of the inherent power of what might be considered obscure features in LP360.
The other obvious conclusion is that LP360 is not just a nice add‐on to point cloud generation software
but an absolute requirement.

Lewis Graham                                     Page 8 of 8                         QCoherent Software LLC
January 9, 2015                                                                            www.LP360.com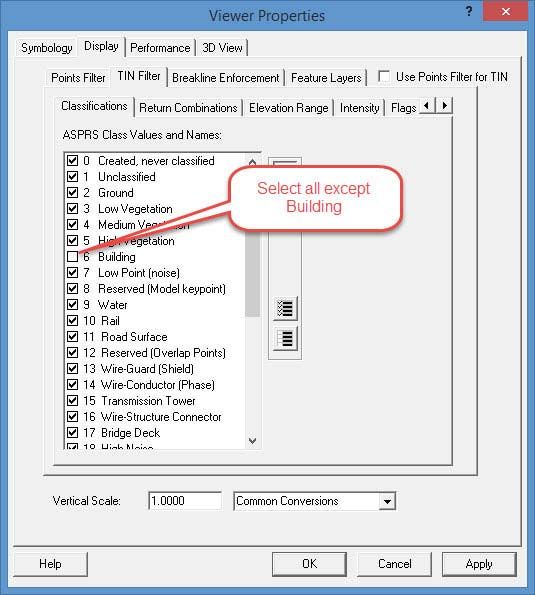
You can also read