QUARTELY PAYMENT SYSTEM REPORT 4/23/2021

Page created by Barbara Cooper
 
CONTINUE READING
QUARTELY PAYMENT SYSTEM REPORT 4/23/2021
4/23/2021

            QUARTELY PAYMENT SYSTEM REPORT
                   2021 Q1 (January – March)

            Department of Payment and Settlement Systems
QUARTELY PAYMENT SYSTEM REPORT 4/23/2021
FOREWORD

W     e are delighted to share the 2021 Q1 report. The report highlights the outlook of payment
      channels – in terms of volume, value and usage, observed in the first quarter (January
2021- March 2021) of 2021. The report from this quarter shall include inward remittances
received from non-resident Bhutanese residing abroad and international payment gateway
transactions.

For easy reference, the report has been categorized as - 1) Domestic payment transactions

2) Regional and International transactions.

We would like to thank all our contributors for submitting the reports on time.
QUARTELY PAYMENT SYSTEM REPORT 4/23/2021
1. DOMESTIC PAYMENT CHANNELS

   Paper                  Domestic                                           Mobile &
   Based                  Payment                                            Internet
 (Cheque)                 Gateway                  e-Money                   Banking

                Card                      GIFT                  Bhutan
               (ATM &                                           QR Code
                POS)

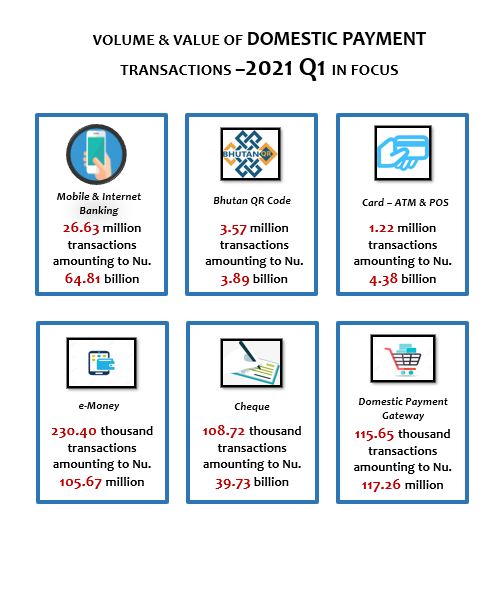
In the first quarter of 2021, a total of 31.92 million payment transactions valued at Nu.
167.01 billion were made through the domestic payment channels. Domestic payment
transactions include transactions effected within Bhutan through the following channels viz.
Cheques, Mobile and Internet Banking, QR payments, Payment Gateway, e-money,
electronic fund transfer and Card transactions.

Table 1: Payment Transactions – 2021 Q1

        Payment Channels                                      2021 Q1
                                           Volume in thousands            Value in millions
 Paper-Cheques                                    108.72                      39,737.21
 Mobile & Internet Banking                      26,634.53                     64,807.37
 Bhutan QR Code                                  3,568.81                      3,886.11
 Payment Gateway                                  115.65                        117.26
 e-Money                                          230.40                        105.67
 Electronic Fund Transfer                          43.72                      53,975.57
 Card Transactions                               1,218.27                      4,377.71
               Total                            31,920.09                    167,006.90

In the Q1, Mobile and internet banking accounted for 83.4% and 38.8% in volume and value
terms respectively. The volume of mobile and internet banking saw an exponential q-o-q
growth of 137.5% in 2021 Q1. Similarly, the GIFT platform saw an increase of 89.3% over 2020 Q1
in fund transfers (B2B, B2C, B2P, G2B, G2P, P2P) both by the businesses and government
agencies and onboarding of new entities on the GIFT platform for disbursement of salaries,
loans and pensions.

The volume of cheque transactions continued to decline in Q1. Compared to Q1 2020, cheque
usage declined by 50.4% in 2021 Q1. However, cheque still account for 23.8% of the market
share in value terms in 2021 Q1.
The graph below depicts the share percentage of payment channels in volume in 2020 Q1 –
mobile and internet banking with majority share (83.4%) and electronic fund transfer through
GIFT with the least (0.1%). In terms of value, mobile and internet still remained on the top (38.8
%) followed by Cheque (23.8%).

Graph 1: Share percentage of Payment Channels in Volume – 2020 Q1

  0.7%      Share Percentage of Payment Channels in Volume -2020 Q1
                  0.1% 3.8% 0.3%                   Paper-Cheques
             0.4%
                    11.2%                                      Mobile & Internet Banking

                                                               Bhutan QR Code

                                                               Payment Gateway

                                                               e-Money
                             83.4%
                                                               Electronic Fund Transfer

                                                               Card Transactions

Graph 2: Share percentage of Payment Channels in Value – 2020 Q1

           Share percentage of Payment Channels in Value – 2020 Q1

                                                             Paper-Cheques

                            2.6%                             Mobile & Internet Banking
                                   23.8%
                                                             Bhutan QR Code
                  32.3%
                                                             Payment Gateway

                    0.1%0%
                  0.1%,
                  2.3%, 2%                                   e-Money
                                38.8%
                                                             Electronic Fund Transfer

                                                             Card Transactions
A) MOBILE AND INTERNET BANKING

W       ith timely enhancement on the daily
        limits on mobile and internet
banking including interbank fund transfer
                                                                                               The rate of increase in the transactions was
                                                                                               137.5% in 2021 Q1 over 2020 Q1.

                                                                                               To    reach    the    unbanked/illiterate
from Nu. 200,000 per day to Nu. 1 Million
                                                                                               population, on boarding of new users on
per day, payments through mobile and
                                                                                               mobile applications have been relaxed
web application allowed many economic
                                                                                               especially   during    the    nationwide
activities (such as purchase of groceries
                                                                                               lockdowns. For example, a customer can
other essential goods, payment for
                                                                                               simply download the application on his/her
services like telecommunications, utilities,
                                                                                               phone and register for banking services
and many more). Also, because of its
                                                                                               through online without having to visit the
mobility, mobile and internet banking has
                                                                                               bank.
become one of the most preferred modes
of payment channels among the users.                                                           A total of 33K new users have been on-
                                                                                               boarded in the 2020 Q1, totaling the total
Over the years, the volume of mobile and
                                                                                               mobile app users to 380K as of 31st March
internet has been increasing significantly.
                                                                                               2021, in the country.

Graph 3: Mobile & Internet Banking Transactions (2020 – 2021 Q1)

                                                   Mobile & Internet Banking Transactions
                        12.00
                                                                                                                                                               10.03
   Volume in millions

                        10.00                                                                                                    8.20 8.40
                        8.00                                                                                      7.24 7.20 7.80
                                                                              5.43 5.95 6.56
                        6.00                                        4.78 5.06
                                3.52 3.64 4.06 4.11
                        4.00
                        2.00
                           -
                                                                                                                           Nov-20
                                                                             Jun-20

                                                                                                Aug-20

                                                                                                                  Oct-20

                                                                                                                                    Dec-20

                                                                                                                                                      Feb-21
                                         Feb-20

                                                           Apr-20

                                                                                      Jul-20

                                                                                                                                             Jan-21

                                                                                                                                                                Mar-21
                                Jan-20

                                                  Mar-20

                                                                    May-20

                                                                                                         Sep-20
B) BHUTAN QR CODE

I  n the first quarter of 2021, a total of
   3,568.81 thousand transactions were
   recorded valued at Nu. 3.89 billion, an
                                               terms of dzongkhag wise, Thimphu has the
                                               maximum merchants with 9K, Chhukha
                                               with 2K and Gasa with the least number of
exponential growth rate of 56.2% over 2020     merchants onboarded (42 only).
Q4. BOBL has recorded 3.23 million
                                               Table 1 - Merchants onboarded on Bhutan
transactions valued at Nu. 3.49 billion,
                                               QR Code
followed BNB with 0.28 million
transactions valued at 310.87 million.              Banks         Merchants onboarded
                                                BOBL                        13,732
During the quarter, a total of 20K new          BNBL                         3,800
merchants were onboarded by the                 T-Bank                       2,611
member banks. Of which, 67.0% belongs to        BDBL                           338
BOBL, followed by BNBL with 18.6%. In           Total                       20,481

Graph 4 – Bhutan QR Code Transactions (July 2020 – March 2021)
C) E-MONEY – B-NGUL AND E-TEERU

C    urrently, there are two licensed e-
     Money institutions in the country – B-
     Ngul, owned and operated by Bhutan
                                                          As of 31st March 2021, B-Ngul and e-Teeru
                                                          have on-boarded 55K and 56K users,
                                                          respectively.
Telcom, and e-Teeru, owned and operated
                                                          Amongst the services offered by an e-
by TashiCell. B-Ngule has been in operation
                                                          Money institution, telecommunication
since 2018 and the latter in the year 2020.
                                                          service dominated the maximum portion
In the 2021 Q1, B-Ngul and e-Teeru have
                                                          of the transactions with 70.9%, followed by
recorded 3,884 and 226,554 transactions
                                                          add from bank with 21.9%.
amounting to Nu. 2.31 million and Nu.
103.36 million, respectively.

Graph 5 – e-Money Transactions

                                     e-Money Transactions
                     Merchant Payment           7,938
                               Air Time       1
                               Cash Out       40
   Services

                                Cash In       747
                          Sent to Bank          7,123
                        Add from Bank                       50,400
              Telecommunication service                                                  163,444
                      BPC bill Payment        652
                          Tax Payment         18
                        RICBL Payment         35
                                          -             50,000       100,000   150,000      200,000
                                                           Number of Transactions
D) GIFT – RTGS, BITS AND BULK

W     ith the launch of the GIFT system
      with e-PEMS in the year 2019, the
                                               increasing steadily over the years as
                                               illistruted below. The rate of increase in
RMA has played a pivitol role in ensuring      RTGS in 2021 Q1 was 98.4% and 4.6% in
seamless inter bank fund transfers through     volume and value terms over 2020 Q1. With
RTGS, BITS and BULK. Almost 99.9 % of the      Bulk, the volume and value of transactions
government’s inter-bank transactions are       has sored to 98.8% and 200.5%, repectively
routed through GIFT. Further, with the         over 2020 Q1. Awarness creadted by the
onboarding of more entities on the GIFT        banks and RMA also contributed to the
platfrom - for the disbrusement of salaires,   growth in transactions volume besides the
loans, pensions, B2B, B2C, G2B, G2P, P2P,      GIFT system being convienent and efficient
etc. the transaction volume of GIFT is         (REALTIME).

Graph 6 – GIFT Transactions – RTGS and BULK
E) DOMESTIC PAYMENT GATEWAY

T    he RMA has been facilitating domestic payment gateway facilities to any interested
     government agencies, corporates, private organizations, and individual merchants
     wishing to host their web/mobile application on the merchant portal hosted at the RMA
to make their services easily available to the customers without having to visit physically to
make payment for services or purchase it online at their convenience. The transactions
volume of DPG has been increasingly steadily over the years, the rate of increase in 2021 Q1
was 112.9% and 253.6% in volume and value terms respectively over 2020 Q1. In the 2021 Q1, a
total of 115,650 transactions valued at Nu. 117.2 million was routed through domestic payment
gateway.

Currently, there are 44 entities/private/merchants onboarded on the domestic payment
gateway platform.

Graph 7 – Domestic Payment Gateway Transactions

                                                      Domestic Payment Gateway Transactions
  Number of Transactions

                           60,000
                                                                                                                                                                 49,235
                           50,000
                                                                                                                                        39,897              40,190
                           40,000
                           30,000                                                                                                                 26,225
                           20,000                                                                  12,055
                           10,000
                               -
                                                                                                                               Nov-20
                                                                                 Jun-20

                                                                                                    Aug-20

                                                                                                                      Oct-20

                                                                                                                                         Dec-20

                                                                                                                                                             Feb-21
                                             Feb-20

                                                               Apr-20

                                                                                          Jul-20

                                                                                                                                                   Jan-21

                                                                                                                                                                      Mar-21
                                    Jan-20

                                                      Mar-20

                                                                        May-20

                                                                                                             Sep-20
F) CARD – ATM AND POS

I n the first quarter of 2021, a total of 1,217.9 transactions valued at Nu. 4.38 billion was made
  – a decline of 47% and 49% in volume and value terms over 2020 Q1. The decline in the ATM
  transactions was contributed by an increase in mobile and internet banking, and Bhutan QR
Code. These two payment channels have become the most preferred payment modes at
merchants or any public service deliveries. One of the contributing factors could be due to the
ongoing COVID-19 pandemic which has created a fear that the virus could spread from the
physical cash.

In terms of dzongkhag wise ATM withdrawal, Thimphu has recorded the maximum number
of ATM withdrawals 446.4 thousand transactions amounting to Nu. 1.5 billion in the 2020 Q1,
followed by Chhukha with 154.4 thousand transactions amounting to Nu. 595.1 million. Gase
dzongkhag recorded the lowest ATM transactions of 3,188 valued at Nu. 10.8 million.

POS machines recorded 288 transactions amounting to Nu. 0.9 million in the first quarter of
2021.

Graph 8 –ATM Transactions

                                                                                 ATM Transactions
                        1000.00                                                                                                                                            3.50
  Volume in thousands

                                                                                                                                                                           3.00

                                                                                                                                                                                  Value in billions
                        800.00
                                                                                                                                                                           2.50
                        600.00                                                                                                                                             2.00
                        400.00                                                                                                                                             1.50
                                                                                                                                                                           1.00
                        200.00                                                                                                                                             0.50
                           0.00                                                                                                                                            0.00
                                                                                                                              Nov-20
                                                                                 Jun-20

                                                                                                   Aug-20

                                                                                                                     Oct-20

                                                                                                                                       Dec-20

                                                                                                                                                         Feb-21
                                  Jan-20
                                           Feb-20

                                                              Apr-20

                                                                                          Jul-20

                                                                                                                                                Jan-21

                                                                                                                                                                  Mar-21
                                                    Mar-20

                                                                        May-20

                                                                                                            Sep-20

                                                             volume in thousand                                      Value in billion
G) PAPER BASED (CHEQUE)

E     ven though the volume of cheque is
      declining over the years, cheque is still
one of the preferred channels for high
                                                  Table 1 – Cheque Transactions

                                                   Quart      Volume in           Value in
                                                    er        thousands           billions
value payments. In 2021 Q1, a total of 108.7       2020         219.027
thousand transactions valued at Nu. 39.74           Q1                             65.89
billion was recorded - a decline of 15% and        2020         150.417
                                                    Q2                             72.96
4.2% in volume and value terms over 2020
                                                   2020        106.961
Q1. Further, the decline in the number of           Q3                             41.29
cheques could partially be due to the              2020         127.95
nationwide lockdown 2.0 which had lasted            Q4                             41.47
till January 2021. Another reason could be         2021         108.72
                                                    Q1                             39.74
increase in the volume of GIFT -RTGS which
is REAL TIME settlement (does not follow
deferred net settlement).

Graph 9 – Cheque Transactions
2. REGIONAL AND INTERNATION TRANSACTIONS

A) REGIONAL TRANSACTIONS - RUPAY

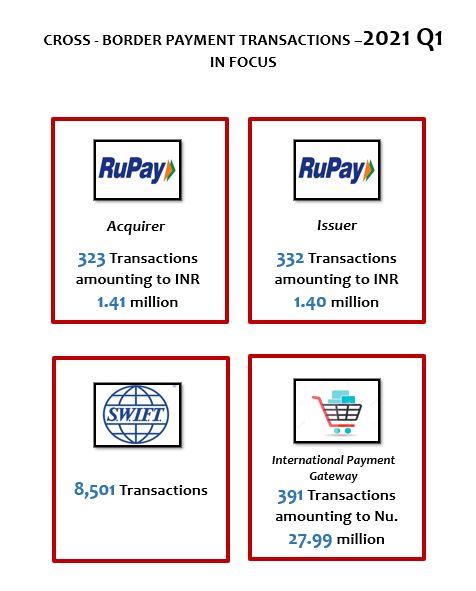
I  n the first quarter of 2021, a total of 323 RuPay transactions amounting to INR 1.4 million was
   acquired through ATM withdrawals in the country. Whilst, 332 RuPay transactions valued at
   INR 1.4 was issued through ATM withdrawals in India. The decline in the inward INR could
be due to closer of all international boarders due to the COVID-19 pandemic which has greatly
affected the tourism sector around the world. However, the transaction volume of RuPay
issuing has been increasing steadily as shown in Graph 10.

As of March 2021, a total of 1,609 RuPay cards have been issued to students, corporate and
private employees, government agencies, and monks.

Graph 10 – Acquirer Transactions

                                                                    RuPay Acquirer Transacitons
    Number of Transactions

                             1,500                                                                                                                                              4.00

                                                                                                                                                                                       Value in millions
                             1,000                                                                                                                                              3.00
                                                                                                                                                                                2.00
                              500                                                                                                                                               1.00
                                -                                                                                                                                               -
                                                                                                                                  Nov-20
                                                                                    Jun-20

                                                                                                      Aug-20

                                                                                                                         Oct-20

                                                                                                                                           Dec-20

                                                                                                                                                              Feb-21
                                                Feb-20

                                                                  Apr-20

                                                                                             Jul-20

                                                                                                                                                    Jan-21

                                                                                                                                                                       Mar-21
                                       Jan-20

                                                         Mar-20

                                                                           May-20

                                                                                                               Sep-20

                                                                             Volume                        Value in millions

Graph 11 – Issuer Transactions

                                                                              RuPay Issuer Transactins
 300                                                                                                                                                                             1500000

 200                                                                                                                                                                             1000000

 100                                                                                                                                                                             500000

             0                                                                                                                                                                   0
                                    Nov-20                   Dec-20                          Jan-21                         Feb-21                           Mar-21
                                                                                         Volume                         Value
B. INTERNATIONAL TRANSACTIONS – SWIFT AND ACU

S   WIFT has been facilitating trading of currencies, investment (short and long term), and
    payments of government’s debt since 2005. USD covered the maximum portion of the
    SWIFT transaction in volume with 84.5%, followed by EURO with 6.5%. whilst, in terms of
value INR dominated in 2020 Q1.
Asian Clearing Union (ACU) recorded 191 transactions valued at USD 53.9 million in 2021 Q1.

   Graph 12 – Currency Wise SWIFT Transaction

                              Currency Wise SWIFT Transactions
                                1.7% 1.2% 0.7% 2.6% 0.1%
                                    1.7%
                                0.9%

                       6.5%

                                               84.5%

                       USD                   EURO                   GBP

                       YEN                   Swiss Franc (CHF)      Singapore Dollar

                       Canadian Dollar       Australian Dollar      INR
C. INTERNATIONAL PAYMENT GATEWAY
Currently BOB and BNB have been facilitating international payment gateway to the
government agencies, private individuals in tourism sector and merchants. In the first quarter
of 2021, BOB has recorded a total of 391 transactions amounting to Nu. 27.9 million. Whilst,
BNB did not record any IPG transactions.

Graph 13 – International Payment Gateway Transactions

                    International Payment Gateway (BOB)
 250                                                                                    20.00
                                                                         194
 200                                                                                    15.00
 150                                         111
                  86                                                                    10.00
 100
  50                                                                                    5.00
   0                                                                                    -
                 Jan-21                     Feb-21                      Mar-21
                                   Volume            Value in million

As of 31 March 2021, BOB and BNB have onboarded 269 and 263 IPG users, respectively. Most
of the transactions were made for ecommerce (online purchase of goods and services), and
fees for postal services. In terms of merchant categories, the list includes government
agencies, corporate agencies, and individual merchants.
3. REMITTANCE

Bhutanese residing in Australia, USA,             Graph 14 – Currency Wise
Middle East, and European countries have
been increasing over the years.                                Currency Wise
During the first quarter of 2021, Bhutan
received a total of 18,726 transactions
                                                                          32.2%
valued at USD 21.76 million. T Bank
recorded the maximum inflow of                                 69.8%
remittance with 79.0%, Bhutan Post-
Western Union with 19.8%, followed by
BOB with 0.9% of the total remittance.                 USD (in million)      AUD (in million)

Graph 15 – Remittance Channels

                      Remittance Channels - Value in millions

           Bhutan Post-Western Union                 4.31

    T Bank (T Pay Remit Since Nov 2019)                                        15.15

   T Bank (Prabhu Remittance since Oct
                                              2.04
                  2017)

          RemitBhutan (Bank Transfer)      0.26

                                       0.00         5.00      10.00       15.00        20.00
You can also read