Result Update Presentation - Q1 FY2015 Jagran Prakashan Limited (JPL)
←
→
Page content transcription
If your browser does not render page correctly, please read the page content below
Jagran Prakashan Limited (JPL)
Result Update Presentation
Q1 FY2015
Safe Harbor
This presentation and the accompanying slides (the “Presentation”), which have been prepared by Jagran Prakashan Limited (the
“Company”), have been prepared solely for information purposes and do not constitute any offer, recommendation or invitation
to purchase or subscribe for any securities, and shall not form the basis or be relied on in connection with any contract or binding
commitment what so ever. No offering of securities of the Company will be made except by means of a statutory offering
document containing detailed information about the Company

This Presentation has been prepared by the Company based on information and data which the Company considers reliable, but
the Company makes no representation or warranty, express or implied, whatsoever, and no reliance shall be placed on, the truth,
accuracy, completeness, fairness and reasonableness of the contents of this Presentation. This Presentation may not be all
inclusive and may not contain all of the information that you may consider material. Any liability in respect of the contents of, or
any omission from, this Presentation is expressly excluded.

Certain matters discussed in this Presentation may contain statements regarding the Company’s market opportunity and business
prospects that are individually and collectively forward-looking statements. Such forward-looking statements are not guarantees
of future performance and are subject to known and unknown risks, uncertainties and assumptions that are difficult to predict.
These risks and uncertainties include, but are not limited to, the performance of the Indian economy and of the economies of
various international markets, the performance of the industry in India and world-wide, competition, the company’s ability to
successfully implement its strategy, the Company’s future levels of growth and expansion, technological implementation, changes
and advancements, changes in revenue, income or cash flows, the Company’s market preferences and its exposure to market
risks, as well as other risks. The Company’s actual results, levels of activity, performance or achievements could differ materially
and adversely from results expressed in or implied by this Presentation. The Company assumes no obligation to update any
forward-looking information contained in this Presentation. Any forward-looking statements and projections made by third
parties included in this Presentation are not adopted by the Company and the Company is not responsible for such third party
statements and projections.

                                                                                                                                       2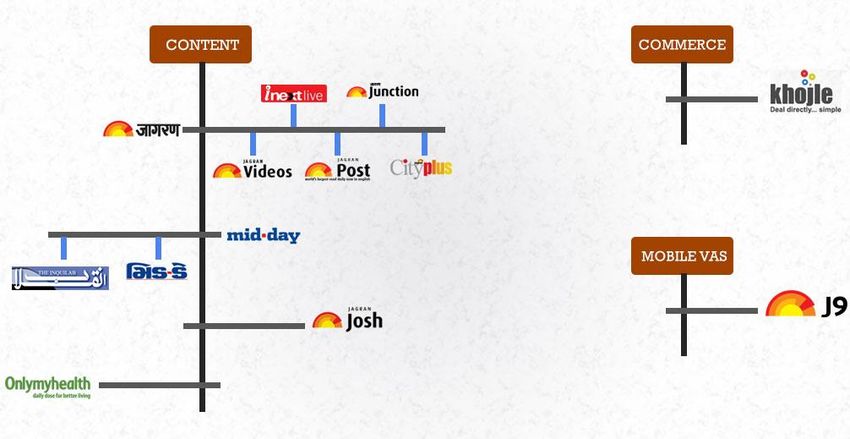
Consolidated Financials Highlights

Digital Business Overview

                                     3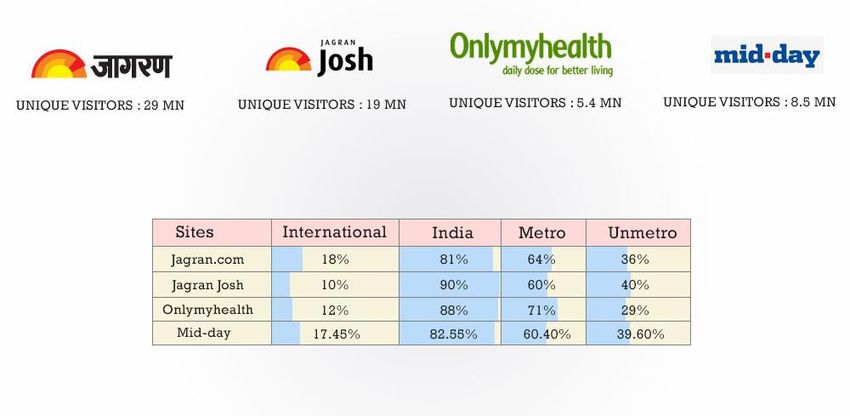
Key Highlights
Revenue for the Quarter Rs. 440 Crs., 7% Growth
EBITDA for the Quarter Rs. 107 Crs., 5% Growth
Operating Margin of “Dainik Jagran” at 34%
Dainik Jagran – Most Circulated Newspaper of Patna
Digital Advertising Revenue Growth of 57%
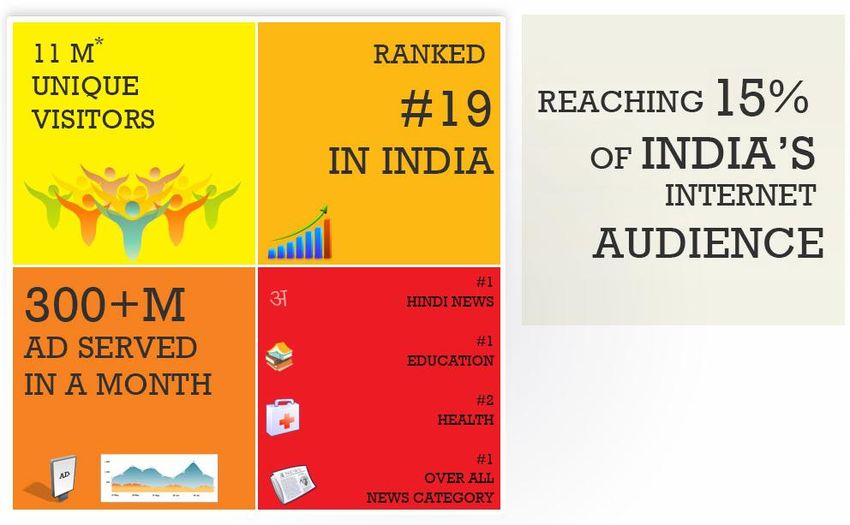
Jagran sites ranked at # 19* amongst all Indian Internet sites and # 4* amongst
all media company’s internet sites
Dainik Jagran – Only Indian Newspaper amongst 6 Newspapers in the world that
has won two 1st place awards at INMA in 2014
* Source: ComScore 4
Consolidated Quarterly Profitability Statement
Rs. in Crs Q1 FY15 Q1 FY14 YoY Q4 FY14 QoQ Advertisement Growth of
7% despite subdued activity
Revenues 440.3 412.2 7% 420.7 5%
in Advertising during
Advertisement Revenue 308.9 289.8 7% 291.7 6% election period
Circulation Revenue 95.7 85.5 12% 88.7 8%
Circulation Revenue growth
Others 35.7 37.0 40.3 is mainly driven by
improvement in Per Copy
Raw Material 162.7 141.6 157.1
Realization
Manpower Cost 64.8 60.0 58.5
Achieved growth in
Other Operating Expenses 105.8 108.7 126.2
Operating Profit despite
Operating Profit 107.0 101.9 5% 79.0 36% increase in Newsprint cost
over 12%
Operating Profit Margin 24.3% 24.7% 18.8%
Other Income 6.9 -1.2 45.8 Additional Depreciation of
Rs. 4.95 Crs provided on
Depreciation & Amortisation 23.8 18.1 22.0 account of new Company’s
Interest 8.4 7.1 10.1 Act accounting guideline
Exceptional Items -- -- 10.1 Effective Tax rate in Q1
Profit Before Tax 81.8 75.6 8% 82.6 -1% FY14 was lower due to
benefit of accumulated
Tax 26.7 17.7 27.4 losses of Naidunia print
Profit After Tax 55.1 57.8 -5% 55.2 0% business
5
Operating Margin break-up
Publications (Rs. Crs) Q1 FY15 Q1 FY14 Q4 FY14 FY14 FY13
Continued Operating
Dainik Jagran Losses in Other
Publications :
Operating Revenue 335.9 310.3 312.7 1,258.0 1,127.6
– Mainly due to
Operating Profit 114.2 114.1 91.1 413.4 345.6 Continued
Investments in
Operating margin 34.0% 36.8% 29.1% 32.9% 30.7% NaiDunia as a part of
strategy to increase
Other publications
the Circulation
Operating Revenue 76.1 73.6 76.2 320.8 279.2
Operating Profit -7.6 -12.1 -12.7 -29.67 -36.2 – I-Next reported profit
due to strong
Operating margin -10.0% -16.4% -16.6% -9.3% -13.0% Advertising Revenue
growth and improved
Outdoor and Activation business per copy realization
Operating Revenue 25.8 27.8 29.9 120.48 116.5
Operating Profit 0.7 0.5 0.5 2.05 -10.6 – Operating result of
NaiDunia, Mid-day
Operating margin 2.8% 1.8% 1.7% 1.7% -9.1% and Punjabi Jagran
improved
* Other Publications: Naidunia, Midday, I-Next, City Plus, Punjabi Jagran & magazines
6Reduction in Net Debt Position
Rs. Crs. Mar ’14 Jun’14 Net Debt - Equity
Cash & Bank Balance 32.5 35.3
Rs. Crs. 775
Investments * 325.1 298.8
681 0.35 0.08
Gross Cash Balance 357.6 334.1
Borrowings 489.7 395.5
Net Debt 132.0 61.4
* Investments includes Investment in Mutual Fund and ICDs
- Net Debt includes Rs. 95 Crs. of NCDs from Holding
Company redeemable in 2017 at a Premium of 6.5% pa
Rs. Crs.
132.0
61.4
132.0
61.4 March '14 June '14
Networth* Net debt
March '14 June '14
* Networth excluding intangible assets and Goodwill
7Consolidated Financials Highlights
Digital Business Overview
8Why we are bullish for Digital Business
FY 13 - 18 India Internet Connection CAGR: 21.6 %
India is 3rd largest Internet
Wireline connection: 14.4 %
463 Market with 137 mn Urban
Wireless connection: 22.6 %
47 and 68 mn Rural Users
392
Growth in Internet
41
331 connections mainly due to
36 higher penetration of Internet
268
enabled mobile devices and
31
213 Growing adoption of 3G
174 27 416
351 Internet user population in
24
295 2018 expected to increase to
237 ~53% of total number of TV
186
150 viewers from 27% in 2013
Digital Media presents an
opportunity to engage
2013 E 2014 P 2015 P 2016 P 2017 P 2018 P
specific target audience in
Wireless Connection Wireline Connection cost effective way
Million Connections
Source: FICCI-KPMG Indian Media & Entertainment Industry Report 2014 9Translating in Advertising Revenue Growth
FY 13 - 18 Advertising Revenue CAGR: 27.7 %
Top Digital spenders sectors
Desktop Internet Advertising : 25.5 %
during FY 2013 – Auto (13%),
Mobile Advertising : 41.2 % 102.3
BFSI (12%), Travel (12%) and
88.1 Telecom (14%)
19.1
69.7 15.1
Share of Digital Advertising
55.1 10.7 Revenue to increase from
3.7% of Total Advertising
41.2 7.4
Revenue in 2013 to 5.5 % in
30.1 5.1 83.2
73.0 2018
3.4 59.0
47.7
36.1
26.7
2013e 2014p 2015p 2016p 2017p 2018p
Rs. Billion
Source: FICCI-KPMG Indian Media & Entertainment Industry Report 2014 10Jagran – Well prepared to capitalize opportunity
JAGRAN NEW MEDIA
1162 mn Unique Visitors
Source: Google Analytics May 2014 data
Google Analytics includes Traffic coming from India, International - Web and Mobile Users
12Sites with Maximum Unique Visitors
11
10 10
8 8 8
7
6
5
4
3
Unique Visitors (in million)
Source: ComScore Data - Average of 3 months - April 2014 to June 2014
ComScore covers India only web traffic (Doesn’t include Mobile & International Traffic) 13Jagran.com - No. 1 Hindi News Portal
Maximum Number of Unique Visitors
4,639 on Hindi News Portal
3,105
2,563
55
Jagran.com Bhaskar.com Navbharat Times Aajtak.in
Unique Visitors (‘000)
Source: ComScore Data - Average of 3 months - April 2014 to June 2014
ComScore covers India only web traffic (Doesn’t include Mobile & International Traffic) 14Higher Unique Visitors across category
Education Portal Health Portal
5,419 2,264
1,938
2,021
682
1,288
855
104
Unique Visitors (‘000)
Source: ComScore Data - Average of 3 months - April 2014 to June 2014
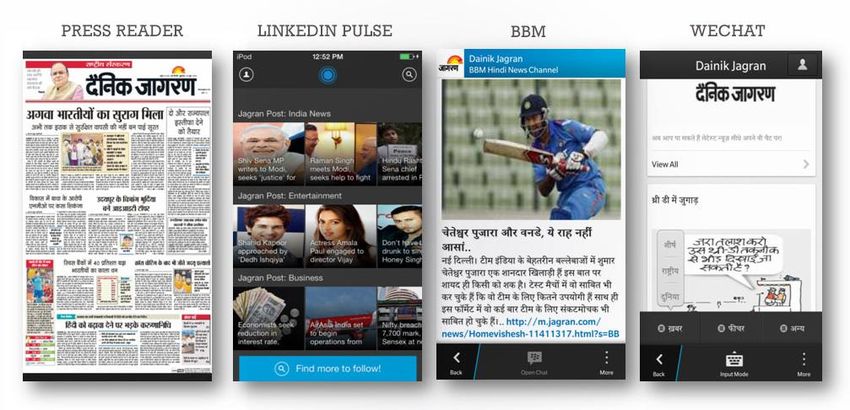
ComScore covers India only web traffic (Doesn’t include Mobile & International Traffic) 15Initiatives to further Strengthen Mobile Platform
CROSS PLATFORM JAGRAN POST JAGRAN HINDI NEWS LAUNCHED FIRST NEWS
MOBILE AND WEB LAUNCHED ON THE APP AND BBM CHANNEL ON THE
PUBLISHING PLATFORM AWARD WINNING CHANNEL POPULAR MESSAGING
FOR E-PAPERS PULSE NEWS APP INTEGRATION APP
16The Strategy…
Leverage Credible News Content of JAGRAN to strengthen DIGITAL
presence
Capitalizing on Growing Mobile Traffic
Building Video Content
Focus on User Generated Content
Increase Foot hold in Non JAGRAN Markets
Covering all major events
Focus on Content Acquisition, Distribution & Alliances
17JAGRAN NEW MEDIA …
… READY FOR
FUTURE
OPPORTUNITIES
Source: ComScore - June 14 ComScore covers India only web traffic (Doesn’t include Mobile & International Traffic) 18For further information, please contact:
Company : Investor Relations Advisors :
Jagran Prakashan Ltd. Strategic Growth Advisors Pvt. Ltd.
CIN: L22219UP1975PLC004147 CIN: U74140MH2010PTC204285
Mr. Amit Jaiswal Mr. Gaurang Vasani / Mr. Jigar Kavaiya
amitjaiswal@jagran.com vgaurang@sgapl.net / kjigar@sgapl.net
www.jplcorp.in www.sgapl.net
19You can also read