Hedgehog User Guide 2.0.0rc1
←
→
Page content transcription
If your browser does not render page correctly, please read the page content below
Hedgehog User Guide 2.0.0rc1
Overview of Hedgehog
Components
Installation options
Datasets
Plots
Directory Structure
Tools
Data Manager
Upload of Data
Import of data
Monitoring data import
Adding or updating servers and nodes
Web front-end
Plot caching
RSSAC reports
Data collection
Generating the reports
Notes
Limitations/Known issues
Overview of Hedgehog
Hedgehog is a visualisation tool for DNS statistics that consumes data acquired with the DSC collector.
Hedgehog was initially developed for ICANN by Sinodun IT and is now released open source under the Apache License, version 2.0. For
more information on the development and support of Hedgehog see the http://www.dns-stats.org website.
Components
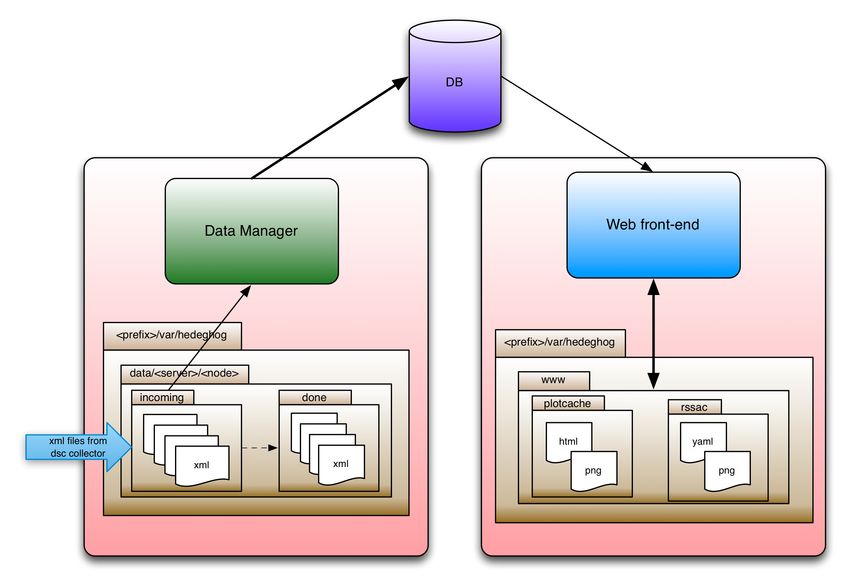
Hedgehog comprises 2 components which can be run on the same or different machines:
Data Manager
Scripts for database creation and management
XML/DAT processing
Web front-end
Installation options
Hedgehog can be installed to run on a single server with both components and the DB local to that server.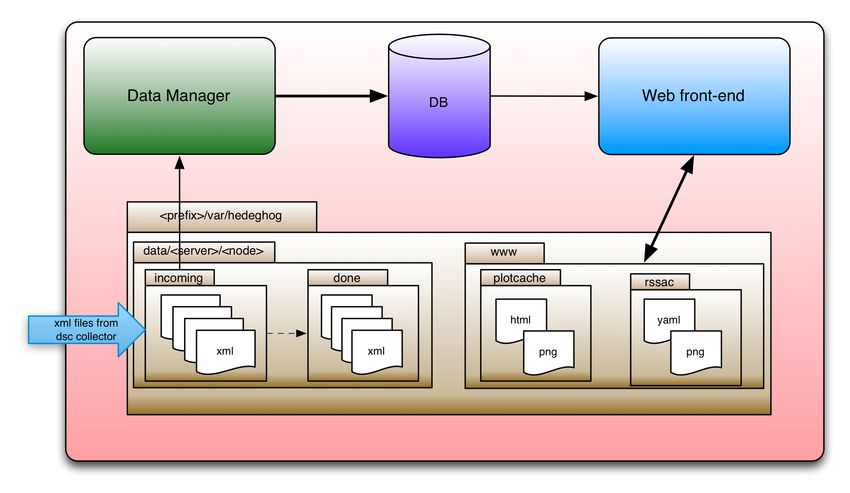
Alternatively the DB may be on a remote server and the Data Manager and Web front-end may be on different servers as shown below.
The installation is documented separately in the Installation guide PDF.

Datasets
An example dsc.conf file for the data sets that Hedgehog supports is given below:
# Basic data sets
      dataset qtype dns All:null Qtype:qtype queries-only;
      dataset rcode dns All:null Rcode:rcode replies-only;
      dataset opcode dns All:null Opcode:opcode queries-only;
      dataset rcode_vs_replylen dns Rcode:rcode ReplyLen:msglen replies-only;
      dataset client_subnet dns All:null ClientSubnet:cip4_net queries-only
      max-cells=200;
      dataset qtype_vs_qnamelen dns Qtype:qtype QnameLen:qnamelen queries-only;
      dataset qtype_vs_tld dns Qtype:qtype TLD:tld queries-only,popular-qtypes
      max-cells=200;
      dataset certain_qnames_vs_qtype dns CertainQnames:certain_qnames Qtype:qtype
      queries-only;
      dataset client_subnet2 dns Class:query_classification ClientSubnet:cip4_net
      queries-only max-cells=200;
      dataset client_addr_vs_rcode dns Rcode:rcode ClientAddr:client replies-only
      max-cells=50;
      dataset chaos_types_and_names dns Qtype:qtype Qname:qname chaos-class,queries-only;
      dataset idn_qname dns All:null IDNQname:idn_qname queries-only;
      dataset edns_version dns All:null EDNSVersion:edns_version queries-only;
      dataset do_bit dns All:null D0:do_bit queries-only;
      dataset rd_bit dns All:null RD:rd_bit queries-only;
      dataset ipv6_rsn_abusers dns All:null ClientAddr:client
      queries-only,aaaa-or-a6-only,root-servers-net-only max-cells=50;
      dataset transport_vs_qtype dns Transport:transport Qtype:qtype queries-only;
      dataset direction_vs_ipproto ip Direction:ip_direction IPProto:ip_proto any;
      dataset dns_ip_version_vs_qtype dns IPVersion:dns_ip_version Qtype:qtype
      queries-only;

      # Additional data sets for RSSAC
      dataset unique_sources dns IPVersion:dns_ip_version ClientAddr:client queries-only;

      dataset traffic_volume_queries dns Transport:transport IPVersion:dns_ip_version
      queries-only;
      dataset traffic_volume_responses dns Transport:transport IPVersion:dns_ip_version
      replies-only;
      dataset traffic_sizes_queries dns Transport:transport MsgLen:msglen queries-only;
      dataset traffic_sizes_responses dns Transport:transport MsgLen:msglen replies-only;

Plots
The relationship between the Hedgehog plots and those produced by DSC are listed here for convenience.

 Hedgehog plot category   Hedgehog plot display name               DSC plot id                DSC display name

Node Statistics

                          By node                                 by_node                     By node

Query Attributes

                          CHAOS queries                           chaos_types_and_names       CHAOS

                          DO bit                                  do_bit                      Query Attributes > DO bit

                          EDNS version                            edns_version                Query Attributes > EDNS version

                          IDN qnames                              idn_qname                   Query Attributes > IDN Qnames

                          OPCODE                                  opcode                      Opcodes

                          RD bit                                  rd_bit                      Query Attributes > RD bit
QTYPE
DNS queries by QTYPE qtype Qtypes
DNSSEC queries by QTYPE dnssec_qtype DNSSEC Qtypes
Popular query names by QTYPE certain_qnames_vs_qtype Popular Names
QTYPE for most popular TLDs qtype_vs_tld TLDs
Query Name Lengths by QTYPE qtype_vs_qnamlen Qname Lengths
RCODE
Replies by RCODE rcode Rcodes
Reply lengths by RCODE rcode_vs_replylen Reply Lengths
IP Protocol
IP version dns_ip_version IP version
Queries by IP version, QTYPE dns_ip_version_vs_qtype IP version > Query types
Received packets by IP protocol direction_vs_ipproto IP protocols
Transports carrying DNS queries transport_vs_qtype DNS transport
PCAP statistics
PCAP statistics
Client Subnet Statistics
Busiest client subnets client_subnet_accum Client Geography
RCODE by client subnet client_addr_vs_rcode_accum Rcodes by Client Address
Root abusers ipv6_rsn_abusers_accum IPv6 root abusers
Classification
Query classification by client subnet (accum) client_subnet2_accum Classification
Query classification by client subnet (count) client_subnet2_count Classification > count
Query classifications client_subnet2_trace Classification > trace
In addition Hedgehog is capable of displaying plots based on datasets defined in the RSSAC 002 document (see later for more details):
Hedgehog plot category Hedgehog plot display name
RSSAC
RCODE volume
Traffic sizes
Traffic volume
Traffic volume differences
Unique sources
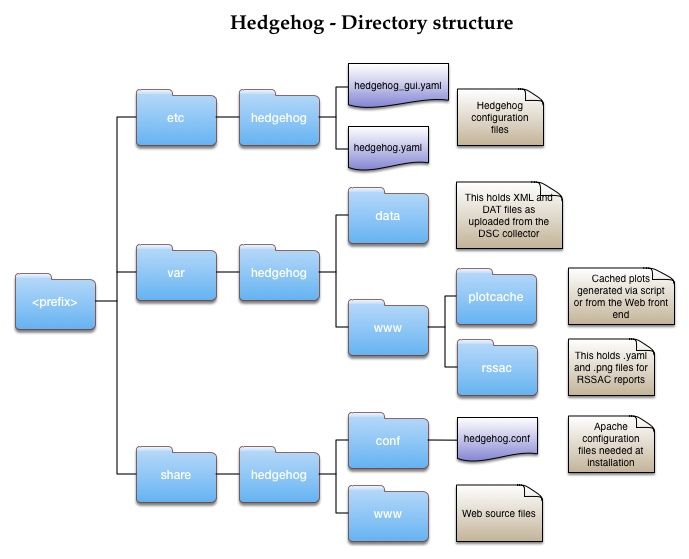
Directory Structure
Hedgehog uses the following directory structure under the install directory (/usr/local/ by default)Tools Hedgehog provides a set of Data Manager scripts to support the database and data file management, and Web scripts to generate cached plots and the RSSAC reports. They are documented separately in the Hedgehog Tools PDF. Data Manager Upload of Data It is assumed that the user has already deployed an upload mechanism used with the DSC collector and presenter. A common practice is to use ssh for the upload. Hedgehog also supports the use of WebDAV for uploads, validated with certificates. This is particularly useful for deployments with many nodes as it scales better than ssh. TODO: Document usage of WebDAV
Import of data
Hedgehog provides a refile_and_grok script for this purpose. See the Installation guide for more details of how to configure this.

Monitoring data import
The import process produces two different logs for the user to track the progress of the data import:

        The refile_and_grok script writes output about which nodes it is processing to a refile_and_grok.out file in the Hedgehog /var
        /hedgehog/data directory. This gives a high level view of the processing.

        The import also generates a log file per node in the /var/hedgehog/data// directory called dsc-extractor.out.
        This lists more details on the processing of each XML file for a specific node.

        A utility script is also provided: /bin/hedgehogctl datafiles_create_summary which can be run to get an summary of the
        current state of processing.

Adding or updating servers and nodes
If new servers or nodes need to be added to the system then the user should:

        update the /etc/hedgehog/nodes.csv files as required to include the new servers/nodes

        run the /bin/hedgehogctl database_update_nodes script which will update the data in the database and create any required
        directory structures

        In the event of adding new servers the user must also then run the /bin/hedgehogctl database_manage_partition scripts to
        create the required database tables so that data can be imported for the new server.

Web front-end
Plot caching
Hedgehog caches plot image files as they are generated by the user. The plot files are cached in the directory listed in the /etc/hedg
ehog/hedgehog.yaml file in the directories section for 'plotcache' (this path is auto-generated in 2.0 and should not be changed by the user).

        The reuse of cached plots can be enabled/disabled by changing the use_plot_caching option in the /share/www/conf/hedge
        hog_gui.yaml configuration file

        The caching_delay_in_hours option in the same file controls the delay applied to caching the most recently uploaded data. For
        example the default for this is 1 i.e. only plots for which the end time is more than one hour ago will be cached. This avoids caching
        plots where the data may still be being imported for some nodes if there were a delay in upload or processing for some reason.

        If desired, a cron job can be created that will create cached plots for specific time periods, for example it may be useful to have a
        cron job to create daily plots for the previous day (see the section on Maintenance). This will make loading of the homepage faster.

        If needed the cached files for selected or all plots may be deleted by running the /bin/hedgehogctl
        plotcache_rm_cached_plots script.

RSSAC reports

Data collection
If the required datasets are collected via the DSC collector (see Datasets above), Hedgehog can produce RRSAC reports as described in the
" RSSAC Recommendation on Measurements of the Root Server System - RSSAC 002 " document for the following metrics:

        traffic-volume
        traffic-size
        rcode-volume
        unique-sources

Generating the reports
To produce the RSSAC reports 2 scripts must be run (see the Hedgehog Tools guide for more information):
1. the /bin/hedgehogctl database_process_rssac_data script via the Database tools component
2. the /bin/hedgehogctl rssac_generate_reports script on the Web front-end component that will store and display the
results
The resulting yaml files (along with matching plot files) are stored in the directory listed in the /etc/hedgehog/hedgehog.yaml
file in the directories section for 'rssac' (this path is auto-generated in 2.0 and should not be changed by the user).
The generated files are served by the Hedgehog front end and can be found by clicking on the "RSSAC reports" link at the bottom
left of the Hedgehog webpage.
Note that RSSAC reports can be run for any server, however the name of the server affects the value in the service field of the
generated yaml:
If the server name is of the pattern "*-root" where * is a letter, then the service will be "*.root-servers.org". For all other server
names the service will simply be the server name.
The script can either be run manually, or via a cron job as described in the Maintenance section of the installation guide.
Notes
Some notes on the RSSAC data:
The DSC collector cannot collect extended RCODES and therefore Hedgehog cannot include this information in the rcode_volume
report
As a result of the DSC collector mechanism (i.e collecting data in 1 minute windows) the total quantity of data collected in the
'unique_sources' dataset can be significant and can result in exceptionally large database tables for this dataset. However, this 'raw'
data must be uploaded to the Hedgehog database so that it can be accumulated over the 24 hour report period.
Once the raw data for the entire 24 hours is uploaded, the RSSAC report can be generated to create the summary figures
required in the report and the 'raw' data may be discarded to save disk space (see the Maintanance section of the
Installation guide for details of the script to do this).
The 'Unique sources' plot in the Hedgehog GUI is generated from the summary data, not from the raw data and therefore
the plot cannot be viewed until after the relevant RSSAC report has been generated via the rssac_generate_reports script.
Limitations/Known issues
Users should be aware of several limitations in the current version of Hedgehog as listed below. It is hoped they will be addressed in future
versions
The full list of possible plots are displayed via the drop down menu in the GUI, regardless of whether there is data in the database
for the plot.
There is a known issue with the SVG line plots where long legends are not wrapped properly:
https://code.google.com/p/google-visualization-api-issues/issues/detail?id=1536 . This affects, for example, the 'Traffic volume' plot.
A configuration option is available (default_interactive_plot_type in hedgehog_gui.yaml) which can specify the system to produce
non-SVG line plots that do not have this issue - however these plots require Flash.
The plot is not sorted according to size correctly in the interactive plots for horizontal bar charts. The static plots should be used
instead. This includes:
QTYPE for most popular TLD
Busient client subnet
CODE by client subnet
Root abusers
Query classification by subnet
Server, node and group names may only contain alphanumeric characters and hyphens (-).
The Unique Sources plot is not available until after the RSSAC report has been generated for the date in question.You can also read