Discover the Essential tools in Datastream - Knowledge Network THOMSON REUTERS MARKETS ACADEMY
←
→
Page content transcription
If your browser does not render page correctly, please read the page content below

THOMSON REUTERS MARKETS ACADEMY

Discover the Essential tools in Datastream

Knowledge Network

AIM – you will get to know…
Searching for codes with
using the Datastream
Navigator
Retrieving Data in
Datastream AFO
Retrieving and managing
data efficiently on Excel
Charting capability on
Datastream
Support Tools
2
AGENDA
What is Datastream?
Datastream Navigator
Datastream Advance for Office (Excel Add-in)
- Static Request
- Time Series Request
- Create List
- Request Table
Datastream Charting
Extranet – AFO sample sheets
Knowledge Network training website
3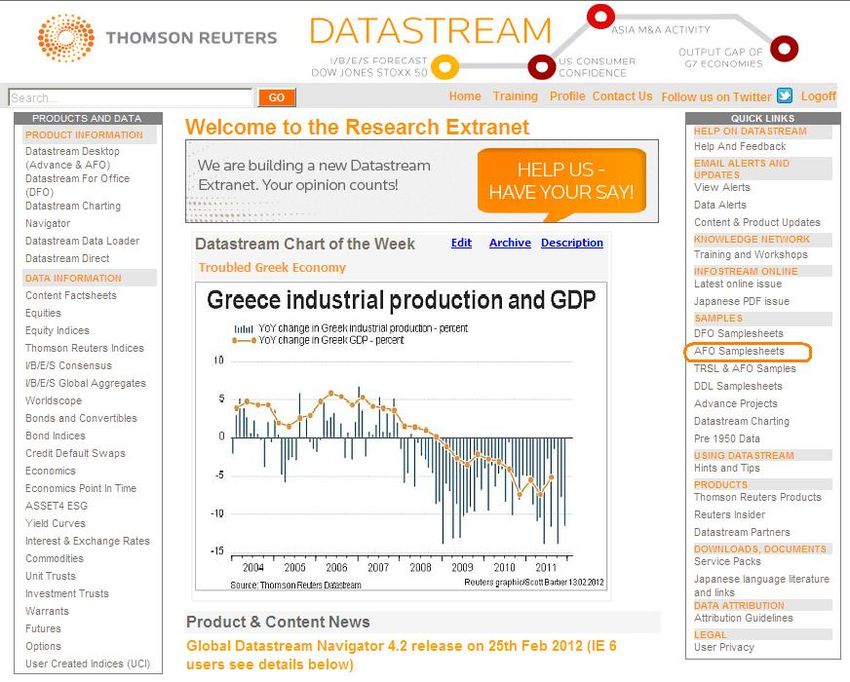
What is Datastream?
•    Data : Financial / Economic Database of
     Global Coverage
    – Historical data since1950’s, over 330 million time series
    – Largest Global Macroeconomic Database
    – Reliable estimates
•    Application : Extended features on desktop &
     MS Office
    – Datastream Advance (Datastream Desktop)
      Easy-to-use, pre-formatted charts and tabular reports
      with flexible charting
    – Advance for Office (AFO)
      Build complex models and reports, data & charts can be
      linked in Excel, PowerPoint or Word to enable to create
      spreadsheets, presentations & documents
                                                                  4
CONTENT COVERAGE - 1
Total number of time series: over 330 • Macro Forecasts- over 400 concepts
million from the OECD and Consensus
Economics. Consumer and
Total number of datatypes: over business confidence surveys and
16,000 expectations from 125 sources.
Total number of instruments / • Economics Point In Time- As
indicators: over 11 million Reported Economics- G7 Markets,
• Economics – over 3 million 10 years history extend to G20
economic time series covering 118 • Equities – 98,500 live equity and
markets from national sources and 220,000 dead with extensive history
international agencies. Histories to the 1960’s
back to 1950’s for G7, 1970’s for
major markets, 1980’s for emerging • I/B/E/S Estimates – analyst forecasts
markets. via 30 measures for some 22,000
active companies and 21,000 dead.
• I/B/E/S Global Aggregates – provide
earnings forecasts on a Market,
Region, Industry and Sector level.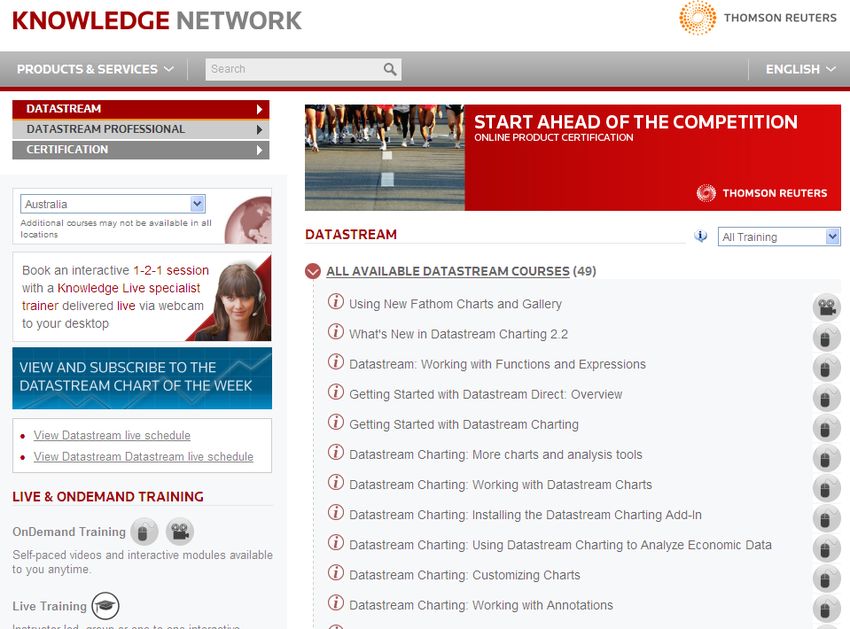
CONTENT COVERAGE - 2
• Fundamentals – Over 1,800 data items; 45,000 active Worldscope companies
  and 25,000 dead.
• Equity indices - 315,000 equity indices series, national sources, MSCI, DJ,
  FTSE, S&P and DS. Index constituents and sector aggregates detail with
  history back to 1960’s.
• Fixed Income Securities (Bonds) - 276,000 active government and corporate
  bond issues across 31 markets. 500,000+ matured and called government
  and corporate bond issues.
• Global Exchange Rates – WMR, Tenfore, GTIS, Tullett Prebon, ECB and
  National Sources
CONTENT COVERAGE - 3
• Commodities and Energy – More than 100,000 series including Platts, Metal
  Bulletin, ICIS and Goldman Sachs.
• Futures- covering 61 regulated exchanges across 36 countries covering
  over 2400 active contracts and over 200,000 series in total.
• Options- coverage of 2,955 active contracts with over 995,000 live series
  and 3.7 million expired series across 25 different countries
• Warrants- coverage consists of 235,000 active series with 1.4 million
  expired series across 28 countries
•    Funds & Trusts- 235,000 funds, including 30,000 UK trusts. Complete
    coverage of UK investment trusts. Lipper integration forthcoming.
• Unique Content- Proprietary Equity & Bond Indices, CDS sector indices,
  Fitch PD series, M&A indices and valuation ratios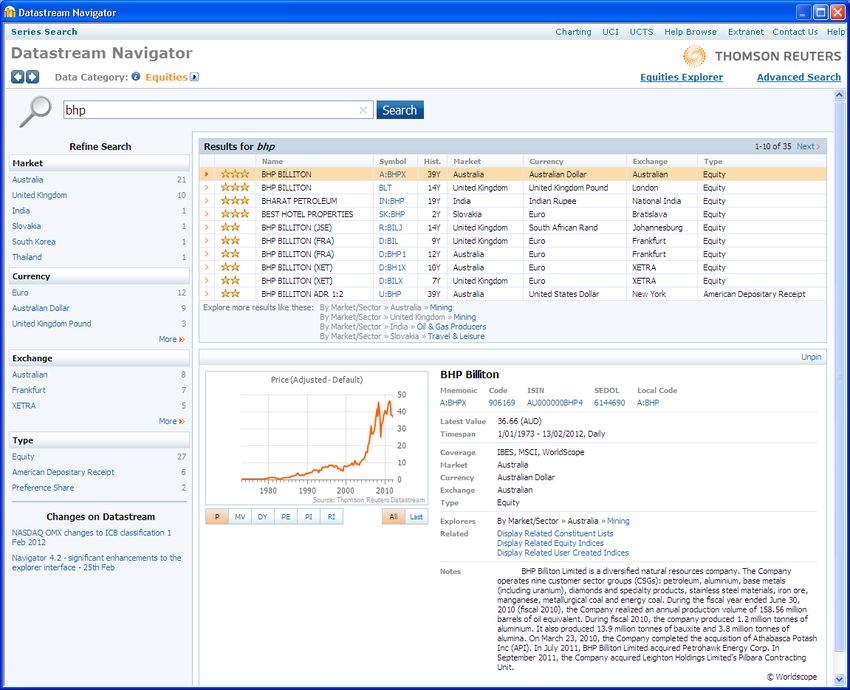
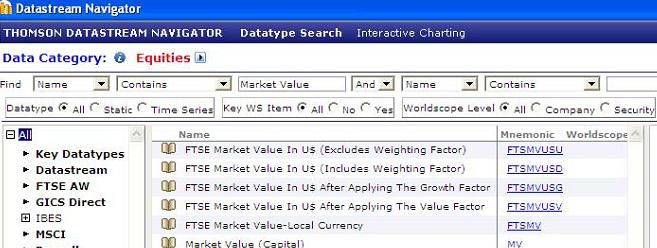
Datastream Navigator

  The Navigator provides different levels of searching enabling to find
  and select series as effectively as possible through the Free Text
  Search, Advanced Search or Explorer.
                                                                          8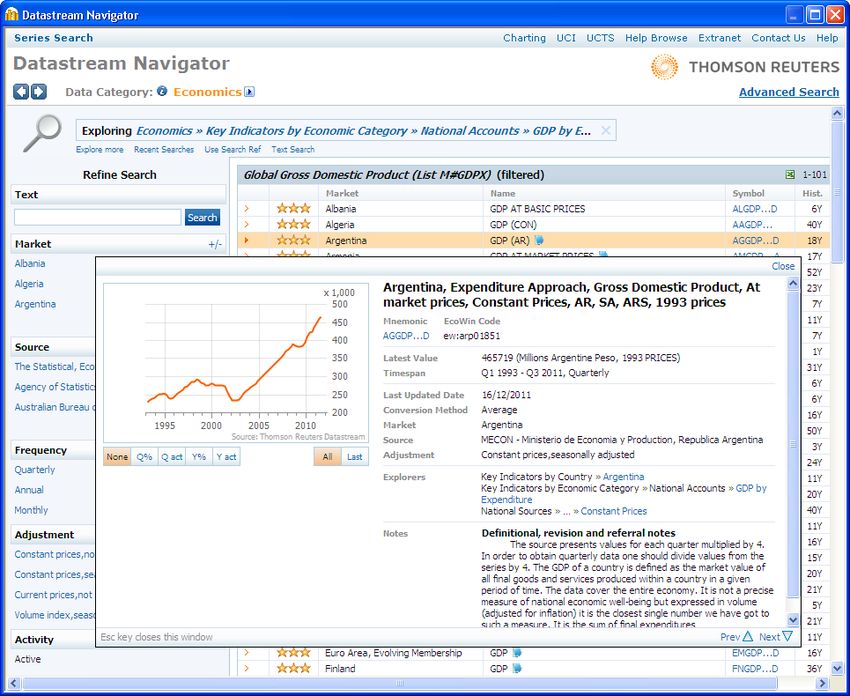
Datastream Navigator – Free Text Search

                                          9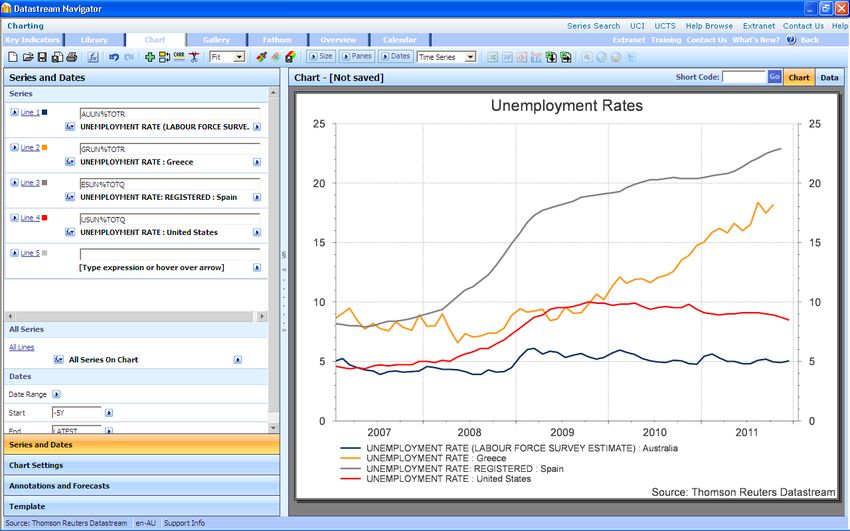
Datastream Navigator - Explorer

                                  10
Datastream Navigator- Metadata Display
11Search Result from Datastream Navigator
Corresponding Codes required to
retrieve data for that company
Tells you if there are
Base Date shows how far back the estimates from IBES
data goes for that company 12Retrieving Data in AFO
Datastream AFO interface
When Datastream is installed you will see in
the menu bar Datastream as an option.
This will give you access to the menu on the
right to access data series where you can
make Static, Time Series and Company
Account Request.
13Retrieving Data in AFO
Static requests: To request data for a specific date.
For example, the price, PE and dividend yield for
stocks for 01/01/05
Time series requests: To request data over a specific period,
defined by a start date, end date, and frequency of data. For
example, the daily price for Pepsico from 01/01/05 to 01/01/06
14Datastream Time Series Request
Click Find Series
to display
Datastream
Navigator, then
select series from
result list to be
displayed in
Series/List field.
Click Datatypes
to display
Datastream
Navigator, then
select series
from result list to
be displayed in
Series/List field.
15Datastream Time Series Request
A Frequency format
option enables you to
define periodicity of the
data required.
Options allow you to format the
results.
Note: Auto Refresh allows the sheet
to be refreshed automatically each
time it is opened.
Embed allow to edit/refresh
data afterward.
16Exercise 1 – Static Request
• List the underlying companies of ASX 200 index
with company names , ISIN and Last (Close) Price.
Hint
• List Code: LASX200I
• Datatypes: NAME,ISIN,P
17Exercise 2 - Time Series Request
• Compare the share price, market capitalisation
(market value) and PE for a list of companies (2
year history) below.
– CBA (Australia)
– NAB (Australia)
– Westpac (Australia)
– HSBC (Hong Kong)
– Standard Chartered (UK)
• Try to convert all data to US dollar
18Exercise 3 - Time Series Request
• Compare the index price (PI) of indices (2 year
history) below.
– ASX 200 (Australia)
– Hang Seng Index (Hong Kong)
– FTSE 100 (UK)
– Nikkei 225 (Japan)
– SP 500 Composite (US)
• Try to change the data for rebasing (=100) as base
date is the start of the data.
19Exercise 4 - Time Series Request
• For the countries below, list 10 year benchmark bond
yield for last year.
– Australia
– US
– Italy
– Germany
– UK
Hint: Find data is in “Economics” or “Interest rates” category in
Navigator
20Exercise 5 - Time Series Request
• For the countries below, list GDP (Actual, Seasonally
Adjusted) since Q1 2005.
– Australia
– US
– Japan
– Italy
– France
– UK
Hint: xxxxx…D indicates Actual, Seasonally Adjusted
21Exercise 6 – Create own request table
• Download BHP’s static & Historical data
Task
• Row 1 – static
• Row 2 - historical
22Exercise 6 – Screen shot
23Tips for Constituent List search in Navigator
24Exercise 7 – Create own request table
• Download static & historical data of my own
Australian material company portfolio.
Task
• Create own portfolio list.
• Open request table
• Download static data for portfolio
• static Data types: ISIN,LOC,SECD,DY,MV,MNEM,NAME,P
and price change for 1M,6M
• Time series Data: P
• Time series data for 5 years monthly basis.
• Time series data Top 10 performer of last 1 month.
25Exercise 7 - Steps
• static – Codes, Name & GICS Sort Materials
• Create your list – Create list (from range)
• Request table
• Row 1 static request – data to sheet1
• Row 2 Time series – data to sheet2
• Row 3 list
• Row 4 Time series
26Exercise 7 - screen shot
27Exercise 8 - Econ data retrieval in Request table
• Create your own Key Australian Economic data
request table
Task
• Request table
• Narrow down Quarterly basis Economic data in Navigator
• Raw data & Q/Q
28Exercise 8 - Screen shot
29Exercise 8 - Screen shot using LIST request
30Exercise 9 - Individual company data
• World scope
• Extranet home – Worldscope - (scroll down to bottom) Guides and other useful Documents
– 4 category
– Sample sheet
• Balance sheet
• Cash flow statement
• Profit and Loss
• Peer Comparison
• IBES data
• Extranet home – I/B/E/S consensus –(scroll down to bottom) Guides and other useful documents
– Estimates
– Aggregate data
31Accessing Datastream Charting
32Datastream Charting page
33Quick access - Key Indicators and Library
34Charting Exercise 1
• Create a chart to compare the unemployment rates
for Australia, Greece, US and Spain for the last 5
years.
35Charting Exercise 2
• Bar chart - library-Datastream-Charting features-Stacked or Static Bar
• Scatter chart - library-Datastream-Charting features- Static or Time series Scatter
• Quick Correlation – Lead & Lag – best fit
• Correlation and expressions
36Datastream Extranet
Datastream Extranet
is a website contains
extensive product
related information
and assist tools such
as prebuilt AFO
samplesheet.
37Knowledge Network
http://training.thomsonreuters.com/
38Datastream Certification -
https://training.thomsonreuters.com/cert/datastream/
39Help & Support
Thomson Reuters Support (Australia)
•Phone: 1800 634 264
•Email: Go to Datastream menu Contact Us
English is supported 24/5
40Thank you for attending !
41You can also read