Iron County, WI - Northwest Regional Planning Commission
←
→
Page content transcription
If your browser does not render page correctly, please read the page content below

Economy Overview

                                      Iron County, WI

                                     Northwest Regional Planning Commission

                                                1400 S. River Street
                                             Spooner, Wisconsin 54801

Emsi Q2 2021 Data Set | www.economicmodeling.com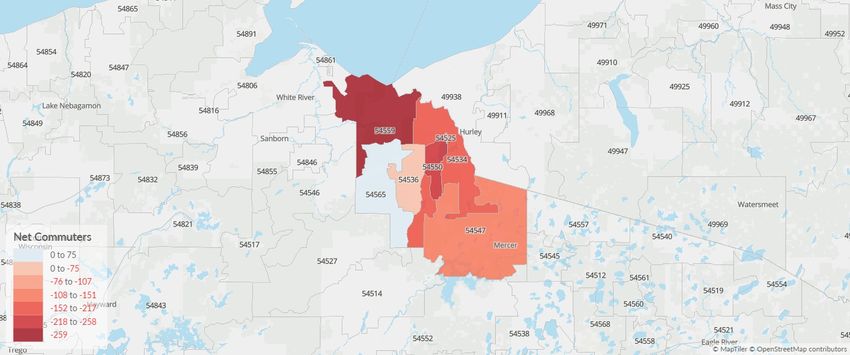
Economy Overview

Contents
 .Report
   . . . . . . Parameters
               . . . . . . . . . . . . . . . . . . . . . . . . . . . . . . . . . . . . . . . . . . . . . . . . . . . . . . . . . . . . . . . . . . . . . . . . . . . . . . . . . . . . . . . . . . . . . . . .1. . . . . . .
.Economy
   . . . . . . . . Overview
                   . . . . . . . . . . . . . . . . . . . . . . . . . . . . . . . . . . . . . . . . . . . . . . . . . . . . . . . . . . . . . . . . . . . . . . . . . . . . . . . . . . . . . . . . . . . . . .2. . . . . . .
.Unemployment
   . . . . . . . . . . . . . . by
                               . . .Demographics
                                     . . . . . . . . . . . . . . . . . . . . . . . . . . . . . . . . . . . . . . . . . . . . . . . . . . . . . . . . . . . . . . . . . . . . . . . . . . . . . . . . . . . . .4. . . . . . .
.Historic
   . . . . . . .&. . Projected
                     . . . . . . . . . .Trends
                                         . . . . . . . . . . . . . . . . . . . . . . . . . . . . . . . . . . . . . . . . . . . . . . . . . . . . . . . . . . . . . . . . . . . . . . . . . . . . . . . . . . .8. . . . . . .
.Popula
   . . . . . . .on
                 . . .Characteris
                       . . . . . . . . . . . cs
                                             . . . . . . . . . . . . . . . . . . . . . . . . . . . . . . . . . . . . . . . . . . . . . . . . . . . . . . . . . . . . . . . . . . . . . . . . . . . . . . . .12
                                                                                                                                                                                                             ........
.Industry
   . . . . . . . .Characteris
                   . . . . . . . . . . .cs
                                         . . . . . . . . . . . . . . . . . . . . . . . . . . . . . . . . . . . . . . . . . . . . . . . . . . . . . . . . . . . . . . . . . . . . . . . . . . . . . . . . . .14
                                                                                                                                                                                                             ........
.Business
   . . . . . . . . Characteris
                   . . . . . . . . . . . .cs
                                           . . . . . . . . . . . . . . . . . . . . . . . . . . . . . . . . . . . . . . . . . . . . . . . . . . . . . . . . . . . . . . . . . . . . . . . . . . . . . . . . .19
                                                                                                                                                                                                             ........
.Workforce
   . . . . . . . . . .Characteris
                       . . . . . . . . . . . cs
                                             . . . . . . . . . . . . . . . . . . . . . . . . . . . . . . . . . . . . . . . . . . . . . . . . . . . . . . . . . . . . . . . . . . . . . . . . . . . . . . . .21
                                                                                                                                                                                                             ........
.Educa
   . . . . . . onal
               . . . . .Pipeline
                         . . . . . . . . . . . . . . . . . . . . . . . . . . . . . . . . . . . . . . . . . . . . . . . . . . . . . . . . . . . . . . . . . . . . . . . . . . . . . . . . . . . . . . . . . .28
                                                                                                                                                                                                             ........
.In-Demand
   . . . . . . . . . . Skills
                       . . . . . . . . . . . . . . . . . . . . . . . . . . . . . . . . . . . . . . . . . . . . . . . . . . . . . . . . . . . . . . . . . . . . . . . . . . . . . . . . . . . . . . . . . . .29
                                                                                                                                                                                                             ........

Emsi Q2 2021 Data Set | www.economicmodeling.com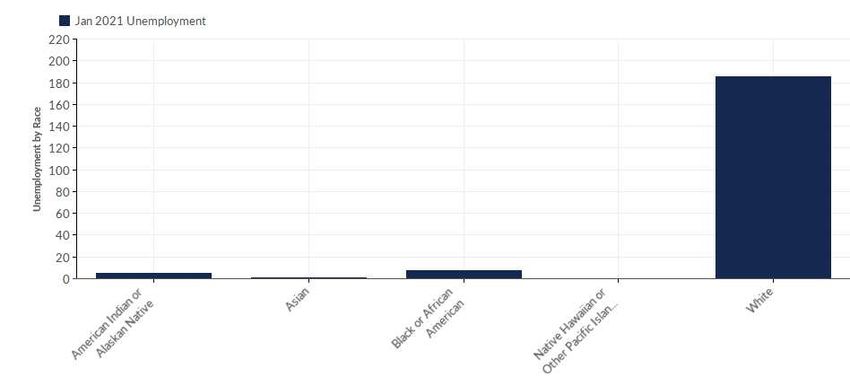
Economy Overview

Report Parameters
1 County

55051     Iron County, WI

Class of Worker
QCEW Employees, Non-QCEW Employees, and Self-Employed

The informa on in this report pertains to the chosen geographical area.

Emsi Q2 2021 Data Set | www.economicmodeling.com                          1
Economy Overview

Economy Overview

               5,706                                       1,833                                        $43.8K
          Popula on (2020)                       Total Regional Employment                  Median Household Income (2019)
    Popula on decreased by 21 over
                                                  Jobs decreased by 78 over the                Median household income is
   the last 5 years and is projected to
                                                 last 5 years but are projected to           $19.0K below the na onal median
     decrease by 0 over the next 5
                                                grow by 83 over the next 5 years.              household income of $62.8K.
                  years.

Takeaways
  As of 2020 the region's popula on declined by 0.4% since 2015, falling by 21. Popula on is expected to remain steady
  between 2020 and 2025.
  From 2015 to 2020, jobs declined by 4.1% in Iron County, WI from 1,911 to 1,833. This change fell short of the na onal
  growth rate of 1.3% by 5.4%. As the number of jobs declined, the labor force par cipa on rate decreased from 53.5% to
  51.9% between 2015 and 2020.
  Concerning educa onal a ainment, 14.8% of Iron County, WI residents possess a Bachelor's Degree (5.3% below the na onal
  average), and 14.7% hold an Associate's Degree (6.1% above the na onal average).

  The top three industries in 2020 are Local Government, Excluding Educa on and Hospitals, Educa on and Hospitals (Local
  Government), and Nursing Care Facili es (Skilled Nursing Facili es).

                                                      Labor                        Cost
                                 Popula on            Force                          of
                                    (2020)           (2020)     Jobs (2020)      Living           GRP      Imports     Exports

 Region                               5,706           2,602              1,833   102.0       $165.64M    $319.58M    $172.08M

 NWRPC                             175,719          87,306           72,838          99.2      $6.87B     $11.80B      $9.92B

 State                           5,848,151       3,094,138       3,074,986       100.0       $331.57B    $322.64B    $342.03B

 Na on                        330,591,441     159,976,949      160,385,413       100.0        $20.70T          $0       $9.99T

Emsi Q2 2021 Data Set | www.economicmodeling.com                                                                                 2
Economy Overview
2020 Labor Force Breakdown
Popula on
A Total Working Age Popula on 5,016
A Not in Labor Force (15+) 2,414
A Labor Force 2,602
5,706 A Employed 2,341
Popula on
A Unemployed 261
A Under 15 690
Educa onal A ainment
Concerning educa onal a ainment, 14.8% of Iron County, WI residents possess a Bachelor's Degree (5.3% below the na onal
average), and 14.7% hold an Associate's Degree (6.1% above the na onal average).
% of Popula on Popula on
A Less Than 9th Grade 0.8% 35
A 9th Grade to 12th Grade 4.7% 213
A High School Diploma 32.1% 1,464
A Some College 27.4% 1,251
A Associate's Degree 14.7% 671
A Bachelor's Degree 14.8% 673
A Graduate Degree and Higher 5.6% 254
Emsi Q2 2021 Data Set | www.economicmodeling.com 3Economy Overview
Unemployment by Demographics
Unemployment by Age
Unemployment % of Age
Age (Jan 2021) Cohort
< 22 6 3.03%
22-24 9 4.55%
25-34 37 18.69%
35-44 41 20.71%
45-54 40 20.20%
55-59 25 12.63%
60-64 22 11.11%
65+ 19 9.60%
Total 198 101.00%
Emsi Q2 2021 Data Set | www.economicmodeling.com 4Economy Overview
Unemployment by Gender
Unemployment % of Age
Gender (Jan 2021) Cohort
Females 78 39.39%
Males 120 60.61%
Total 198 100.00%
Emsi Q2 2021 Data Set | www.economicmodeling.com 5Economy Overview
Unemployment by Race
Unemployment % of Age
Race (Jan 2021) Cohort
American Indian or Alaskan Na ve 5 2.53%
Asian 1 0.51%
Black or African American 7 3.54%
Na ve Hawaiian or Other Pacific Islander 0 0.00%
White 185 93.43%
Total 198 100.00%
Emsi Q2 2021 Data Set | www.economicmodeling.com 6Economy Overview
Unemployment by Ethnicity
Unemployment % of Age
Ethnicity (Jan 2021) Cohort
Hispanic or La no 4 2.02%
Not Hispanic or La no 194 97.98%
Total 198 100.00%
Emsi Q2 2021 Data Set | www.economicmodeling.com 7Economy Overview Historic & Projected Trends Popula on Trends As of 2020 the region's popula on declined by 0.4% since 2015, falling by 21. Popula on is expected to remain steady between 2020 and 2025. Timeframe Popula on 2015 5,727 2016 5,660 2017 5,675 2018 5,687 2019 5,687 2020 5,706 2021 5,717 2022 5,722 2023 5,721 2024 5,713 2025 5,706 Emsi Q2 2021 Data Set | www.economicmodeling.com 8
Economy Overview

Job Trends
From 2015 to 2020, jobs declined by 4.1% in Iron County, WI from 1,911 to 1,833. This change fell short of the na onal growth
rate of 1.3% by 5.4%.

 Timeframe                                                                                                               Jobs

 2015                                                                                                                   1,911

 2016                                                                                                                   1,962

 2017                                                                                                                   1,942

 2018                                                                                                                   1,903

 2019                                                                                                                   1,913

 2020                                                                                                                   1,833

 2021                                                                                                                   1,855

 2022                                                                                                                   1,874

 2023                                                                                                                   1,891

 2024                                                                                                                   1,905

 2025                                                                                                                   1,915

Emsi Q2 2021 Data Set | www.economicmodeling.com                                                                                9
Economy Overview

Labor Force Par cipa on Rate Trends

 Timeframe                                         Labor Force Par cipa on Rate

 2016                                                                  53.44%

 2017                                                                  52.44%

 2018                                                                  51.63%

 2019                                                                  50.85%

 January - October 2020                                                51.93%

 November 2020                                                         51.36%

 December 2020                                                         51.88%

 January 2021                                                          50.30%

Emsi Q2 2021 Data Set | www.economicmodeling.com                                  10
Economy Overview

Unemployment Rate Trends

Iron County, WI had a January 2021 unemployment rate of 7.83%, increasing from 7.42% 5 years before.

 Timeframe                                                                                             Unemployment Rate

 2016                                                                                                             7.42%

 2017                                                                                                             6.19%

 2018                                                                                                             5.81%

 2019                                                                                                             6.05%

 January - October 2020                                                                                          11.86%

 November 2020                                                                                                    8.42%

 December 2020                                                                                                   10.03%

 January 2021                                                                                                     7.83%

Emsi Q2 2021 Data Set | www.economicmodeling.com                                                                           11
Economy Overview

Popula on Characteris cs

                  711                              2,897                                   282
             Millennials                        Re ring Soon                         Racial Diversity

Iron County, WI has 711              Re rement risk is high in Iron        Racial diversity is low in Iron
millennials (ages 25-39). The        County, WI. The na onal average       County, WI. The na onal average
na onal average for an area this     for an area this size is 1,672        for an area this size is 2,268
size is 1,173.                       people 55 or older, while there are   racially diverse people, while there
                                     2,897 here.                           are 282 here.

                  581                           1.23/1,000                            8.62/1,000
                 Veterans                       Violent Crime                        Property Crime

Iron County, WI has 581 veterans.    Iron County, WI has 1.23 violent      Iron County, WI has 8.62 property
The na onal average for an area      crimes per 1,000 people. The          crimes per 1,000 people. The
this size is 316.                    na onal rate is 3.53 per 1,000        na onal rate is 19.79 per 1,000
                                     people.                               people.

Emsi Q2 2021 Data Set | www.economicmodeling.com                                                                  12
Economy Overview
Place of Work vs Place of Residence
Understanding where talent in Iron County, WI currently works compared to where talent lives can help you op mize site
decisions.
Where Talent Works Where Talent Lives
2020 2020
ZIP Name Employment ZIP Name Workers
54534 Hurley, WI (in Iron county)
… 1,170 54534 Hurley, WI (in Iron county)
… 1,322
54547 Mercer, WI (in Iron county)
… 454 54547 Mercer, WI (in Iron county)
… 562
54559 Saxon, WI (in Iron county)
… 59 54559 Saxon, WI (in Iron county)
… 318
54536 Iron Belt, WI (in Iron county)
… 53 54550 Montreal, WI (in Iron county)
… 252
54550 Montreal, WI (in Iron county)
… 34 54525 Gile, WI (in Iron county) 105
Emsi Q2 2021 Data Set | www.economicmodeling.com 13Economy Overview
Industry Characteris cs
Largest Industries
Industry Jobs Na onal Average
Government
Health Care and Social Assistance
Construc on
Accommoda on and Food Services
Retail Trade
Manufacturing
Wholesale Trade
Professional, Scien fic, and Technical Services
ve and Support and Waste Management and Remedia on Services
Arts, Entertainment, and Recrea on
Finance and Insurance
Other Services (except Public Administra on)
Real Estate and Rental and Leasing
Agriculture, Forestry, Fishing and Hun ng
Transporta on and Warehousing
0 50 100 150 200 250 300
Emsi Q2 2021 Data Set | www.economicmodeling.com 14Economy Overview
Top Growing Industries
Industry Jobs Growth
Health Care and Social Assistance
Construc on
Administra ve and Support and Waste Management and
Remedia on Services
Arts, Entertainment, and Recrea on
Wholesale Trade
Professional, Scien fic, and Technical Services
Finance and Insurance
0 10 20 30 40
Top Industry LQ
Industry LQ
Construc on
Accommoda on and Food Services
Arts, Entertainment, and Recrea on
Manufacturing
Health Care and Social Assistance
Government
Agriculture, Forestry, Fishing and Hun ng
Retail Trade
Wholesale Trade
Real Estate and Rental and Leasing
Finance and Insurance
Professional, Scien fic, and Technical Services
Transporta on and Warehousing
Administra ve and Support and Waste Management and
Remedia on Services
Other Services (except Public Administra on)
0.00 1.00 2.00
Emsi Q2 2021 Data Set | www.economicmodeling.com 15Economy Overview
Top Industry GRP
2020 Gross Regional Product
Government
Construc on
Manufacturing
Health Care and Social Assistance
Wholesale Trade
Retail Trade
Accommoda on and Food Services
Arts, Entertainment, and Recrea on
Finance and Insurance
Agriculture, Forestry, Fishing and Hun ng
Real Estate and Rental and Leasing
Transporta on and Warehousing
Professional, Scien fic, and Technical Services
Other Services (except Public Administra on)
Administra ve and Support and Waste Management and
Remedia on Services
$0.000 $5.000M $10.00M $15.00M $20.00M
Emsi Q2 2021 Data Set | www.economicmodeling.com 16Economy Overview
Top Industry Earnings
2020 Earnings Per Worker
Transporta on and Warehousing
Arts, Entertainment, and Recrea on
Government
Finance and Insurance
Construc on
Professional, Scien fic, and Technical Services
Manufacturing
Agriculture, Forestry, Fishing and Hun ng
Wholesale Trade
Real Estate and Rental and Leasing
Health Care and Social Assistance
Administra ve and Support and Waste Management and
Remedia on Services
Retail Trade
Other Services (except Public Administra on)
Accommoda on and Food Services
$0 $20,000 $40,000 $60,000
Emsi Q2 2021 Data Set | www.economicmodeling.com 17Economy Overview
Largest Industries
Industry Jobs Na onal Average
Government
Health Care and Social Assistance
Construc on
Accommoda on and Food Services
Retail Trade
Manufacturing
Wholesale Trade
Professional, Scien fic, and Technical Services
ve and Support and Waste Management and Remedia on Services
Arts, Entertainment, and Recrea on
Finance and Insurance
Other Services (except Public Administra on)
Real Estate and Rental and Leasing
Agriculture, Forestry, Fishing and Hun ng
Transporta on and Warehousing
0 50 100 150 200 250 300
Emsi Q2 2021 Data Set | www.economicmodeling.com 18Economy Overview
Business Characteris cs
295 Companies Employ Your Workers
Online profiles for your workers men on 295 companies as employers, with the top 10 appearing below. In the last 12 months,
665 companies in Iron County, WI posted job pos ngs, with the top 10 appearing below.
Top Companies Profiles Top Companies Pos ng Unique Pos ngs
Hurley School District 12 Axelon Services Corpora on 132
Aspirus Wausau Hospital, Inc. 7 Allegis Group, Inc. 88
Avan Hospitals, LLC 5 Bank of Montreal 50
Mantas Educa onal Consul ng 5 U.S. Xpress, Inc. 48
Gogebic Community College 4 The Home Depot 40
Hurley School 4 Automa c Data Processing, Inc.…(ADP) 38
Mercer School District 4 Uber Technologies, Inc. 35
State of Wisconsin 4 C.R. England, Inc. 30
Burton Industries, Inc. 3 Marten Transport, Ltd. 29
Extreme Tool and Engineering, Inc.
… 3 Pla num Supplemental Insurance,
… Inc. 26
Emsi Q2 2021 Data Set | www.economicmodeling.com 19Economy Overview
Business Size
Percentage Business Count
A 1 to 4 employees 32.4% 117
A 5 to 9 employees 28.8% 104
A 10 to 19 employees 22.7% 82
A 20 to 49 employees 12.2% 44
A 50 to 99 employees 2.2% 8
A 100 to 249 employees 1.7% 6
*Business Data by DatabaseUSA.com is third-party data provided by Emsi to its customers as a convenience, and Emsi does not endorse or warrant its
accuracy or consistency with other published Emsi data. In most cases, the Business Count will not match total companies with profiles on the summary
tab.
Emsi Q2 2021 Data Set | www.economicmodeling.com 20Economy Overview
Workforce Characteris cs
Largest Occupa ons
Occupa on Jobs Na onal Average
Office and Administra ve Support
Sales and Related
Food Prepara on and Serving Related
Construc on and Extrac on
Transporta on and Material Moving
Produc on
Healthcare Support
Educa onal Instruc on and Library
Management
Building and Grounds Cleaning and Maintenance
Installa on, Maintenance, and Repair
Healthcare Prac oners and Technical
Business and Financial Opera ons
Personal Care and Service
Community and Social Service
Protec ve Service
Farming, Fishing, and Forestry
Arts, Design, Entertainment, Sports, and Media
Life, Physical, and Social Science
Legal
0 50 100 150 200
Emsi Q2 2021 Data Set | www.economicmodeling.com 21Economy Overview
Top Growing Occupa ons
Occupa on Jobs Growth
Healthcare Support
Business and Financial Opera ons
Community and Social Service
Management
Personal Care and Service
Life, Physical, and Social Science
Legal
Building and Grounds Cleaning and Maintenance
Transporta on and Material Moving
Protec ve Service
Construc on and Extrac on
0 5 10 15 20 25
Emsi Q2 2021 Data Set | www.economicmodeling.com 22Economy Overview
Top Occupa on LQ
Occupa on LQ
Construc on and Extrac on
Farming, Fishing, and Forestry
Healthcare Support
Food Prepara on and Serving Related
Produc on
Community and Social Service
Building and Grounds Cleaning and Maintenance
Sales and Related
Installa on, Maintenance, and Repair
Transporta on and Material Moving
Personal Care and Service
Legal
Protec ve Service
Educa onal Instruc on and Library
Life, Physical, and Social Science
Management
Office and Administra ve Support
Healthcare Prac oners and Technical
Arts, Design, Entertainment, Sports, and Media
Business and Financial Opera ons
0.00 1.00 2.00
Emsi Q2 2021 Data Set | www.economicmodeling.com 23Economy Overview
Top Occupa on Earnings
2020 Median Hourly Earnings
Management
Healthcare Prac oners and Technical
Legal
Life, Physical, and Social Science
Business and Financial Opera ons
Educa onal Instruc on and Library
Construc on and Extrac on
Protec ve Service
Installa on, Maintenance, and Repair
Community and Social Service
Arts, Design, Entertainment, Sports, and Media
Produc on
Office and Administra ve Support
Transporta on and Material Moving
Building and Grounds Cleaning and Maintenance
Farming, Fishing, and Forestry
Healthcare Support
Sales and Related
Personal Care and Service
Food Prepara on and Serving Related
$0.00 $5.00 $10.00 $15.00 $20.00 $25.00 $30.00
Emsi Q2 2021 Data Set | www.economicmodeling.com 24Economy Overview
Top Posted Occupa ons
Unique Average Monthly Pos ngs
Computer and Mathema cal
Transporta on and Material Moving
Management
Sales and Related
Office and Administra ve Support
Business and Financial Opera ons
Arts, Design, Entertainment, Sports, and Media
Architecture and Engineering
Healthcare Prac oners and Technical
Produc on
Installa on, Maintenance, and Repair
Food Prepara on and Serving Related
Healthcare Support
Educa onal Instruc on and Library
Community and Social Service
Personal Care and Service
Construc on and Extrac on
Legal
Life, Physical, and Social Science
Building and Grounds Cleaning and Maintenance
Protec ve Service
0 20 40 60 80 100 120
Emsi Q2 2021 Data Set | www.economicmodeling.com 25Economy Overview
Underemployment
Jobs Requiring Ed. Level Popula on at Ed. Level
No Formal Educa on Required
High School Diploma or Equivalent
Some College, Non-Degree Award
Associate's Degree
Bachelor's Degree
Graduate Degree and Higher
0% 10% 20% 30% 40%
Emsi Q2 2021 Data Set | www.economicmodeling.com 26Economy Overview
Largest Occupa ons
Occupa on Jobs Na onal Average
Office and Administra ve Support
Sales and Related
Food Prepara on and Serving Related
Construc on and Extrac on
Transporta on and Material Moving
Produc on
Healthcare Support
Educa onal Instruc on and Library
Management
Building and Grounds Cleaning and Maintenance
Installa on, Maintenance, and Repair
Healthcare Prac oners and Technical
Business and Financial Opera ons
Personal Care and Service
Community and Social Service
Protec ve Service
Farming, Fishing, and Forestry
Arts, Design, Entertainment, Sports, and Media
Life, Physical, and Social Science
Legal
0 50 100 150 200
Emsi Q2 2021 Data Set | www.economicmodeling.com 27Economy Overview Educa onal Pipeline Over the last 5 years, no schools in Iron County, WI produced graduates. Emsi Q2 2021 Data Set | www.economicmodeling.com 28
Economy Overview

In-Demand Skills
                                            Top Hard Skills   Na onal Average

                         Bilingual (French/English)

                              Agile Methodology

                          Flatbed Truck Opera on

                   Python (Programming Language)

                     Java (Programming Language)

                                          Audi ng

                     SQL (Programming Language)

                Customer Rela onship Management

                                             Linux

                                   Merchandising

                                                      0       100               200   300   400

Emsi Q2 2021 Data Set | www.economicmodeling.com                                                  29
You can also read