SDI and a scientific approach - MSDI Open Forum, KMS/GST François Anton and Darka Mioc
←
→
Page content transcription
If your browser does not render page correctly, please read the page content below
SDI and
a scientific approach
     François Anton and Darka Mioc
          Division of Geodesy
         National Space Institute
     Technical University of Denmark

MSDI Open Forum, KMS/GST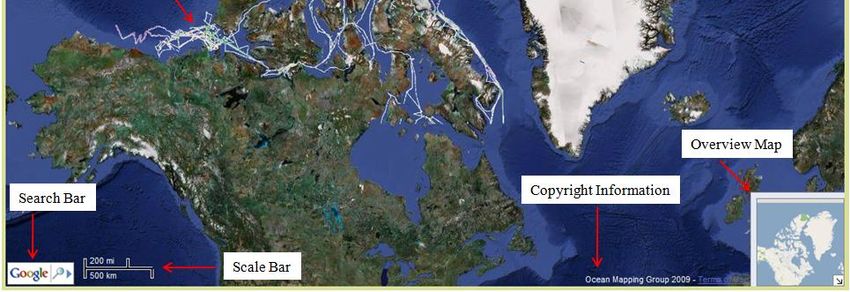
Summary
Introduction
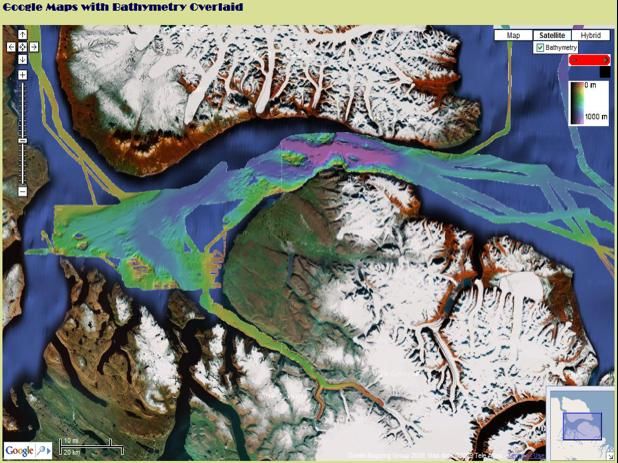
Arctic Basemaps in Google Maps
Three Dimensional Modelling of Ocean
Temperature Data
Homotopy based 3D/4D reconstruction of water
columns from acoustic data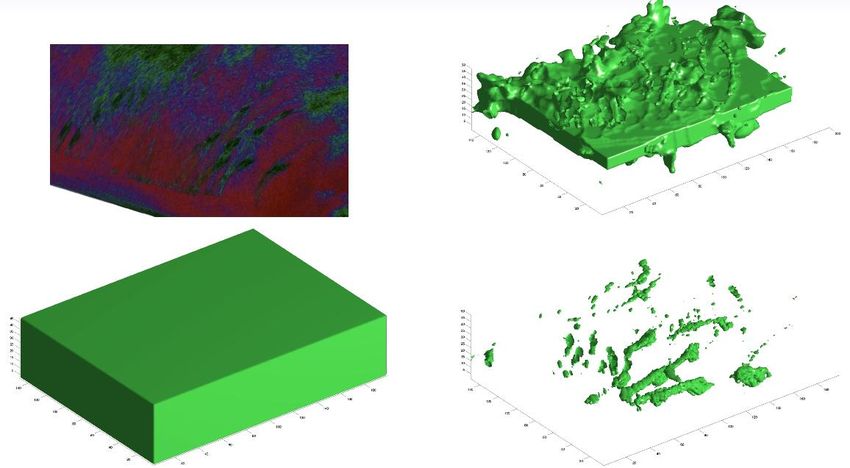
Introduction
All marine data acquisition techniques are very affected by noise.
Noise removal functions need to be applied.
All images can then be processed for feature detection / reconstruction
by applying either implicit functions (e.g. marching cubes or soft cells) or
homotopies (continuous deformation functions).
Any marine SDI needs to handle both raster data, vector data, topological
information and functions (filtering functions, implicit functions,
homotopies, information extraction functions, information rendering
functions, etc.).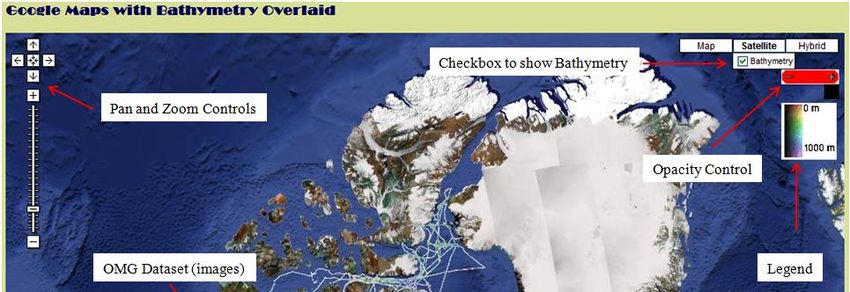
Arctic Basemaps in Google Maps
James Muggah, UNB, Department of Geodesy and Geomatics Engineering
and Darka Mioc, DTU, National Space Institute
The Ocean Mapping Group (OMG)
and their role in ArcticNet.
ArcticNet is a funded program that
brings together scientists and
managers from a number of
different backgrounds to study the
effects of global climate change in
the Arctic.
OMG's role is to map the sea floor
topography and geological structure
of the Canadian Arctic Archipelago.
This is the first step towards the
management of increased
intercontinental ship traffic and Arctic Data
resource exploration as ice
conditions improve.
OMG has been collecting data in the Arctic since 2003.
The OMG will continue to build up Approximately 2,000 basemaps.
coverage with each transit through
the NW passage. In the current online storage format used by the OMG, it is difficult to
view the data and users cannot easily pan and zoom.
Demo - http://www.omg.unb.ca/Projects/Arctic/basemaps/index.html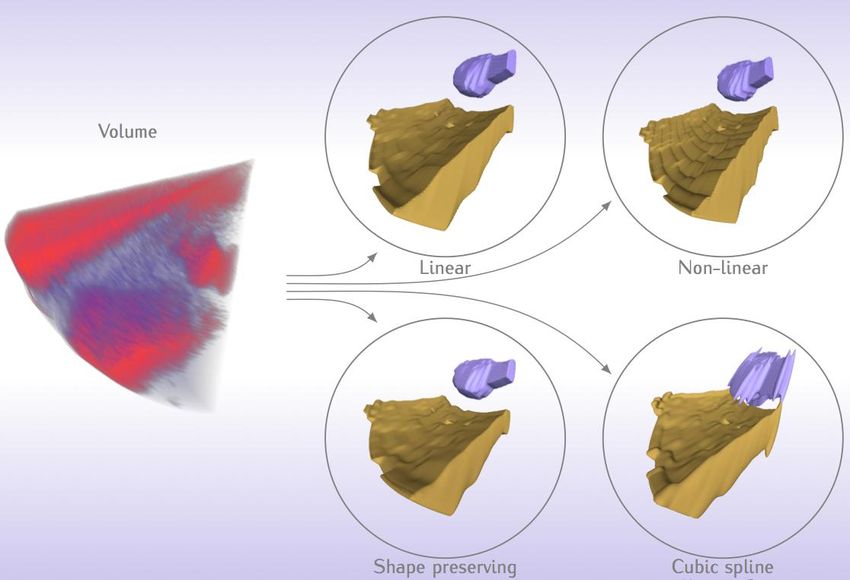
Objectives
The purpose of this project is to use a
freely available program (Google Maps),
to display the OMG's Arctic data.
The maps will be available to all users on
the web.
Users will be able to pan and zoom as
they choose.
The map will load the large dataset in a
reasonable time.
Future work to add more functionality to
the website.
Google Maps Add-ons
Google Maps application is created using Javascript which is embeded into html code. After the map is
embeded into website, users can add some controls such as:
Set the centre of the map, and zoom level
Set the map type (satellite, streets or terrain)
Add zoom, and pan controls as well as an overview map
Many more controls, options and customization can be created using Javascript.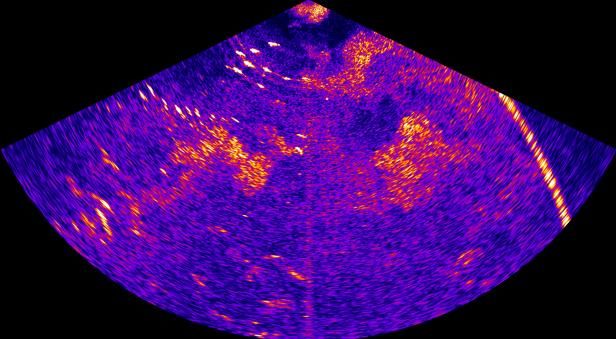
Data preparation
The images were created using Linux software written by the OMG.
With the help of Ian Church from the Ocean Mapping Group, a step-by-step process was used to create
images from the multibeam data collected by the OMG in the Arctic.
The website was also created
using Linux software.
The projection needed to be
changed from Lambert Conformal
Conic (useful at higher Latitudes)
to Mercator (used by Google
Maps).
The data needed to have a
common colour scheme.
The data needed to be properly
georeferenced.
The background of the images
needed to be transparent.
The image bounds were
determined (Lat/Long) for
georeferencing.
Code was written to add the
images to Google Maps.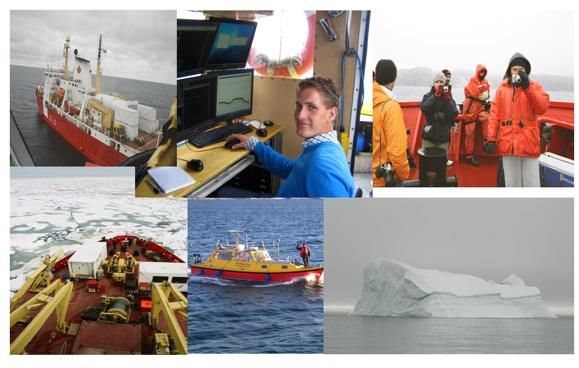
Overlays
For this project ground overlays were
used to display the OMG's data in a
test area around Pond Inlet.
After creating and testing this website,
it was determined that the high
resolution images (10m) were loading
too slow and the ground overlay
method would not be useful for
displaying the entire dataset.
Tile overlays are useful for large
datasets because they cut the image
into many different tiles, and load only
the part of the image (tile) within the
map bounds.
Tile overlays can be challenging to
implement but are extremely efficient.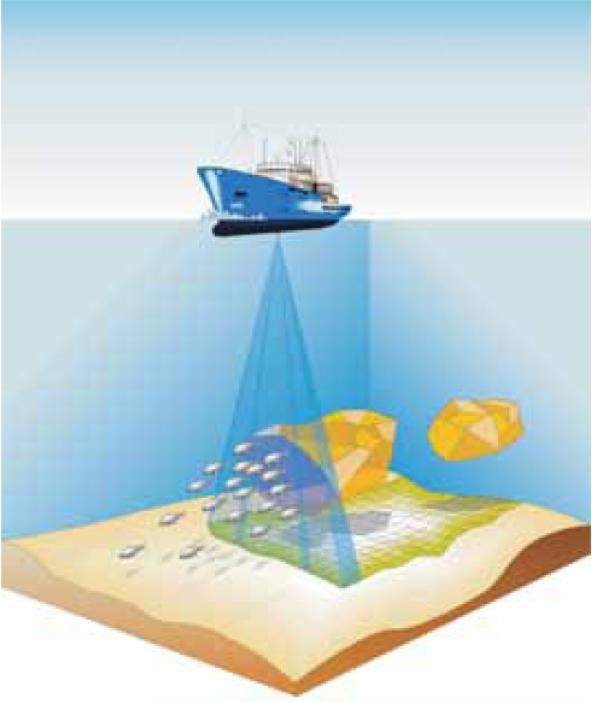
Tile Overlays
The next step was to create a tile overlay.
Google requires tiles to be 256x256 pixels,
and different images for every zoom level.
A pyramid format is used when creating
the tiles. At zoom level zero one tile
represents the whole world at each
subsequent zoom level, each tile is
divided into 4.
To create the tiles, one image of the test
area was created, and a tile cutter
(MapCruncher) was used to cut the image
into 256x256 tiles for 14 zoom levels.
The website was created with these tiles
and after testing, it was determined that
the tile overlay would be suitable for
displaying the entire dataset.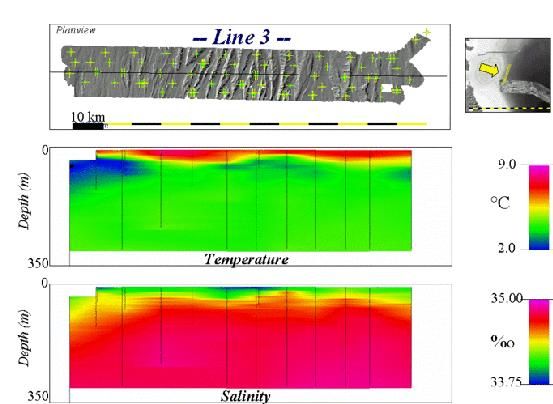
Three Dimensional Modelling of Ocean
         Temperature Data

                       The     Moving     Vessel
                       Profiler (MVP) is a multi-
                       purpose instrument for
                       aiding in the collection of
                       both shallow and deep-
                       water data sets.
                       The     MVP      primary
                       function is to allow
                       accurate data collection
                       without the need to
                       stop the vessel.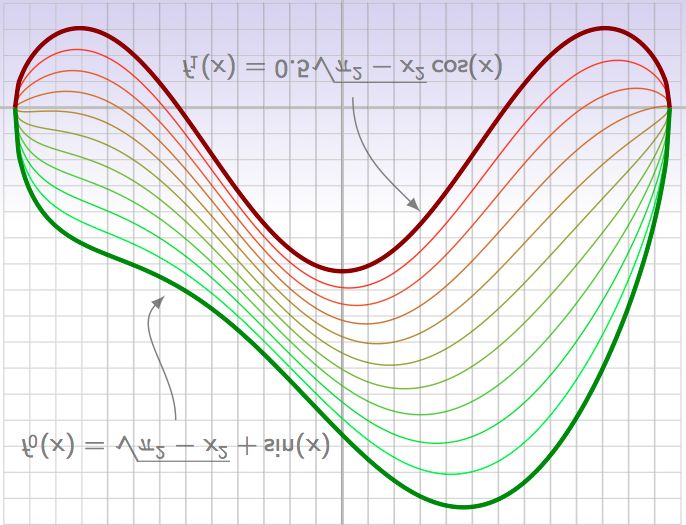
Moving Vessel Profiler

                    The figures above shows
                    the MVP™ deployed from a
                    typical vessel

                    The sequence of events
                    for a typical cast is:
                    1.Deployment
                    2. Freefall
                    3. Maximum depth
                    4. Retrieval
Experiments with Moving Vessel Profiler
Temperature and depth
The project implementation involves the following major stages:

1.   Data collection (Data are obtained from Dr. John E. Hughes Clarke      and Jonathan
     Beaudoin from the Ocean Mapping Group, University of New Brunswick).

2.   Data extraction and manipulations.

3.   Using DOUGLAS PEUCKER algorithm to refine the data.

4.   Load the Data to GRASS system.

5.   Interpolate the vector Data using GRASS to get G3D.

     1.     Exports G3D grids to V5D format (VIS5D).

     2.     View and Visualize G3D map using Vis5D application
            program.
Curve Simplification
After applying
Before applying
Douglas Peucker
Douglas Peucker Algorithm
Algorithm
The number of points (initially was 121745) has been reduced to 304
Tolerance 0.2 degrees Celsius
Temp
DepthInterpolation Stage
1. Load the data after refining and extracting to GRASS system.
2. Interpolate the Data using GRASS to produce 3 Dimensional model of
water column (Interpolates point data to a G3D grid volume using
regularised spline with tension algorithm).
3. Interpolates values to a 3-dimensional grid from 3- dimensional point
data.
4. Exports G3D grids to v5d format (VIS5D).
VIS5D is a system for interactive visualization of large 5-D
gridded data sets weather models.
With Vis5D one can :
Make iso-surfaces, contour line slices, colored slices, volume
renderings of data in a 3-D grid.
Rotate and animate the images in real time.3D Modelling and visualisation
Viewing the 3D ocean
data using
Vis5D.
The example shows
Latitudes,
Longitudes,
Depth and
Temperature.
Volume is shown
before filtering
(using Douglas
Peucker
Algorithm).3D Modelling and visualisation
Viewing the 3D ocean
data using
Vis5D.
The example shows
Latitudes,
Longitudes,
Depth and
Temperature.
Volume is shown
after filtering
(using
DouglasPeucker
Algorithm).Homotopy based 3D/4D reconstruction of
water columns from acoustic data
Ojaswa Sharma, François AntonAcoustic waves reconstruction
Multibeam echo sounder image
Deforming Level Sets
  Noise Reduction
Deforming Level Sets
   Reconstruction
Homotopies
Homotopies based Reconstruction
Homotopies based Reconstruction
Conclusions
A marine SDI can be constructed using the
parallelism in the CPU and the GPU and a
functional database management system
that unifies the storage of data and
processing as functions.
Processing techniques need to consider
data locally.You can also read