Consumer Insights and Intent - Q1 - OOH Opportunities February 10, 2021

Page created by Sara Love
 
CONTINUE READING
Consumer Insights and Intent - Q1 - OOH Opportunities February 10, 2021
Consumer Insights and Intent - Q1
         OOH Opportunities
             February 10, 2021

Harris Insights & Analytics LLC, A Stagwell Company © 2018
OAAA: CONSUMER BEHAVIOR

Table of Contents & Methodology

       Key Takeaways                                         p.3

                                                                    Dates                       January 15th to 20th, 2021
       Part 1:
                                                             p.4
       Q1 Mobility & The Opportunity for Out of Home
                                                                    Survey Length               11 minutes
       Part 2:
                                                             p.15
       OOH Messaging Amid COVID
                                                                    Method                      Online
       Part 3:
                                                             p.20
       Digital Transformation Implications for OOH
                                                                    Audience                    General Public (n=1,000)
       Implications & Recommendations                        p.27
                                                                    Data is weighted to reflect the U.S. general public across age, gender,
                                                                    race/ethnicity, region, income, household size, and employment.

                                                                                                                                              2
Harris Insights & Analytics LLC, A Stagwell Company © 2020
OAAA: CONSUMER BEHAVIOR

Key Takeaways
                    The Future Commute: Looking ahead to the next few months, over 70% of workers will be commuting at least part-time, over 4 in 10

    •               workers (45%) will be commuting everyday, while the other half will either be working from home (28%) or a mix of commuting and WFH
                    (26%). There is an income gap in everyday commuters: 57% of households with income
PART 1: MEETING CONSUMERS WHERE THEY ARE

                                      Q1 Mobility & The Opportunity for
                                                Out of Home

                                                                                                        4
Harris Insights & Analytics, A Stagwell LLC Company © 2020
OAAA Q1 CONSUMER TRENDS FOR OOH

Looking Ahead to the Next Few Months, Nearly Three-Quarters of Workers
Will Be Commuting at Least Part Time
                                       Looking ahead to these next few months during
                                       the COVID-19 pandemic, which of the following
                                                                                                                                                   % Commuting Every Day or Mix
                                            best describes your work situation?
                                                                                                                                             < $50k                               76%
                                                                                                                                            $50-99k                           72%
                                                                                               72% Commuting                             $100-$150k                          72%
                                                                                               at least part time                            $150k+                        66%
                   I wll be commuting to                              45%
                   my job every day                                                                                                           Gen Z                               74%
                                                                                                                                          Millennial                          73%
                   I will be doing a mix of
                   commuting and                                                                                                              Gen X                          71%
                   working from home                                                                                                       Boomer+                            73%
                   I will be working from                             26%
                   home all of the time                                                                                                       West                            72%
                                                                                                                                      Mountain/Great…                      67%
                                                                                                                                            Midwest                         68%
                                                                      28%                                                                 Northeast                         69%
                                                                                                                                              South                               76%
                                                                                                                                        Mid-Atlantic                             73%

BASE: EMPLOYED (546)
Q1. Looking ahead to these next few months during the COVID-19 pandemic, which of the following best describes your work situation?
                                                                                                                                                                                        5
Harris Insights & Analytics LLC, A Stagwell Company © 2020
OAAA Q1 CONSUMER TRENDS FOR OOH

Over 4 in 10 Workers Will Be Commuting Everyday, With Notable Variances
by Income and Geographic Region
                                       Looking ahead to these next few months during
                                       the COVID-19 pandemic, which of the following                                                                    % Commuting Everyday
                                            best describes your work situation?
                                                                                                                                                    < $50k                                 57%
                                                                                                                                                   $50-99k                       48%
                                                                                                                                                $100-$150k                     41%
                                                                                                                                                    $150k+               34%
                   I wll be commuting to                              45%
                   my job every day                                                                                                                  Gen Z                      44%
                                                                                                                                                 Millennial                     44%
                   I will be doing a mix of
                   commuting and                                                                                                                     Gen X                       46%
                   working from home                                                                                                              Boomer+                        48%
                   I will be working from                             26%
                   home all of the time                                                                                                               West                36%
                                                                                                                                      Mountain/Great Plains                      48%
                                                                                                                                                   Midwest                           49%
                                                                      28%                                                                        Northeast                36%
                                                                                                                                                     South                      44%
                                                                                                                                               Mid-Atlantic                                 61%

BASE: EMPLOYED (546)
Q1. Looking ahead to these next few months during the COVID-19 pandemic, which of the following best describes your work situation?
                                                                                                                                                                                                 6
Harris Insights & Analytics LLC, A Stagwell Company © 2020
OAAA Q1 CONSUMER TRENDS FOR OOH

And Over a Quarter Will Be Taking a Mixed Approach, Especially Those in the
West, Northeast and South
                                       Looking ahead to these next few months during
                                       the COVID-19 pandemic, which of the following                                                  % Doing a Mix of Community / Working From Home
                                            best describes your work situation?
                                                                                                                                                      < $50k         19%
                                                                                                                                                    $50-99k             24%
                                                                                                                                                 $100-$150k                   30%
                                                                                                                                                     $150k+                    32%
                   I wll be commuting to                              45%
                   my job every day                                                                                                                   Gen Z                   31%
                                                                                                                                                   Millennial                28%
                   I will be doing a mix of
                   commuting and                                                                                                                      Gen X              25%
                   working from home                                                                                                               Boomer+               25%
                   I will be working from                             26%
                   home all of the time                                                                                                                West                        36%
                                                                                                                                              Mountain/Great…       19%
                                                                                                                                                    Midwest            19%
                                                                      28%                                                                         Northeast                    33%
                                                                                                                                                      South                    32%
                                                                                                                                                Mid-Atlantic     12%

BASE: EMPLOYED (546)
Q1. Looking ahead to these next few months during the COVID-19 pandemic, which of the following best describes your work situation?
                                                                                                                                                                                         7
Harris Insights & Analytics LLC, A Stagwell Company © 2020
OAAA Q1 CONSUMER TRENDS FOR OOH

While Only About A One-Quarter Will Be Working-From-Home Entirely

                                       Looking ahead to these next few months during
                                       the COVID-19 pandemic, which of the following                                                         % Working From Home All the Time
                                            best describes your work situation?
                                                                                                                                                    < $50k         24%
                                                                                                                                                   $50-99k          28%
                                                                                               72% Commuting                                    $100-$150k          28%
                                                                                               at least part time                                   $150k+               34%
                   I wll be commuting to                              45%
                   my job every day                                                                                                                  Gen Z         26%
                                                                                                                                                 Millennial         27%
                   I will be doing a mix of
                                                                                                                                                     Gen X          29%
                   commuting and
                   working from home                                                                                                              Boomer+           27%
                   I will be working from                             26%
                   home all of the time                                                                                                               West          28%
                                                                                                                                      Mountain/Great Plains              33%
                                                                                                                                                   Midwest           32%
                                                                      28%                                                                        Northeast           31%
                                                                                                                                                     South         24%
                                                                                                                                               Mid-Atlantic         27%

BASE: EMPLOYED (546)
Q1. Looking ahead to these next few months during the COVID-19 pandemic, which of the following best describes your work situation?
                                                                                                                                                                                8
Harris Insights & Analytics LLC, A Stagwell Company © 2020
OAAA Q1 CONSUMER TRENDS FOR OOH

Vast Majority Will Be Commuting By Car After The Pandemic, but More Workers
Will Be Working From Home Post-Pandemic Than Before

                                                                     What would you say is your primary method of commuting to your job
                                                                                   at each of the following time periods?

                                                                               Before the pandemic                         At the moment                  After the pandemic

                                                                                                         74%
                                                                                                                         67%
                                                                                                                 63%

                                                                                                                                                                                                 41%         +12 pts
                                                                                                                                                                                                             from pre-covid
                                                                                                                                                                                                       28%
                                         23% 23%
                                                             19%                                                                              20%                    20%
                                                                     18%                                                                                                                   16%
                                                                             12%
                                                                                     16%                                                            14%
                                                                                                                                                          16%              14% 16%

                                                Walking             Bike or scooter                               Car                               Bus           Subway or light rail   Working from home

BASE: GENERAL PUBLIC (1000)
Q2. What would you say is your primary method of commuting to your job at each of the following time periods? Please select all that apply.                                                                              9
Harris Insights & Analytics LLC, A Stagwell Company © 2020
OAAA Q1 CONSUMER TRENDS FOR OOH

Urbanites
OAAA Q1 CONSUMER TRENDS FOR OOH

Today, Highways and Routes to Grocery and Retail Stores Are Most Optimal
for OOH to Meet Consumers
                                                                                 Thinking about your typical routine, how often do you
                                                                                          visit or go to each of the following?

                              Never                 Once a month or less              Once a week           Several times a week              Everyday           Once a week or more

                                                             Grocery store 3% 11%                               49%                            31%               6% 86%

                                                Driving on the highway            10%              20%                26%               26%                18%      70%

                                                              Retail stores        9%                     41%                       27%              18%         5% 50%

                                         Visit with friends or family               13%                   37%                       26%              16%     8%     50%

                                                               Restaurants             19%                      35%                     26%           16%        4% 46%         58% Millennial

                                                 Nearby cities or towns               18%                       40%                     21%          13%     8%     42%

                                                 Drug store / pharmacy             11%                      47%                           28%              11% 3% 42%

                                                         Local public parks                  31%                        35%                   16%     10% 8% 34%                49% Millennial

                          Downtown or "main street" shops                                         35%                       33%                17%     9% 5% 31%                52% Urban 1M+

                                                             Liquor stores                          45%                           28%           15%        7% 5% 28%            39% HHI $150k+

BASE: GENERAL PUBLIC (1000)
Q3. Thinking about your typical routine, how often do you visit or go to each of the following?                                                                                                  11
Harris Insights & Analytics LLC, A Stagwell Company © 2020
OAAA Q1 CONSUMER TRENDS FOR OOH

In Fact, Consumers Are Noticing OOH the Most While Driving Right Now

                                                             How often would you say you notice billboards, outdoor video screens, posters,
                                                                   signage, and other outdoor ads while doing each of the following?

                                                                                              Never          Sometimes               Often         Always      Notice at least sometimes

                                                              Driving on the highway                 17%                              50%                          23%          10%   83%

                                                                                                                                                                                            89% Urban 1M+
                                                    Driving around your town or city                  18%                                51%                        23%         8%    82%   79% Urban
OAAA Q1 CONSUMER TRENDS FOR OOH

Even During the Winter Months When People Are Indoors More, 41% Are
Noticing OOH More, Especially Younger Consumers
                                                                 Would you say you are noticing billboards, outdoor video screens, posters,
                                                                 signage, and other outdoor ads more now than before the pandemic began?

                                                                                                                                                                          % Yes
                                                                 45%                                     41%                                                           January 2021
                          Yes (Net)                                                                                          +5 pts increase in                   Suburban            33%
                                                                  14%                                    19%
                          Yes, much more                                                                                     those notice OOH                        Rural            34%
                                                                                                                             “much more”                         Urban 1M+                  55%
                          Yes, slightly more
                                                                  31%                                    23%                                                     Urban
OAAA Q1 CONSUMER TRENDS FOR OOH

Looking Ahead, Nearly a Third Plan to Travel and Over a Quarter Plan on
Taking a Road Trip – Especially Gen Z

                                                                   Thinking ahead to the next few months during the COVID-19 pandemic, how
                                                                    often would you say you plan on traveling outside of your typical routine?

             At least once                                   62%                                61%                                               53%                          23%
             (Net)
                                                                    73%                                         81%                                                             5%        35%
             Often                                           7%                                   8%                                                8%   67%                    8%
                                                                    of Millennials                              of Gen Z                           11%   of Millennials                   of HHI $150k+
             A few times                                     20%                                 18%                                                                           10%
             Once or twice
                                                                                                                                                   34%
             Never
                                                             34%                                 34%

                                                                                                                                                                               77%

                                                                                                                                                   47%
                                                             38%                                 39%

                                   Traveling outside of my local                      Taking a road trip                          Traveling to another state      Taking an international trip (or
                                              routine                                                                                                               traveling outside the US)

BASE: GENERAL PUBLIC (1000)
Q4. Thinking ahead to the next few months during the COVID-19 pandemic, how often would you say you plan on traveling outside of your typical routine?                                                    14
Harris Insights & Analytics LLC, A Stagwell Company © 2020
PART 2: WHAT’S RESONATING WITH CONSUMERS RIGHT NOW

                                                    OOH Messaging Amid COVID

                                                                                                                  15
Harris Insights & Analytics LLC, A Stagwell Company © 2020
OAAA Q1 CONSUMER TRENDS FOR OOH

OOH for Restaurants, TV & Movies, Politics, Public Events and New Products Is
Most Memorable, While New Brands Especially Engage Urbanites 1M+
                                                                                                                                                                                                           40%
                                                                                                                                                                                                           41%
                                                                                                             Local restaurants                                                                                    48%
                                                                                                                                                                                                            40%
 To the best of your knowledge, would you say you                                                                                                                                                           40%
                                                                                                                                                                                                         37%
    typically remember seeing outdoor ads from                                                                                                                                                         35%
                                                                                                        TV shows or movies                                                                26%
     billboards, outdoor video screens, posters,                                                                                                                                                                            56%
                                                                                                                                                                                                30%
      signage, etc. about each of the following?                                                                                                                                                   32%
                                                                                                                                                                                                 30%
                                                                                                          Political candidates                                                                            39%
                                                                                                                                                                                            28%
                                                                                                                                                                                                   33%
                                                                                                                                                                                                 32%
                                                                                                                                                                                                31%
                                                                            Public events (e.g., fairs, trade shows)                                                                      26%
                                                                                                                                                                                                          38%
                                                                                                                                                                                             29%
                                                                                                                                                                                             30%
                                                                                                                                                                                               31%
                                                                                                  New brands or products                                                   18%
                                                                                                                                                                                                            41%
                                                                                                                                                                                         25%
                                                                                                                                                                                            28%                         General Public
                                                                                                                                                                                                  32%
                                                                                   Local retail or convenience stores                                                               23%
                                                                                                                                                                                                 31%                    Suburban
                                                                                                                                                                                        27%
                                                                                                                                                                                     24%                                Rural
                                                                                                                                                                                     25%
                                                                                           New businesses in your area                                                                   27%
                                                                                                                                                                                      25%                               Urban 1M+
                                                                                                                                                                                     24%
                                                                                                                                                                          19%                                           Urban
OAAA Q1 CONSUMER TRENDS FOR OOH

 OOH is Leading Consumers to Discover New Businesses and Brands, and
 Influencing Their Path to Purchase Especially Urbanites 1M+
                                                                                                                                                                                                                         27%
                                                                                                                                                                                                                             29%
                                                                                  Informed me of new businesses in my area                                                                                               27%
                                                                                                                                                                                                                       26%
Which of the following actions have                                                                                                                                                                                        28%
 billboards, outdoor video screens,                                                                                                                                                                                24%
                                                                                                                                                                                                                     25%
posters, signage, and other outdoor                                                                Helped me discover a new brand                                                           12%
                                                                                                                                                                                                                                   33%
 ads led you to do in the past year?                                                                                                                                                                         21%
                                                                                                                                                                                                           20%
     Please select all that apply.                                                                                                                                                                   17%
                                                                      Influenced my decision to buy a product or service                                                                                   20%
                                                                                                                                                                                                                                    34%
                                                                                                                                                                                                  15%
                                                                                                                                                                                                            20%
                                                                                                                                                                                                          19%
                                                             Helped me find a store or business while I was traveling                                                                                   18%
                                                                                                                                                                                                                     25%
                                                                                                                                                                                                         19%
                                                                                                                                                                                                  15%
                                                                                                                                                                                            12%                                General Public
                                                                                              Increased my favorability of a brand                                                   9%
                                                                                                                                                                                                                   24%
                                                                                                                                                                                           11%                                 Suburban
                                                                                                                                                                                              13%                              Rural
                                                                                                                                                                                         10%
                                                 Influenced my decision to vote for a political candidate or issue                                                                         11%
                                                                                                                                                                                                        18%                    Urban 1M+
                                                                                                                                                                                         11%
                                                                                                                                                                                       10%                                     Urban
OAAA Q1 CONSUMER TRENDS FOR OOH

Over Half of Consumers Notice OOH About Public Safety, and Almost Two-
Thirds of Consumers in Large Urban Areas 1M+
                                                              Have you seen any messages about public safety and security on outdoor video
                                                               screen, poster, signage, billboards, and other outdoor ads such as local public
                                                             safety, health updates and COVID protocols, curfew alerts, weather warnings, etc.?
                                                                                                     % Yes
                                                                                                     64%                                                     64%
                                                                                                                                                    59%

                                                    51%                                                                                                              51%
                                                                        48%
                                                                                                                     46%
                                                                                                                                                                              43%
                                                                                      38%

                                                General               Suburban       Rural          Urban          Urban                            Gen Z Millennial Gen X   Boomer
                                                Public                                               1M+
OAAA Q1 CONSUMER TRENDS FOR OOH

Over 70% say OOH Public Safety Messaging Makes Them Feel Informed and
Safe
                                                     How useful do you find messages on billboards, bus shelters, or other outdoor signage
                                                      are in providing essential information about public safety such as local public safety,
                                                           health updates and COVID protocols, curfew alerts, weather warnings, etc.?

                                                                                                                                                                          % Informed and safe
                                                                                                                                                            Suburban                              72%
                                                                                                          71%                                                    Rural                          65%
                                                                                              Informed and safe
                                                                                                                                                            Urban 1M+                                 79%
                                                                 They make me feel
                                                              somewhat more informed                                                                        Urban
PART 3:
                                     Digital Transformation Implications
                                                   for OOH

                                                                           20
Harris Insights & Analytics LLC, A Stagwell Company © 2020
OAAA Q1 CONSUMER TRENDS FOR OOH

Over 4 in 10 Are Using Contactless Payments More; Overall One-Fifth or More
Are Using New Technologies During the Pandemic

                                                                                       Are you using any of the following technologies
                                                                                            more since the start of the pandemic?

                                                               Contactless                                    QR codes                   Augmented reality
                                                               transactions

                                                               43%
                                                                                                            31%
                                                                                                                                         19%
  Not sure               No          Yes                                                                                                              70%
                                                                                                                       59%
                                                              9%         48%                               10%                            11%

                                                             36% Gen Z                                   35% West                         14% Suburban
                                                             49% Millennial                              28% Mountain/Plains              11% Rural
                                                             53% Gen X                                   25% Midwest                      34% Urban 1M+
                                                             35% Boomer+                                 45% Northeast                    13% Urban
OAAA Q1 CONSUMER TRENDS FOR OOH

Millennials, Urban Areas 1M+ Are Highest Users of New Technologies

                                                                                       Are you using any of the following technologies
                                                                                            more since the start of the pandemic?
                                                                                                            % Yes
                                                Contactless
                                                transactions                                                   QR codes                                        Augmented reality

                            Gen Z                             36%                                     Gen Z                35%                        Gen Z                      36%
                        Millennial                                  49%                           Millennial                  43%                 Millennial                    34%
                            Gen X                                    53%                              Gen X                  39%                      Gen X             15%
                        Boomer+                               35%                                 Boomer+          16%                            Boomer+        4%

                     Urban 1M+                                    51%                            Urban 1M+                  39%                  Urban 1M+                     34%
                     Urban
OAAA Q1 CONSUMER TRENDS FOR OOH

Over 4 in 10 Are Interested in Contactless Payments and QR Codes; Overall
One-Quarter or More Would Be Interested in Sales from New Technologies

                                                                                   Would you be interested in special sales or deals available
                                                                                            through these types of technologies?

                                                              Contactless
                                                              transactions                                  QR codes                             Augmented reality

                                                                   45%                                         41%                                  28%

  Not sure               No          Yes
                                                             16%                                         17%                                      18%
                                                                                                                                                              54%
                                                                         40%                                         42%

                                                             34%
OAAA Q1 CONSUMER TRENDS FOR OOH

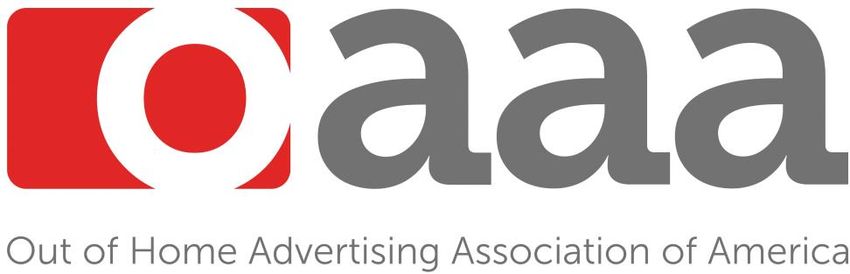
But ‘Digital Device Burnout’ Continues to Rise and Most Are Seeking Relief
Through Outdoor Activities
                                                              How much do you agree or disagree with each of the following statements?
                                                                                                                                                       % Agree
                                                                                                                                                             Change
                                                      Strongly disagree     Somewhat disagree     Somewhat agree    Strongly agree                 Jan ‘21
                                                                                                                                                             Sep ‘20

      These days, I spend so much time looking at computer, mobile
                                                                                           7%      18%              48%                27%          75%        +7
         device, and TV screens that I often tune out digital ads.

  I try to get out of the house as often as I can, even if it's just for a
                                                                                            8%         20%           47%               25%          72%        +7
                       drive or a walk around town.

    I've been trying to find safe outdoor activities to spend my time.                      9%         20%           46%               25%          71%        +6

                                   I wish there were more outdoor dining offerings.         11%         23%               46%           19%         66%        +6

At this point in the pandemic, I am trying to spend less time on my
                                                                                                 21%          36%                32%         11%    43%          -
       phone or computer and reduce my television viewing.

BASE: GENERAL PUBLIC (1000)
Q10. How much do you agree or disagree with each of the following statements?
                                                                                                                                                                       24
Harris Insights & Analytics LLC, A Stagwell Company © 2020
OAAA Q1 CONSUMER TRENDS FOR OOH

Gen Z Want More Outdoor Dining; Millennials to Simply Get Outside

                                          How much do you agree or disagree with
                                            each of the following statements?                   % Agree
                                                                                                                       71%
           These days, I spend so much time looking at computer, mobile                                                70%
              device, and TV screens that I often tune out digital ads.                                                  74%
                                                                                                                            80%
                                                                                                                             82%
                                             I wish there were more outdoor dining offerings.                         69%
                                                                                                                     66%
                                                                                                                 60%
                                                                                                                   63%
      I try to get out of the house as often as I can, even if it's just for a                                             78%
                           drive or a walk around town.                                                                 72%
                                                                                                                      69%
                                                                                                                 60%             Gen Z
         I've been trying to find safe outdoor activities to spend my time.                                                78%
                                                                                                                          76%    Millennial
                                                                                                                      68%
                                                                                                                  61%            Gen X
           At this point in the pandemic, I am trying to spend less time on                                     57%
              my phone or computer and reduce my television viewing.                                      41%
                                                                                                                                  Boomer+
                                                                                                 31%

BASE: GENERAL PUBLIC (1000)
Q10. How much do you agree or disagree with each of the following statements?
                                                                                                                                              25
Harris Insights & Analytics LLC, A Stagwell Company © 2020
OAAA Q1 CONSUMER TRENDS FOR OOH

This Winter, Millennials Are the Most Likely to Be Seeking Outdoor Activities
                                                                              Which of the following outdoor activities have you done or
                                                                                 plan to do this winter during COVID-19 pandemic?
                                                                                                                                                                                         58%
                                                                                                                                                                           43%
                                                             Walking or running in my neighborhood                                                                                      57%
                                                                                                                                                                                              63%
                                                                                                                                                                                            61%
                                                                                                                                                             29%
                                                                                                                                                              30%
                                                                                Going to public parks                                                               35%
                                                                                                                                                   22%
                                                                                                                                                            30%
                                                                                                                                                           28%
                                                                                                                                                          28%
                                                                           Shopping in outdoor areas                                                                 37%
                                                                                                                                                             31%
                                                                                                                                                    23%
                                                                                                                                                       25%
                                                                                                                                                  21%     28%
                                                                                       Outdoor dining
                                                                                                                                                           29%
                                                                                                                                                      24%
                                                                                                                                                     24%
                                                                                                                                                 20%
            Recreation such as hiking, visiting national parks, or the beach                                                                                  33%
                                                                                                                                                          29%
                                                                                                                                         15%
                                                                                                                                           17%
                                                                                                                                                       23%
                                                                   Spending time in downtown areas                                                            31%
                                                                                                                                8%
                                                                                                                                 10%
                                                                                                                                   12%
                                                                                                                                                     23%
                                                             Skiing, sledding, or other snow activities                                            22%
                                                                                                                                  10%
                                                                                                                          4%                                               General Public
                                                                                                                                   10%
                                                                                                                                                 19%                       Gen Z
                                                                Attending theme or amusement parks                                              18%
                                                                                                                                8%                                         Millennial
                                                                                                                         3%
                                                                                                                                                    23%
                                                                                                                                                   22%                     Gen X
                                                                                    None of the above                                           18%
                                                                                                                                                 19%         29%           Boomer+
BASE: GENERAL PUBLIC (1000)
Q5. Which of the following outdoor activities have you done or plan to do this winter during COVID-19 pandemic? Please select all that apply.                                                       26
Harris Insights & Analytics LLC, A Stagwell Company © 2020
OAAA Q1 CONSUMER TRENDS FOR OOH

Implications & Recommendations

                                 OOH is having outsized success with Urbanites 1M+, and there is opportunity to replicate impact for
                                 Urbanites
OAAA Contact:
                Laura Goldberg
                LBG Public Relations
                laura@lbgpr.com
                +1-347-683-1859

Harris Insights & Analytics, LLC, A Stagwell Company (c) 2020
You can also read